Mauli Kasmi*![]() | Andryanto Aman
| Andryanto Aman![]() | Asriany Asriany
| Asriany Asriany![]() | Randy Angriawan
| Randy Angriawan![]() | Karma Karma
| Karma Karma![]() | Ahmad Radi
| Ahmad Radi![]() | Ilham Ilham
| Ilham Ilham![]() | Hilda Yuliastuti
| Hilda Yuliastuti![]() | Sulkifli Sulkifli
| Sulkifli Sulkifli![]()
© 2023 IIETA. This article is published by IIETA and is licensed under the CC BY 4.0 license (http://creativecommons.org/licenses/by/4.0/).
OPEN ACCESS
Fluctuations in the stock levels of the ornamental angelfish export market have highlighted the necessity for an effective demand prediction system. In response to this need, the present study undertakes the development of a demand prediction model, employing the Least Square Method, for the ornamental angelfish market. The model is evaluated using a dataset comprising 4166 individual records across three ornamental angelfish samples from the year 2021. The model's predictive accuracy is quantitatively assessed through the Mean Absolute Deviation (MAD), Mean Square Error (MSE), and Mean Absolute Percentage Error (MAPE) compared to actual data. The results indicate a high level of accuracy, with an average MSE value of 39, an average MAD value of 5, and an average MAPE value of 5%. This study's findings contribute valuable insights to the ornamental angelfish export industry, demonstrating the efficacy of the Least Square Method in forecasting demand, and propose potential trajectories for further research.
accuracy assessment, demand prediction, Least Square Method, ornamental angelfish
1.1 Background and motivation
Indonesia, situated within the world's coral reef triangle, is recognized as a biodiversity hotspot, boasting a rich array of ornamental angelfish and diverse coral species [1-3]. The export of ornamental angelfish has emerged as a premium product within Indonesia's special economic zones, enhancing its economic vibrancy [4-6]. A surge in global interest for seawater ornamental angelfish from a variety of export destination countries has stimulated an expansion in the supply of these visually appealing aquatic species [7, 8]. However, enterprises involved in the trade of ornamental angelfish and corals face substantial challenges in accurately predicting demand, which often leads to uncertainties and inventory shortages in the ornamental angelfish stock [9, 10]. The existing reliance on semi-manual inventory computations frequently engenders data inaccuracies.
Several solutions have been proposed to ameliorate the issue of inventory shortages, prominently featuring the implementation of sales predictions or forecasting techniques. Forecasting entails the analysis of historical data with the aim to estimate future trends [11-14]. Accurate forecasts can aid investors in determining the appropriate stock level based on the predicted demand [15, 16], thereby facilitating informed decision-making and more precise predictions. A method or system that can accurately predict the demand for ornamental angelfish is, therefore, an essential prerequisite for maintaining sufficient stock levels.
In this context, the present study utilizes the Least Square prediction method due to its demonstrated efficacy in accurately forecasting the demand for ornamental angelfish. By employing linear equations, the Least Square Method identifies the optimal line that fits a given dataset and consequently enables the prediction of future data points [17-19].
1.2 Literature review
The Least Square Method has been extensively utilized in various predictive models, including forecasting raw material usage in chip production and sales, thereby aiding companies in planning for optimal raw material supplies to maximize chip production [20]. The method, celebrated for its wide application in data modeling, minimizes the sum of the squares of the residuals, furnishing the best fit. Depending on the nature of the residuals, the Least Square Method can be bifurcated into two categories: ordinary or linear Least Squares, and nonlinear Least Squares [21, 22].
Research [23] has successfully utilized the Least Square Method in predicting the intake of new university students, thereby facilitating decision-making during financial estimations. The findings of the study concluded that the Least Square Method, by producing results that are valid or approximate to the ground truth, can be effectively used to predict the number of new student admissions for upcoming periods based on data from previous years. The validity of this method was corroborated by test results over the last three years, demonstrating a validity of 97.8%.
The Least Square Method has also been deployed to predict coffee yields in Pagar Alam City, achieving the lowest prediction error rate with a Mean Percentage Error (MPE) of 13.72 and the highest accuracy using a Mean Absolute Percentage Error (MAPE) of 0.0166, as implemented in the Coffee Harvest Prediction Application. The prediction was based on coffee yield data from prior periods and was analyzed over the previous three years [24].
Furthermore, the Least Square Method has been applied to forecast the sale of palm shells, enabling companies to set more accurate sales targets and estimate sales for the forthcoming month over a year, starting from one month after the actual sales period. The data tested using the Mean Absolute Percentage Error (MAPE) revealed an error rate of 5.935% [25].
From the aforementioned studies, it can be inferred that the Least Square Method can be effectively employed to predict a variety of factors. In the present paper, the method is applied to predict the demand for ornamental angelfish using a website-based Least Square Method. The research is anticipated to assist companies like CV. Rezky Bahari in predicting the necessary types of ornamental angelfish and preparing their stock accordingly.
1.3 Theoretical framework
To construct a prediction system utilizing the Least Square Method, a deep understanding of the relevant theory is imperative, as it forms the foundation and design of the methodology.
1.3.1 Forecasting
Forecasting is a process that anticipates future sales or demand, enabling the determination of the requisite quantity of goods or services and the identification of potential market opportunities in the future [13, 26-28]. In this study, forecasting is employed to estimate the demand for ornamental angelfish.
A robust forecast is characterized by several key criteria: (1) accuracy, measured by the consistency and reliability of the forecasts, (2) cost-effectiveness, and (3) simplicity [29-32].
1.3.2 Ornamental angelfish
Ornamental angelfish, otherwise known as Marine Angelfish, are perciform fish of the family Pomacanthidae, widely coveted for their mesmerizing appearance. Inhabiting the shallow reefs of the tropical Atlantic, Indian, and an extensive part of the western Pacific Oceans [33, 34], these fish, celebrated for their vibrant colors and elegant appearance, have captured the hearts of aquarium enthusiasts and collectors globally. Bearing resemblance to butterfly fish, they have become a favored choice for marine aquariums.
CV. Rezky Bahari offers a diverse range of ornamental angelfish, encompassing Three-spot Angelfish Adult, Golden Angelfish, Bicolor Angelfish, Coralbeauty Angelfish, Keyhole Angelfish, Pearl-Scaled Angelfish, Multy-barred Angelfish, Whitetail Vermiculated Angelfish, Bellus Angelfish Male, Bellus Angelfish Female, Blackspot Angelfish Male, Blackspot Angelfish Female, Emperor Angelfish Adult, Emperor Angelfish Juvenile, Blue-Girdled Angelfish Adult, and Blue-Faced Angelfish Adult (W).
1.3.3 Least Square Method
The Least Square Method, a widely adopted technique in statistical modeling and time series analysis, estimates trends and generates predictions based on historical data [30, 35, 36]. In the context of forecasting the demand for ornamental angelfish in the export market, the Least Square Method is utilized to discern the inherent patterns and dynamics of the market. The analysis of past sales data and the identification of the linear relationship between time and demand is facilitated by the Least Square Method, thereby providing valuable insights into future demand trends for ornamental angelfish. The formula for the Least Square Method is represented in Eq. (1).
$Y=a+b X$ (1)
where:
Y: Number of Sales.
a and b: Coefficients.
X: The value is predetermined by time.
The description of X can be done using an alternative technique by assigning a score or code. The Least Square Method can be categorized into two cases: even data cases and odd data cases.
(1) For even data, the X value can be scored as: ..., -7, -5, -3, -1, 1, 3, 5, 7, …
(2) For odd data, the X value can be scored as: ..., -4, -3, -2, -1, 0, 1, 2, 3, 4, ...
Then, the coefficients a and b can be found by using Eqns. (2) and (3).
$a=\frac{\sum Y}{n}$ (2)
$b=\frac{\sum X Y}{\sum X^2}$ (3)
where,
a: the trend value in the base period.
b: the average growth rate of the trend value per period.
n: the number of periods.
ΣY: the cumulative volume of sales.
ΣXY: the sum of the products of the period number and its corresponding sales value.
ΣX2: the sum of the squared period numbers.
1.3.4 Error analysis
The accuracy of the Least Square Method in predicting the demand for ornamental angelfish is assessed through error analysis, wherein the predicted values are juxtaposed with the actual values [37]. This study employs three distinct types of comparative analyses for this purpose: Mean Absolute Deviation (MAD), Mean Squared Error (MSE), and Mean Absolute Percentage Error (MAPE). The application of these metrics ensures a robust evaluation of the prediction accuracy and aids in identifying areas for further refinement.
$M A D=\frac{\sum_{t=1}^n\left|A_t-F_t\right|}{n}$ (3)
$M S E=\frac{\sum_{t=1}^n\left(A_t-F_t\right)^2}{n}$ (4)
$M A P E=\frac{\sum_{t=1}^n\left|\frac{A_t-F_t}{A_t}\right|}{n} * 100$ (5)
1.4 Use Case Diagram
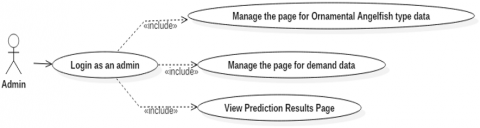
The Use Case Diagram, a component of Unified Modeling Language (UML), offers a comprehensive perspective on user interactions within the system [38, 39]. In a UML diagram, use cases are visualized as horizontal ellipses, with users connected to these ellipses via straight lines [40, 41]. Within the context of this study, the Use Case Diagram is employed to delineate the relationships among actors and activities within the prediction system designed for ornamental angelfish demand.
Figure 1. Use Case Diagram of the ornamental angelfish prediction system
The Use Case Diagram serves as a visual guide to the anticipated functionalities of the system, mapping out the interactions between the actors and the system. Within the context of the application for predicting ornamental angelfish demand, there exists one primary actor: the administrator. The administrator's responsibilities encompass management of various activities, such as data management for fish types, handling request data, and reviewing prediction results. Figure 1 presents a visual representation of these interactions and activities, as detailed in the Use Case Diagram.
2.1 Study design
CV. Rezky Bahari, a company that trades in ornamental fish and corals, is situated in Makassar city, South Sulawesi province, Indonesia. This study centers around predicting the demand for ornamental angelfish specifically for CV. Rezky Bahari, employing a web-based system developed using the PHP programming language. The demand for ornamental angelfish is forecasted on a monthly basis for a year, drawing upon the previous year's sales data to project demand for the forthcoming months. The PHP programming language forms a pivotal part of the system, chiefly in the realms of data processing and analysis. Tasks such as retrieving sales data, performing calculations, and generating prediction results are handled by PHP. Its adaptability and compatibility with databases make it a suitable choice for this application.
2.2 Conceptual framework
2.2.1 Problem
CV. Rezky Bahari encounters challenges in accurately forecasting the demand for diverse species of ornamental angelfish, often leading to a surplus of less popular species and recurrent shortages of high-demand species.
2.2.2 Opportunity
Identifying the need for a refined prediction system, the researchers aim to devise a solution that enables more precise and efficient forecasting of ornamental angelfish demand.
2.2.3 Approach
The selected approach involves developing a web-based application system that integrates various components and methodologies to facilitate effective demand prediction for the ornamental angelfish market.
2.2.4 Software implementation
The deployment of the Ornamental fish Demand Prediction system includes a pretest phase to examine the system's functionality and dependability before full-scale implementation. Post-tests are conducted to assess the system's performance and to implement necessary modifications.
2.2.5 Software development
The development process encompasses the specification and design of the software, concentrating on creating a comprehensive Use Case Diagram to depict the interactions between system actors and activities.
2.2.6 Result
The end goal of this study is to achieve precise demand prediction for the ornamental angelfish export market. The Least Square Method forms the foundation of the prediction model, with the aim of providing reliable forecasts to inform stock management decisions and ensure the timely availability of the desired angelfish species.
2.3 Data collection
Data was gathered using various methods. Initial observations were made by collecting secondary data from CV. Rezky Bahari. A literature study was then conducted to obtain theoretical support from online sources. Interviews and Q&A sessions were held with knowledgeable individuals. Lastly, sales data of ornamental angelfish for 2020 and 2021 were sourced from CV. Rezky Bahari. The collected data was subsequently employed for analysis and prediction.
3.1 Testing of the Least Square Method calculation
This section delves into the process of executing calculation tests using the Least Square Method. For these tests, demand data spanning from 2020 to 2021 is employed. The calculation is conducted in two manners: By manual calculations and through the utilization of a bespoke website-based prediction system designed explicitly for ornamental angelfish.
3.1.1 Manual calculation for predicting the demand for ornamental angelfish
Table 1. Calculation of Apolemichthys Trimaculatus ornamental fish type in 2020
|
Apolemichthys trimaculatus 2020 |
||||
|
Month |
Y |
X |
XY |
X2 |
|
Jan. |
22 |
-11 |
-242 |
121 |
|
Feb. |
24 |
-9 |
-216 |
81 |
|
Mar. |
22 |
-7 |
-154 |
49 |
|
Apr. |
23 |
-5 |
-115 |
25 |
|
May. |
25 |
-3 |
-75 |
9 |
|
Jun. |
21 |
-1 |
-21 |
1 |
|
Jul. |
21 |
1 |
21 |
1 |
|
Aug. |
24 |
3 |
72 |
9 |
|
Sep. |
26 |
5 |
130 |
25 |
|
Oct. |
26 |
7 |
182 |
49 |
|
Nov. |
26 |
9 |
234 |
81 |
|
Dec. |
29 |
11 |
319 |
121 |
|
Total |
289 |
0 |
-242 |
572 |
Table 2. Calculation of ornamental fish demand for the Centropyge Bispinosus species in 2020
|
Centropyge bispinosus 2020 |
||||
|
Month |
Y |
X |
XY |
X2 |
|
Jan. |
163 |
-11 |
-1793 |
121 |
|
Feb. |
165 |
-9 |
-1485 |
81 |
|
Mar. |
161 |
-7 |
-1127 |
49 |
|
Apr. |
168 |
-5 |
-840 |
25 |
|
May. |
170 |
-3 |
-510 |
9 |
|
Jun. |
173 |
-1 |
-173 |
1 |
|
Jul. |
170 |
1 |
170 |
1 |
|
Aug. |
169 |
3 |
507 |
9 |
|
Sep. |
168 |
5 |
840 |
25 |
|
Oct. |
171 |
7 |
1197 |
49 |
|
Nov. |
170 |
9 |
1530 |
81 |
|
Dec. |
170 |
11 |
1870 |
121 |
|
Total |
289 |
0 |
-186 |
572 |
Table 3. Calculation of the type of ornamental fish Genicanthus Bellus in 2020
|
Apolemichthys trimaculatus 2020 |
||||
|
Month |
Y |
X |
XY |
X2 |
|
Jan. |
112 |
-11 |
-1232 |
121 |
|
Feb. |
115 |
-9 |
-1035 |
81 |
|
Mar. |
117 |
-7 |
-819 |
49 |
|
Apr. |
119 |
-5 |
-595 |
25 |
|
May. |
115 |
-3 |
-345 |
9 |
|
Jun. |
119 |
-1 |
-119 |
1 |
|
Jul. |
123 |
1 |
123 |
1 |
|
Aug. |
118 |
3 |
354 |
9 |
|
Sep. |
120 |
5 |
600 |
25 |
|
Oct. |
125 |
7 |
875 |
49 |
|
Nov. |
128 |
9 |
1152 |
81 |
|
Dec. |
127 |
11 |
1397 |
121 |
|
Total |
1438 |
0 |
356 |
572 |
In Tables 1, 2, and 3, the calculations for each type of ornamental fish are based on the demand data obtained from 2020 to 2021. Taking the species Apolemichthys Trimaculatus as an example, the monthly Y values signify the demand, while the X values represent the independent variable, which in this case are the observed months. The XY value is derived by multiplying the Y value with the corresponding X value for each month, and the X2 value is obtained by squaring the X value.
The formulas used to ascertain the values of XY and X2 are as follows:
XY=X × Y= -11 × 22= -242
X2= -112= 121
Similarly, for the Centropyge Bispinosus and Genicanthus Bellus species, the values of Y represent the demand, the values of X are the independent variable representing the observed months, and the value of XY is obtained by multiplying the Y value with the corresponding X value for each month, and X2 is obtained by squaring the X value.
To make predictions using the Least Square Method, the values of a and b need to be determined. The value of a is obtained by summing up the Y values (demand) and dividing it by the number of observations (n). In this case, the value of a is calculated as follows:
$\begin{gathered}a=\frac{\sum Y}{n} \\ a=\frac{289}{12} \\ a=24.08333\end{gathered}$
Furthermore, the value of b is obtained by dividing the sum of XY (the product of X and Y for each month) by the sum of X2 (the squared X values). In this case, the value of b is calculated as follows:
$\begin{aligned} b & =\frac{\sum X Y}{\sum X^2} \\ b & =\frac{-242}{572} \\ b & =0.23\end{aligned}$
Table 4. Prediction results for the demand of apolemichthys trimaculatus ornamental angelfish in 2021
|
Month |
Act |
Pre |
X |
Err |
Abs |
Sqr |
MAPE |
|
Jan. |
24 |
27 |
13 |
-3 |
3 |
9 |
13% |
|
Feb. |
26 |
28 |
15 |
-2 |
2 |
4 |
8% |
|
Mar. |
26 |
28 |
17 |
-2 |
2 |
4 |
8% |
|
Apr. |
28 |
29 |
19 |
-1 |
1 |
1 |
4% |
|
May. |
27 |
29 |
21 |
-2 |
2 |
4 |
7% |
|
Jun. |
26 |
30 |
23 |
-4 |
4 |
16 |
15% |
|
Jul. |
28 |
30 |
25 |
-2 |
2 |
4 |
7% |
|
Aug. |
28 |
30 |
27 |
-2 |
2 |
4 |
7% |
|
Sep. |
32 |
31 |
29 |
1 |
1 |
1 |
3% |
|
Oct. |
29 |
31 |
31 |
-2 |
2 |
4 |
7% |
|
Nov. |
30 |
32 |
33 |
-2 |
2 |
4 |
7% |
|
Dec. |
34 |
32 |
35 |
2 |
2 |
4 |
6% |
|
|
MAD |
MSE |
MAPE |
||||
|
Average |
2 |
5 |
8% |
||||
Table 5. Prediction results for the demand of centropyge bispinosus ornamental fish in 2021
|
Month |
Act |
Pre |
X |
Err |
Abs |
Sqr |
MAPE |
|
Jan. |
180 |
172 |
13 |
8 |
8 |
64 |
4% |
|
Feb. |
185 |
173 |
15 |
12 |
12 |
144 |
6% |
|
Mar. |
179 |
174 |
17 |
5 |
5 |
25 |
3% |
|
Apr. |
183 |
174 |
19 |
9 |
9 |
81 |
5% |
|
May. |
186 |
175 |
21 |
11 |
11 |
121 |
6% |
|
Jun. |
181 |
176 |
23 |
5 |
5 |
25 |
3% |
|
Jul. |
188 |
176 |
25 |
12 |
12 |
144 |
6% |
|
Aug. |
185 |
177 |
27 |
8 |
8 |
64 |
4% |
|
Sep. |
181 |
178 |
29 |
3 |
3 |
9 |
2% |
|
Oct. |
190 |
178 |
31 |
12 |
12 |
144 |
6% |
|
Nov. |
196 |
179 |
33 |
17 |
17 |
289 |
9% |
|
Dec. |
179 |
180 |
35 |
-1 |
1 |
1 |
1% |
|
|
|
|
|
|
MAD |
MSE |
MAPE |
|
Average |
9 |
93 |
5% |
||||
Table 6. Prediction results for the demand of genicanthus bellus ornamental fish in 2021
|
Month |
Act |
Pre |
X |
Err |
Abs |
Sqr |
MAPE |
|
Jan. |
131 |
128 |
13 |
3 |
3 |
9 |
2% |
|
Feb. |
133 |
129 |
15 |
4 |
4 |
16 |
3% |
|
Mar. |
130 |
130 |
17 |
0 |
0 |
0 |
0% |
|
Apr. |
136 |
132 |
19 |
4 |
4 |
16 |
3% |
|
May. |
134 |
133 |
21 |
1 |
1 |
1 |
1% |
|
Jun. |
137 |
134 |
23 |
3 |
3 |
9 |
2% |
|
Jul. |
125 |
135 |
25 |
-10 |
10 |
100 |
8% |
|
Aug. |
132 |
137 |
27 |
-5 |
5 |
25 |
4% |
|
Sep. |
136 |
138 |
29 |
-2 |
2 |
4 |
1% |
|
Oct. |
133 |
139 |
31 |
-6 |
6 |
36 |
5% |
|
Nov. |
138 |
140 |
33 |
-2 |
2 |
4 |
1% |
|
Dec. |
140 |
142 |
35 |
-2 |
2 |
4 |
1% |
|
|
|
|
|
|
MAD |
MSE |
MAPE |
|
|
|
|
|
|
4 |
19 |
3% |
By leveraging these formulas, we can derive the values of a and b, which are instrumental in making predictions using the Least Square Method.
Table 4 discloses the prediction results for the demand of Apolemichthys Trimaculatus ornamental angelfish in 2021. The table encompasses several columns: Mth (month), Act (actual demand), Pre (predicted demand), X (observed months), Err (error or the discrepancy between actual and predicted demand), Abs (absolute error), Sqr (squared error), and MAPE (Mean Absolute Percentage Error).
In order to procure the predicted values in Table 4, the Least Square Method is employed. The formula used is:
Pre (Y)=a + (b × X)
where, Pre represents the predicted demand, a is the intercept or value of Y when X is zero, b is the slope or the rate of change of Y for X, and X represents the observed months. For example, let's consider the first row of Table 4:
Mth: Jan
Act: 24
Pre: 27
X: 13
To calculate the predicted demand (Pre), we substitute the values into the formula:
Prediction (Y)=a + (b × X)=168.1667 + (0.325175 × 13)=172
The error (Err) is obtained by subtracting the actual demand (Act) from the predicted demand (Pre):
Err=Act - Pre =24 - 27= -3
Similarly, the absolute error (Abs) is the absolute value of the difference between Act and Pre. The squared error (Sqr) is the square of the error.
The Mean Absolute Deviation (MAD), Mean Squared Error (MSE), and Mean Absolute Percentage Error (MAPE) values are calculated to evaluate the accuracy of the predictions. These values indicate the average deviation, average squared deviation, and average percentage deviation, respectively, between the actual and predicted demand.
MAD=Act - Pre= 24 – 27= 3
MSE=(Act - Pre)2=32=9
MAPE=((Act – Pre) / Act) × 100%=3 / 24 × 100%=13%
The computations for Table 5 and Table 6 adhere to a similar methodology, wherein the predicted values are determined using the Least Square Method, and the corresponding error metrics are subsequently calculated.
The precision of the prediction data is examined using Mean Absolute Deviation (MAD), Mean Square Error (MSE), and Mean Absolute Percentage Error (MAPE) in juxtaposition with the actual data. A lower percentage of MAPE signifies higher accuracy. A MAPE value nearing zero indicates an insignificant percentage of prediction error. Table 7 presents the average values for three samples of diverse Ornamental angelfish species.
Table 7. Comparison of prediction accuracy for different types of ornamental angelfish
|
Ornamental angelfish species |
MAD |
MSE |
MAPE |
|
Apolemichthys Trimaculatus |
2 |
5 |
8% |
|
Centropyge Bispinosus |
9 |
93 |
5% |
|
Genicanthus Bellus |
4 |
19 |
3% |
|
Average |
5 |
39 |
5% |
Table 7 showcases a comparison of prediction accuracy for various types of ornamental angelfish. It exhibits the Mean Absolute Deviation (MAD), Mean Square Error (MSE), and Mean Absolute Percentage Error (MAPE) values for each angelfish species.
As per the table, the MAD values are 2 for Apolemichthys Trimaculatus, 9 for Centropyge Bispinosus, and 4 for Genicanthus Bellus. The MSE values are 5 for Apolemichthys Trimaculatus, 93 for Centropyge Bispinosus, and 19 for Genicanthus Bellus. The MAPE values are 8% for Apolemichthys Trimaculatus, 5% for Centropyge Bispinosus, and 3% for Genicanthus Bellus.
From these figures, it can be deduced that the predictions for Genicanthus Bellus exhibit superior accuracy relative to the other angelfish species, as denoted by the lower MAD and MSE values. In a broader perspective, the average MAD value is 5, the MAPE value is 5%, and the average MSE value is 39, signifying an overall high level of predictive accuracy.
3.1.2 Prediction calculation using the website-based system for ornamental angelfish
Section 3.1.2 explores the process of calculating the demand prediction for ornamental angelfish using a web-based system, which proffers several advantages over traditional manual calculations. The web-based system furnishes a user-friendly interface, rendering it both convenient and accessible [42]. Users can engage with the system from any device that has an internet connection, obviating the need for manual computations via spreadsheets or paper-based methods.
This system capitalizes on the PHP programming language and a MySQL database for implementation, which allows users to interact with the system through a web interface.
The deployment of the ornamental angelfish demand prediction system involves the PHP programming language and a MySQL database. PHP is a renowned server-side scripting language acclaimed for its capacity to interact with databases, while MySQL is a widely adopted open-source database management system. This pairing enables dynamic processing and data storage within the web-based system, thereby streamlining the calculation and analysis of demand prediction.
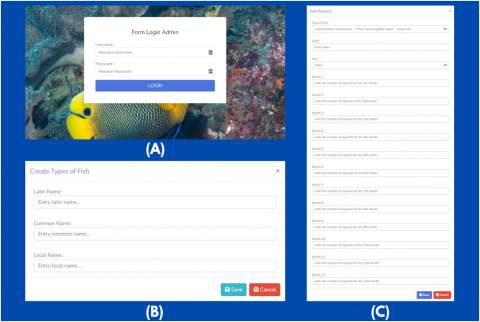
Figure 2 illustrates the user activities within the system. Users authenticate themselves by logging in with a unique username and password (A) to gain access to the system. Post-login, they have the option to input ornamental angelfish specifics such as the Latin Name, Common Name, and Local Name (B). Additionally, users can choose to input demand data for individual months or for the entire year (C).
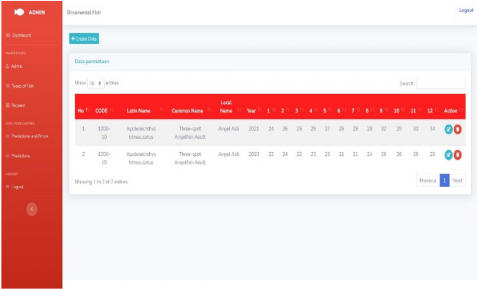
Figure 3 presents the page for inputting and viewing demand data for ornamental angelfish. The data entered here is utilized to extrapolate the demand for the subsequent year, specifically 2021. To ensure the precision of these predictions, the system hinges on the demand data from the year 2020. Moreover, the demand data for ornamental angelfish in 2021 serves to validate the accuracy of the predictions.
Figure 2. User interaction with the system through the web interface
Figure 3. Ornamental fish demand data page
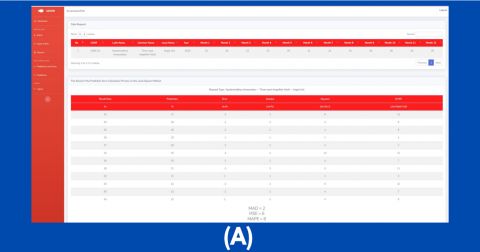
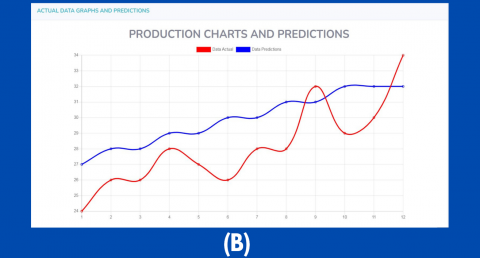
Figure 4. Prediction results for the demand of Apolemichthys Trimaculatus ornamental angelfish and data visualization
Figure 4 delineates the prediction results for the demand of Apolemichthys Trimaculatus ornamental angelfish in 2021 (A) and showcases a data visualization in the form of a graph. This graph plots the actual data line (red) and the predicted data line (blue).
Upon observing the data points on the graph, it's noticeable that the predicted demand closely mirrors the actual demand in most months. For instance, in January, the actual demand was recorded at 24, while the predicted demand was slightly higher at 27. Similarly, in February, the actual demand was 26, marginally lower than the predicted demand of 28.
However, there are instances where the predicted demand diverges from the actual demand. For example, in June, the actual demand was 26, whereas the predicted demand was higher at 30, indicating a difference of 4 units between the actual and predicted values. In December, the actual demand was 34, but the predicted demand was slightly lower at 32, showing a difference of 2 units.
These variations between the actual and predicted demand values propose that the prediction model may have limitations in precisely forecasting the demand for Apolemichthys Trimaculatus ornamental angelfish in certain months. Various factors can impact the demand for ornamental angelfish, such as the exchange rate of the rupiah against the US dollar, weather conditions, and an excessive supply of ornamental angelfish resulting from overexploitation.
The accuracy of the predictive model is intrinsically reliant on the quality and accessibility of historic data [43, 44]. In the event of incomplete or insufficient data, the model's proficiency in accurately encapsulating the complexities and dynamics of demand patterns is compromised [13]. Moreover, the assumption that historical demand patterns will persist in the future, a tenet of the model, may not always be valid, especially within a rapidly evolving market environment [45]. Additionally, the model's incapacity to consider external factors such as economic fluctuations, natural disasters, or regulatory changes, all of which can significantly influence demand, further constrains the model's accuracy. These limitations emphasize the necessity for ongoing data collection and updates to augment the model's precision and adaptability to changing conditions.
Fadil et al. [46] primarily focuses on forecasting the number of new students applying to each department using the Least Square Method. This study demonstrates that the method can forecast the number of students with a high degree of accuracy. The overall prediction results exhibit relatively minimal deviations when compared to the actual data, and the low MAPE value indicates a high degree of conformity. Conversely, Mufarroha et al. [47] centers around forecasting tourism ticket sales in Madura utilizing the Least Square Method. This study has developed a web-based prediction system that facilitates future ticket sales estimates. The research assesses the prediction errors using MAD and MAPE, although specific values are not stated. Despite the lack of detailed values, the study concludes that the Least Square Method achieves an acceptable level of accuracy in forecasting tourism ticket sales. Rajalakshmi et al. [48] primarily focuses on evaluating honey quality using the partial Least Square Method. The goal is to identify key components in honey such as moisture, glucose, fructose, and sucrose, and to predict these components using the Least Square Method. The research employs a Fourier transform infrared (FTIR) spectrometer with multivariate analysis and validates the results using chemical analysis. However, the abstract provided does not include specific information regarding prediction results and accuracy levels.
These three studies collectively apply the Least Square Method in diverse contexts. The research conducted by Irfan Fadil and Fifin Ayu Mufarroha exhibits consistent results, demonstrating high accuracy levels in prediction using the Least Square Method.
In this study, a model and demand prediction system has been successfully developed using the Least Square Method to predict the demand for ornamental angelfish. However, in order to refine and extend this model and prediction system in the future, several steps can be delineated. Firstly, future research could consider incorporating additional factors, such as seasonality and market trends, that may influence demand. Furthermore, more advanced modeling techniques, such as machine learning algorithms, could be explored to enhance the accuracy and precision of the predictions. Future research could also assess the performance of the prediction system in various market contexts and consider external factors like economic indicators and environmental conditions that can impact demand. By implementing these steps, the model and demand prediction system could be improved, thereby providing significant benefits for operational planning and decision making in the ornamental angelfish industry.
In conclusion, the findings of the research indicate that the ornamental angelfish demand prediction system, employing the Least Square Method, has exhibited notable proficiency in accurately forecasting future demand. The evaluation of the prediction results was conducted using Mean Absolute Deviation (MAD), Mean Square Error (MSE), and Mean Absolute Percentage Error (MAPE). An average MAD value of 5 was achieved by the system, highlighting a high level of precision in predicting ornamental angelfish demand. The MAPE calculation produced an average value of 5%, corroborating the accuracy of the predictions. The average value derived from the MSE calculation was 39, implying some divergence from the actual demand but nonetheless denoting a relatively accurate prediction overall.
This degree of accuracy carries substantial implications for the ornamental fish industry, offering invaluable insights for inventory management, production planning, and catering to customer demands. However, to further augment accuracy, future research may benefit from incorporating additional factors, such as seasonality and market trends, into the predictive model. Furthermore, the exploration of advanced modeling techniques, such as machine learning algorithms, may bolster the robustness and precision of the predictions.
The implementation of demand prediction systems predicated on accurate forecasting can facilitate businesses in optimizing their operations, curtailing waste, and efficiently meeting customer demands, thereby leading to enhanced profitability and customer satisfaction. Moreover, to maximize the advantages and impact of the demand prediction system, future research should concentrate on addressing the identified limitations, broadening the system to encompass other fish species, and evaluating its performance in various market contexts. The integration of real-time data sources and the inclusion of external factors such as economic indicators and environmental conditions may enhance the system's accuracy and reliability.
This research advances demand prediction methodologies and provides valuable insights for industry practitioners and researchers seeking to enhance their forecasting capabilities. The accurate demand prediction system possesses the potential to transform decision-making processes and operational efficiency across industries.
This work is supported by the Directorate General of Vocational Education, Pangkep State Agricultural Polytechnic, Universitas Teknologi Akba Makassar, Universitas Insan Cita Indonesia, CV. Rezky Bahari, the Indonesian Coral and Ornamental Fish Entrepreneurs Association (GAPEKHI), and the Indonesian Shellfish, Coral, and Ornamental Fish Association (AKKII).
Appendix presents a dataset consisting of sales data for various species of Ornamental angelfish across the years 2020 and 2021. The data is structured in a tabular manner, with each row corresponding to a distinct angelfish species and each column indicative of a month within the year. For the year 2020, the dataset incorporates the following variables:
Code: A unique identifier assigned to each angelfish species.
Latin Name: The scientific nomenclature of the angelfish species.
Common Name: The commonly recognized name of the angelfish species.
Local Name: The locally attributed name to the angelfish species.
Monthly Sales: The quantity of angelfish sold for each month, ranging from January to December.
Similarly, the 2021 dataset comprises the same variables, albeit with updated sales statistics for each month. The monthly sales figures denote the quantity of each angelfish species sold during a particular month. The figures within each cell represent the total number of angelfish sold for a specific species in a given month. For example, when scrutinizing the 2020 data for January, it is observed that 22 units of Three-spot Angelfish Adults, 163 units of Coralbeauty Angelfish, 112 units of Bellus Angelfish Males, and 220 units of Blue-Faced Angelfish Adults (W) were sold. These sales figures are consistently recorded for each month throughout the year.
|
Angelfish 2020 |
||||||||||||||||
|
No. |
Code |
Latin Name |
Common Name |
Local Name |
Jan. |
Feb. |
Mar. |
Apr. |
May. |
Jun. |
Jul. |
Aug. |
Sep. |
Oct. |
Nov. |
Dec. |
|
1. |
1000-10 |
Apolemichthys Trimaculatus |
Apolemichthys Trimaculatus |
Angel Asli |
22 |
24 |
22 |
23 |
25 |
21 |
24 |
26 |
28 |
26 |
26 |
29 |
|
2. |
1005-20 |
Centropyge Bispinosus |
Centropyge Bispinosus |
Angel Model |
163 |
165 |
160 |
168 |
170 |
173 |
170 |
169 |
168 |
171 |
170 |
170 |
|
3. |
1015-10 |
Genicanthus Bellus |
Genicanthus Bellus |
Angel Belo |
112 |
115 |
117 |
119 |
115 |
119 |
123 |
118 |
120 |
125 |
128 |
127 |
|
Angelfish 2021 |
||||||||||||||||
|
No. |
Code |
Latin Name |
Common Name |
Local Name |
Jan. |
Feb. |
Mar. |
Apr. |
May. |
Jun. |
Jul. |
Aug. |
Sep. |
Oct. |
Nov. |
Dec. |
|
1. |
1000-10 |
Apolemichthys Trimaculatus |
Apolemichthys Trimaculatus |
Angel Asli |
24 |
26 |
26 |
28 |
27 |
26 |
28 |
28 |
32 |
29 |
30 |
34 |
|
2. |
1005-20 |
Centropyge Bispinosus |
Centropyge Bispinosus |
Angel Model |
180 |
185 |
179 |
183 |
186 |
181 |
188 |
185 |
181 |
190 |
196 |
179 |
|
3. |
1015-10 |
Genicanthus Bellus |
Genicanthus Bellus |
Angel Belo |
131 |
133 |
130 |
136 |
134 |
137 |
135 |
132 |
136 |
133 |
138 |
140 |
[1] Powderham, A.J., van der Meij, S. (2020). At the Heart of the Coral Triangle: Celebrating Biodiversity. CRC Press.
[2] Williams, S.L., Janetski, N., Abbott, J., Blankenhorn, S., Cheng, B., Crafton, R.E., Hameed, S.O., Rapi, S., Trockel, D. (2014). Ornamental marine species culture in the Coral Triangle: Seahorse demonstration project in the Spermonde Islands, Sulawesi, Indonesia. Environmental Management, 54: 1342-1355. https://doi.org/10.1007/s00267-014-0343-6
[3] Rhyne, A.L., Tlusty, M.F., Schofield, P.J., Kaufman, L.E.S., Morris Jr, J.A., Bruckner, A.W. (2012). Revealing the appetite of the marine aquarium fish trade: The volume and biodiversity of fish imported into the United States. PloS One, 7(5): e35808. https://doi.org/10.1371/journal.pone.0035808
[4] McFarland, B.J., McFarland, B.J. (2021). Blue procurement models. Conservation of Tropical Coral Reefs: A Review of Financial and Strategic Solutions, 553-619. https://doi.org/10.1007/978-3-030-57012-5_14
[5] Cato, J.C., Brown, C.L. (2008). Marine Ornamental Species: Collection, Culture and Conservation. John Wiley & Sons.
[6] Larkin, S.L. (2008). Landings, and Market Opinions. Marine Ornamental Species: Collection, Culture and Conservation, 77.
[7] Setiyowati, H., Nugroho, M., Halik, A. (2022). Developing a blue economy in Depok West Java, Indonesia: Opportunities and challenges of neon tetra fish cultivation. Sustainability, 14(20): 13028. https://doi.org/10.3390/su142013028
[8] Lam, V.W.Y., Allison, E.H., Bell, J.D., Blythe, J., Cheung, W.W.L., Frölicher, T.L., Gasalla, M.A., Sumaila, U.R. (2020). Climate change, tropical fisheries and prospects for sustainable development. Nature Reviews Earth & Environment, 1(9): 440-454. https://doi.org/10.1038/s43017-020-0071-9
[9] Gantini, T., Dasipah, E., Suseno, G.P., Sondari, N., Yusup, A. (2022). Analysis of fisheries business development in order to increase gross regional domestic product in Sukabumi City, West Java. Randwick International of Social Science Journal, 3(3): 639-649. https://doi.org/10.47175/rissj.v3i3.515
[10] Anderson, R.C. (2000). An Underwater Guide to Indonesia. University of Hawaii Press.
[11] Ja’afar, N.S., Mohamad, J., Ismail, S. (2021). Machine learning for property price prediction and price valuation: A systematic literature review. Planning Malaysia, 19. https://doi.org/10.21837/pm.v19i17.1018
[12] Challa, R., Chintha, S.P., Reddaiah, B., Rao, K.S. (2021). A novel fast searching algorithm based on least square regression. Revue d'Intelligence Artificielle, 35(1): 93-98. https://doi.org/10.18280/ria.350111
[13] Avila, A.M., Mezić, I. (2020). Data-driven analysis and forecasting of highway traffic dynamics. Nature Communications, 11(1): 2090. https://doi.org/10.1038/s41467-020-15582-5
[14] Safarishahrbijari, A. (2018). Workforce forecasting models: A systematic review. Journal of Forecasting, 37(7): 739-753. https://doi.org/10.1002/for.2541
[15] Kurani, A., Doshi, P., Vakharia, A., Shah, M. (2021). A comprehensive comparative study of artificial neural network (ANN) and support vector machines (SVM) on stock forecasting. Annals of Data Science, 10: 183-208. https://doi.org/10.1007/s40745-021-00344-x
[16] Khedr, A.E., Yaseen, N. (2017). Predicting stock market behavior using data mining technique and news sentiment analysis. International Journal of Intelligent Systems and Applications, 9(7): 22-30. https://doi.org/10.5815/ijisa.2017.07.03
[17] Hohmann, E., Wetzler, M.J., D’Agostino Jr, R.B. (2017). Research pearls: The significance of statistics and perils of pooling. Part 2: Predictive modeling. Arthroscopy: The Journal of Arthroscopic & Related Surgery, 33(7): 1423-1432. https://doi.org/10.1016/j.arthro.2017.01.054
[18] Kaytez, F. (2020). A hybrid approach based on autoregressive integrated moving average and least-square support vector machine for long-term forecasting of net electricity consumption. Energy, 197: 117200. https://doi.org/10.1016/j.energy.2020.117200
[19] Deo, R.C., Wen, X., Qi, F. (2016). A wavelet-coupled support vector machine model for forecasting global incident solar radiation using limited meteorological dataset. Applied Energy, 168: 568-593. https://doi.org/10.1016/j.apenergy.2016.01.130
[20] Lee, H.L., Whang, S. (2000). Information sharing in a supply chain. International Journal of Manufacturing Technology and Management, 1(1): 79-93. https://doi.org/10.1504/IJMTM.2000.001329
[21] Abazid, M., Abdulrahman, A., Samine, S. (2018). Least squares methods to forecast sales for company. International Journal of Scientific & Engineering Research, 9(6): 864-868.
[22] Liano, K. (1996). Robust error measure for supervised neural network learning with outliers. IEEE Transactions on Neural Networks, 7(1): 246-250. https://doi.org/10.1109/72.478411
[23] Mulyani, D. (2015). Prediction of new student numbers using Least Square Method. International Journal of Advanced Research in Artificial Intelligence, 4(5): 30-35. https://doi.org/10.14569/IJARAI.2015.041105
[24] Negara, E.S., Keni, K., Andryani, R. (2020). Data prediction for coffee harvest using Least Square Method. IOP Conference Series: Materials Science and Engineering, 1007(1): 12193. https://doi.org/10.1088/1757-899X/1007/1/012193
[25] Fahirah, L. (2020). The implementation of Least Square Method on the palm shells sales forecasting application. International Journal of Information Engineering & Electronic Business, 12(5): 1-13. https://doi.org/10.5815/ijieeb.2020.05.01
[26] Frechtling, D. (2012). Forecasting Tourism Demand. Routledge.
[27] Baehre, S., O’Dwyer, M., O’Malley, L., Lee, N. (2022). The use of Net Promoter Score (NPS) to predict sales growth: Insights from an empirical investigation. Journal of the Academy of Marketing Science, 50(1): 67-84. https://doi.org/10.1007/s11747-021-00790-2
[28] Ren, S., Chan, H.L., Siqin, T. (2020). Demand forecasting in retail operations for fashionable products: Methods, practices, and real case study. Annals of Operations Research, 291: 761-777. https://doi.org/10.1007/s10479-019-03148-8
[29] Tramonti, G. (2023). Cost-effectiveness of patient-matched pre-and on-treatment biomarkers in cancer therapy response prediction. Edinburgh Medical School Thesis and Dissertation Collection. https://doi.org/10.7488/era/3249
[30] Lestari, S.I.P., Andriani, M., GS, A.D., Subekti, P., Kurniawati, R. (2019). Peramalan Stok Spare Part Menggunakan Metode Least Square. SEFA BUMI PERSADA.
[31] Teng, X., Pang, J., Liu, F., Zou, C., Bai, X., Li, S., Zhang, Z. (2023). Fatigue life prediction of gray cast iron for cylinder head based on microstructure and machine learning. Acta Metallurgica Sinica (English Letters), 1-13. https://doi.org/10.1007/s40195-023-01566-z
[32] Snowsill, T. (2023). Modelling the cost-effectiveness of diagnostic tests. PharmacoEconomics, 41(4): 339-351. https://doi.org/10.1007/s40273-023-01241-2
[33] Rahmati-Holasoo, H., Ghalyanchilangeroudi, A., Kafi, Z.Z., Marandi, A., Shokrpoor, S., Imantalab, B., Mousavi, H.E. (2022). Detection of lymphocystis disease virus (LCDV) from yellowbar angelfish (Pomacanthus maculosus Forsskål, 1775) in Iran: Histopathological and phylogenetic analysis. Aquaculture, 562: 738862. https://doi.org/10.1016/j.aquaculture.2022.738862
[34] Calado, R., Olivotto, I., Oliver, M.P., Holt, G.J. (2017). Marine Ornamental Species Aquaculture (Vol. 712). Wiley Online Library. https://doi.org/10.1002/9781119169147
[35] Jaswanth, M., Narayana, N.K.L., Rahul, S., Subramani, R., Murali, K. (2022). Product price optimization using Least Square Method. 2022 IEEE 2nd International Conference on Mobile Networks and Wireless Communications (ICMNWC), Tumkur, Karnataka, India, pp. 1-5. https://doi.org/10.1109/ICMNWC56175.2022.10031834
[36] Montgomery, D.C., Jennings, C.L., Kulahci, M. (2015). Introduction to Time Series Analysis and Forecasting. John Wiley & Sons.
[37] Geetha, A., Santhakumar, J., Sundaram, K.M., Usha, S., Thentral, T.M.T., Boopathi, C.S., Ramya, R., Sathyamurthy, R. (2022). Prediction of hourly solar radiation in Tamil Nadu using ANN model with different learning algorithms. Energy Reports, 8: 664-671. https://doi.org/10.1016/j.egyr.2021.11.190
[38] Yanis, R.Z.I., Priyadi, Y., Puspitasari, S.Y. (2022). Measurement of similarity between use case description and sequence diagram in software requirement specification using text analysis for dtrain application. In 2022 2nd International Conference on Electronic and Electrical Engineering and Intelligent System (ICE3IS), pp. 328-333.
[39] Gustriansyah, R., Suhandi, N., Antony, F. (2019). The design of UML-based sales forecasting application. International Journal of Recent Technology and Engineering, 7(6): 1507-1511. https://doi.org/10.17605/OSF.IO/QYA8R
[40] Aman, A., Utami, L., Aras, M.K.A., Kasmi, M. (2022). Information system for monitoring the development of children with special needs. Ceddi Journal of Education, 1(2): 1-7. https://doi.org/10.56134/CJE.V1I2.24
[41] Filipova, O., Nikiforova, O. (2019). Definition of the criteria for layout of the UML use case diagrams. Applied Computer Systems, 24(1): 75-81. https://doi.org/10.2478/acss-2019-0010
[42] Aman, A., Kasmi, M., Ratnawati, Iskandar, A., Zam, W., Mustika, N., Laswi, A.S., Hidayati, W., Akbar Pandaka, A.U. (2023). The virtual tour panorama as a guide and education media of the historic objects at Datu Luwu Palace. Ingénierie des Systèmes d’Information, 28(2): 425-432. https://doi.org/10.18280/isi.280218
[43] AlShafeey, M., Csáki, C. (2021). Evaluating neural network and linear regression photovoltaic power forecasting models based on different input methods. Energy Reports, 7: 7601-7614. https://doi.org/10.1016/j.egyr.2021.10.125
[44] Lee, J.G., Lee, H.S., Park, M., Seo, J. (2022). Early-stage cost estimation model for power generation project with limited historical data. Engineering, Construction and Architectural Management, 29(7): 2599-2614. https://doi.org/10.1108/ECAM-04-2020-0261
[45] Chien, C.F., Lin, Y.S., Lin, S.K. (2020). Deep reinforcement learning for selecting demand forecast models to empower Industry 3.5 and an empirical study for a semiconductor component distributor. International Journal of Production Research, 58(9): 2784-2804. https://doi.org/10.1080/00207543.2020.1733125
[46] Fadil, I., Helmiawan, M.A., Junaedi, D.I. (2020). Analysis of data prediction generate by admission student application using Least Square Method. In 2020 8th International Conference on Cyber and IT Service Management (CITSM), Pangkal, Indonesia, pp. 1-5. https://doi.org/10.1109/CITSM50537.2020.9268840
[47] Mufarroha, F.A., Tholaby, A.T., Anamisa, D.R., Jauhari, A. (2023). The design of the Least Square Method on sales of admission tickets to Madura tourism in forecasting cases. AIP Conference Proceedings, 2679(1): 20005. https://doi.org/10.1063/5.0111385
[48] Rajalakshmi, G., Gopal, A., Pandian, R. (2021). An approach to assess the quality of honey using partial Least Square Method. International Journal of Electrical and Computer Engineering, 11(6): 4991-4998. https://doi.org/10.11591/ijece.v11i6.pp4991-4998