Grâce Yénin Edwige Johnson* | Joel Adepo | Beman Hamidja Kamagate | Souleymane Oumtanaga
© 2022 IIETA. This article is published by IIETA and is licensed under the CC BY 4.0 license (http://creativecommons.org/licenses/by/4.0/).
OPEN ACCESS
Data warehouses are environments used for data analysis and efficient decision making within companies. They are tools that allow the execution of complex and multidimensional queries. One of the security vulnerabilities that can be used by malicious users is data inference, which is the deduction of private information by devious means. In the present work, we tried to show that the existence of functional dependencies in the data can help to perform an inference attack by using supervised learning algorithms to infer private information. These algorithms are Support Vector Machine (SVM), Random Forest (RF), Bayesian Regularized Neural Network (BRNN) and K-Nearest Neighbors (K-NN). The BRNN provided a better performance in our study. This paper implements an inference attack using regression learning algorithms, studies different dependency situations in the data, and uses the combination of COUNT, SUM, AVG and STDEV queries. The use of several methods in this study allows the prevention of inferences when one of these methods is used by a malicious user. We managed to achieve this attack by detecting 09.12% inferences on all methods compared to BRNN whose realized inference rate is 03.94%.
data security, inference control, supervised learning, aggregation queries, data warehouses
A data warehouse is a non-volatile, subject-oriented statistical database. The data are historized and do not suffer from updates [1]. Therefore, it is an environment that allows large-scale data storage. Data warehouses are at the heart of many decision-making systems. Given the amount of data being analyzed, these environments are outsourced to the cloud to take advantage of the almost unlimited storage space and computing power to boost the speed of query execution. These environments are favorable for data analysis and help companies to manage their business better. They also offer an environment for the execution of aggregated and multidimensional queries. Data warehouses require access control to protect the data from unauthorized access. However, these access policies are insufficient for ensuring flawless security. Indeed, the Online Analytical Processing (OLAP) server does not guarantee data confidentiality in the presence of data inference channels [2-4] realized by the combination of queries. Note that data inference is the process of deducing forbidden information by devious means.
Furthermore, with the evolution and popularization of automated learning algorithms, which are statistical inference methods, the primary use of learning algorithms can be misused to infer sensitive information during an inference attack [5, 6]. Supervised learning techniques attempt to discern results and learn by trying to find patterns in a labeled data set.
The predictions made from these learning algorithms can allow the inference of sensitive information when multiple aggregative functions are combined. Specifically, how can a malicious user, infer sensitive data from models such as a Support Vector Machine (SVM) [7], Random Forest (RF) [8], Bayesian Regularized Neural Network (BRNN) [9] and K-Nearest Neighbors (K-NN) [10]? Interest in using these algorithms lies in their different functioning. SVM is a generalization of linear classifiers; RF is based on decision trees; BRNN is an example of a neural network and K-NN is based on the distance. Our study used algorithms from various families. These algorithms have been recommended for robust regressions [11-16].
There may also be dimensions that influence the measure through statistical [17] or functional dependencies. Knowledge of these dependencies can guide malicious users during their attacks. In this study, we evaluated the impact of dependencies in an inference attack, using a combination of aggregative functions such as SUM, COUNT, AVG and STDEV. These functions summarize a set of rows from a clustering criterion by returning a statistical value. In this study, we established a logical rule to prevent inference attacks deployed on a data warehouse analysis server. This rule is based on a set of learning algorithms, to prevent inference attacks, when one of the methods is used by a malicious user. All queries executed by the analysis server were subjected to control to predict the realization of possible attacks. Thus, in the context of access restriction on queries to be executed in the warehouse, our study has the following particularities:
As the paper goes on, Section 2 presents a review of the work done in this field of study. Section 3 presents the inference attack scenario that we studied, and Section 4 presents our new approach. Section 5 implements our approach using the proposed example, shows the results obtained and proposes rules for managing detected inferences. Finally, Section 6 concludes our paper.
The problem of inference in data has attracted the attention of several researchers for decades, who have proposed various solutions to address this problem. Several studies have been conducted on the detection of inference attack that do not require automated learning algorithms [4, 17-24]. Each approach addresses a specific need and concerns different types of inference attacks. For example, the authors [20] proposed addressing the problem of inference in a data integration context. Indeed, dependencies in data lead to security breaches when they are not integrated into the specifications of local security policies. This approach consists of using formal concept analysis by proposing algorithms based on semantic constraints. Thus, we propose a global security policy that ensures the security of data during combinations of several queries which could lead to security violations. Another example is presented in the reference [4] which proposes limiting inferences in statistical databases. In a context in which the user is only allowed to perform queries on aggregated data, this study implements a solution to prevent a combination of multiple queries from disclosing the sensitive information of a single individual. The proposed approach is based on a frequent pattern mining technique. Following previous work, we present the state of the art related to the use of supervised learning models for performing inference attacks.
An example of an inference attack using a deep neural network was performed on data from a Chinese social network where the confidential data was the gender of individuals [5]. Owing to the confidentiality of this data, it was masked. In addition, there was no dependency on data. In this attack, the goal is to infer the age of the users from their public data. The neural network performed better than compared to the k nearest neighbors and the decision tree.
The authors [25] presented an example of an inference attack on secret cryptographic keys. By exploiting the vulnerability of Link Signature-Based (LSB) secret key extraction techniques, this study applies empirical Statistical Inference Attacks (SIA) to LSB key extraction. In these inference attacks, an attacker infers the signature of a target link, and retrieves the secret key extracted from the signature, by observing the surrounding links. Using several machine learning algorithms, such as Support Vector Machine, Artificial Neural Network, Multivariate Linear Regression and ensemble methods, the attack was successfully performed showing their effectiveness in finding keys of several orders of magnitude. This study did not consider the correlations between the links that may exist. However, the results revealed some correlations indicating that they can be exploited to improve certain attacks.
The authors [26] presented an inference attack on sensitive databases encrypted by the Property-Revealing Encryption (PRE) method and performed it using a multinomial inference technique. It takes advantage of the existing correlations between columns to improve the accuracy of predictions made by machine learning methods to deduce the columns protected by encryption. The proposed methodology was successfully evaluated using the medical data. The results of this study revealed that strong encryption with PRE is insufficient to protect data from inference attacks. Moreover, the authors advocate encrypting columns that can help infer sensitive data. However, the robustness of some learning algorithms may succeed in inferring sensitive data in some contexts. The problem of inference in strongly encrypted databases remains open.
The authors [27] presented a framework for sharing partial genomic data (sensitive data) on public platforms. They showed that the special features of genomic data and background knowledge that can be obtained from the web, and family relationships between individuals, can infer the hidden parts of shared (and unshared) genomes. This work improves on the existing work by proposing an inference-based attack on genomic privacy. Based on the complex correlations in the genome, information about the phenotype of the victims and the use of an observable Markov model and a recombination model between haplotypes, the authors propose an inference algorithm capable of inferring genomic data with greater efficiency.
The authors [6] presented a general framework called F-PAD to estimate the risk of the disclosure of private attributes. Indeed, in a context where users share some information on social networks to gain benefits (personalized services), F-PAD uses a set of learning methods (Generalized Bayesian Model, Logistic Regression, Support Vector Machine, and Random Forest) to reveal, with a high level, the disclosure risk in terms of probability, of the attributes "current city", "gender" and "age". This tool is intended for individual users of social networks and provides them with countermeasures to help reduce risk. The F-PAD can also be useful for regulatory sections of governments and organizations to promulgate privacy standards for social networks.
Section 2 demonstrates that it is possible to use supervised learning algorithms to realize inference attacks. Indeed, for each type of security present in the databases or data warehouse, an attacker can use a Machine Learning method depending on the context and the data to be manipulated, while also considering the robustness of the learning model. The presented works reveal that the dependencies in the data have an impact on the realization of an inference attack. To the best of our knowledge, existing learning-based methods using dependencies do not consider the combination of aggregative functions SUM, COUNT, AVG and STDEV in a query composed of a GROUP BY clause.
The following Section presents an inference attack on employee salary data considering the particularities mentioned above.
In this section, we discuss the scenario of an inference attack using supervised learning algorithms, in the context of dependency in the data using a combination of several aggregative functions. We consider the following scenario:
We assume a data warehouse aggregating the 2021 salary data of employees in Allegheny County (https://data.wprdc.org/dataset/allegheny-county-employee-salaries) (employeSalary2021), located in Pennsylvania. Note that an individual's salary is personal and private information. Knowledge of salary can incite a malicious person to perform social engineering which is a psychological fraud in the context of information security. It consists of using knowledge about an individual and abusing his trust, ignorance, or credulity, to obtain a service in a fraudulent way.
3.1 Security constraints
The security constraints associated with accessing and using the warehouse stipulate that the salary data is confidential, and the other attributes are public. Moreover, a user can only perform an aggregation query on the salary data if and only if the resulting dataset has a cardinality greater than one. This constraint is relative to the results of queries from a user of the data warehouse. Indeed, an aggregation query composed of aggregative functions returns statistics about a set of data or records resulting from that query. According to the work of Duncan and MUKHERJEE [28] and Basso et al. [29], the motivation for inference control through query restriction is that if a query produces a unique record, then that record can be identified, and sensitive information can be obtained from that record. Therefore, this constraint is necessary in this study.
3.2 Realization of the inference attack
A warehouse analyst, a malicious user, with restricted access as defined in Section 3.1, wants to perform an inference attack on warehouse data to infer the salaries of individuals for social engineering purposes. Here, we assume that he has knowledge of the public attributes of all employees. Furthermore, is known that some public attributes influence salaries. In our illustration, these public attributes are department (employee's department) and jobTitle (the position held by the employee). From the data warehouse, the malicious user executes queries of type:
"SELECT SUM(AnnualSalary), COUNT(AnnualSalary), AVG(AnnualSalary), STDEV(AnnualSalary) FROM employeeSalary2021 GROUP BY department, jobTitle".
This query returns a matrix composed of the results of each aggregative function in the column vector. The sum, number, mean, and standard deviation of each class concerned by the query are presented in a row vector. The subsets concerned by these results have cardinalities different from one. From the defined security constraints, all subsets with cardinalities equal to 1 are excluded by the analysis server.
From these informations, the malicious user can use one or more supervised learning algorithms to carry out his attack. To do so, he needs to train a model based on the salary data. It is assumed that, through fraudulent means, he obtains an old human resources file containing the salaries of employees in the same Allegheny County. In our study we used salary data from the year 2018 (employeSalary2018) (https://data.wprdc.org/dataset/allegheny-county-employee-salaries). this old data, the attacker models a learning matrix consisting of the following columns: Count, Sum, Avg, Stdev, SalaryMin, SalaryMax and Salary, which is the column to be predicted. Here, Count, Sum, Avg, Stdev are obtainedfrom the result of the query:
"SELECT SUM(AnnualSalary), COUNT(AnnualSalary), AVG(AnnualSalary), STDEV(AnnualSalary) FROM employeeSalary2018 GROUP BY department, jobTitle".
SalaryMin is the difference between the mean and the standard deviation and SalaryMax is the sum of the mean and the standard deviation. In our example, the user can use algorithms such as Gaussian Kernel SVM, Random Forest, Generalized Bayesian Neural Network, and k-nearest neighbors for their predictions. We use the repeated cross validation technique for better prediction performance. We justify this statement in section 5 (in 5.3 Training and testing phase). Indeed, this method is derived from cross-validation. It decomposes the data set into k folds so that each fold can be used in the training and testing phase. The performances of this method are presented in the work of Güney and Öztoprak [30].
After obtaining each model, an application was made with employee data for the year 2021. The data used for the prediction had the same characteristics as those of the trained 2018 data. That is, Count, Sum, Avg, Stdev, SalaryMin and SalaryMax. Here, the AnnualSalary column is confidential and unknown, and we wish to predict it. The inference attack was successfully performed. We present the results in Section 5.
In the following, we present our inference control approach in such a scenario.
This study addresses the problem of inference [24, 31] in queries when analyzing stored data. More explicitly, we show that in a scenario as we have described, it is possible to perform inference by combining the aggregative functions SUM, COUNT, AVG and STDEV. Next, we show the impact of statistical dependencies on the realization of inference attacks. Indeed, studies indicate that we can exploit these dependencies in queries [17, 32, 33] for better data selection. Furthermore, we show that a user can perform an inference attack based on regression learning methods. Therefore, we propose an inference detection approach based on regression learning methods and dependencies in the data. Section 5 presents the results and implications of this approach.
4.1 Proposed solution architecture
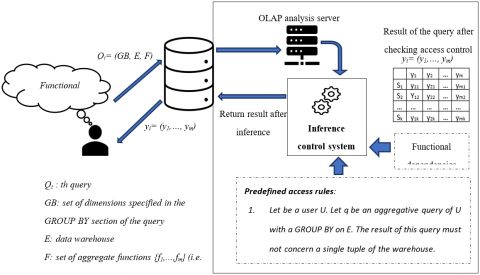
We assume that the inference attack to be produced considers some knowledge of the dependencies [17] between the dimensions (also called attributes or features) of the data warehouse. This knowledge leads the attacker to compose his query with a GROUP BY clause grouping the dimensions on which the measure depends. Each executed query is subjected to predefined access control constraints. In the traditional architecture of access control as shown in Figure 1, for an executed query, the OLAP server checks the query compliance. If the query is compliant then the result is returned.
After performing our inference attack, we showed that a compliant query can be used by a malicious user according to the experiments performed. Therefore, our control system is located at the server level and intercepts any query result to validate any query that cannot be used in an inference attack based on SVM, RF, KNN or BRNN. Figure 2 shows the architecture of the proposed monitoring system.
Figure 1. Traditional access control architecture
Figure 2. Proposed inference control architecture
The goal is to monitor query results and notify when these methods could infer at least one piece of information (confidential data) from these results. Our approach is based on the proposed architecture and allows the prediction of data inference if the results (yi= (y1,…, ym)) of the queries can be used by the above methods to infer sensitive information.
4.2 Our inference control system
The inference control module we propose is built around four main steps:
$M_{\text {Old }}=\left[\begin{array}{ccccc}y_{11} & y_{21} & \cdots & y_{m 1} & x_{11} \\ \cdots & \cdots & \cdots & \cdots & \cdots \\ y_{11} & y_{21} & \cdots & y_{m 1} & x_{1 j} \\ \vdots & \vdots & \vdots & \vdots & \vdots \\ y_{1 i} & y_{2 i} & \cdots & y_{m i} & x_{i 1} \\ \cdots & \cdots & \cdots & \cdots & \cdots \\ y_{1 i} & y_{2 i} & \cdots & y_{m i} & x_{i p}\end{array}\right]$ (1)
${{M}_{New}}=\left[ \begin{matrix} {{y}_{11}} & {{y}_{21}} & ... & {{y}_{m1}} \\ {{y}_{12}} & {{y}_{22}} & ... & {{y}_{m2}} \\ ... & ... & ... & ... \\ {{y}_{1i}} & {{y}_{2i}} & ... & {{y}_{mi}} \\\end{matrix} \right]$ (2)
The goal of our approach is to show that it is possible to predict certain warehouse measures from a combination of SUM, COUNT, AVG, and STDEV queries based on the previously stated assumptions and using a supervised regression learning method as the inference method. The measures are predicted by subset.
4.3 Our inference control model
This section presents our inference control model capable of preventing a user from inferring an AnnualSalary using a combination of COUNT, SUM, AVG, and STDEV queries using a supervised learning method such as BRNN, RF, K-NN, or SVM. Table 1 presents the annotations used in the proposed approach.
Table 1. Predicted values by inference method
|
Variables used |
Expression |
|
Predicted value |
$\hat{y}_{\text {model }}=\left(\hat{y}_{1_{\text {model }}}, \hat{y}_{2_{\text {model }}}, \cdots, \hat{y}_{m_{\text {model }}}\right)$ |
|
∆ predicted |
$\Delta_{i_{\text {model }}}=\left(\Delta_{i 1_{\text {model }}}, \Delta_{i 2_{\text {model }}}, \cdots, \Delta_{i n_{\text {model }}}\right)$ |
|
Threshold Predicted |
$S d_{\text {model }}=\left(S d_{1_{\text {model }}}, S d_{2_{\text {model }}}, \cdots, S d_{m_{\text {model }}}\right)$ |
|
Models used |
SVM, RF, BRNN, KNN |
With m: the number of subsets; n: the number of elements per subset and i = 1, 2, ..., m. In [24], the control rule used to control partial-type inferences are follows:
Rule 1: We assume that we wish to infer the measure from the arithmetic mean. For a given query, subdividing the data into n subsets (Si), we compute for each Si (with i ϵ {1,…,m}), the absolute value of the deviations of its elements from the mean by Eq. (3):
${{{x}'}_{ij}}=\left| {{x}_{ij}}-{{{\bar{X}}}_{i}} \right|$ (3)
Then, for each $x_{i j}^{\prime}$, we determine the contribution to the mean by Eq. (4):
$\Delta {{{x}'}_{ij}}={{f}_{ij}}\times \left| \frac{{{x}_{ij}}}{{{{\bar{X}}}_{i}}}-1 \right|$ (4)
If one of these contributions is lower than a threshold [24], presented by the Eq. (5):
$s{{d}_{i}}=\frac{1}{{{m}_{i}}}\times \frac{{{\sigma }_{i}}}{{{{\bar{X}}}_{i}}}$ (5)
Next, we say that there has been an inference. Based on previous works, we define a new learning-based inference control rule against inferences based on SVM, RF, BRNN and KNN methods.
Rule 2: From rule 1, considering each model, we compute for each predicted value obtained, the contribution ∆ij by Eq. (6) and the corresponding threshold Sdi in Eq. (7):
${{\Delta }_{i{{j}_{\bmod el}}}}={{f}_{ij}}*\left| \frac{{{x}_{ij}}}{{{{\hat{y}}}_{{{i}_{\bmod el}}}}}-1 \right|$ (6)
$S{{d}_{{{i}_{\bmod el}}}}=\frac{1}{{{m}_{i}}}\times \frac{{{\sigma }_{i}}}{{{{\hat{y}}}_{{{i}_{\bmod el}}}}}$ (7)
Then, considering all the inferences made by the model, and to propose a control based on all the methods used, we propose a logical rule presented by the following expression:
$\left. \begin{matrix} {{\Delta }_{i{{j}_{SVM}}}}\le S{{d}_{{{i}_{SVM}}}} \\ OR \\ {{\Delta }_{i{{j}_{RF}}}}\le S{{d}_{{{i}_{RF}}}} \\ OR \\ {{\Delta }_{i{{j}_{BRNN}}}}\le S{{d}_{{{i}_{BRNN}}}} \\ OR \\ {{\Delta }_{i{{j}_{KNN}}}}\le S{{d}_{{{i}_{KNN}}}} \\\end{matrix} \right|\text{=}TRUE$ (8)
For a given query, if this predicate is verified then an inference attack can be performed.
4.4 Proposed algorithms
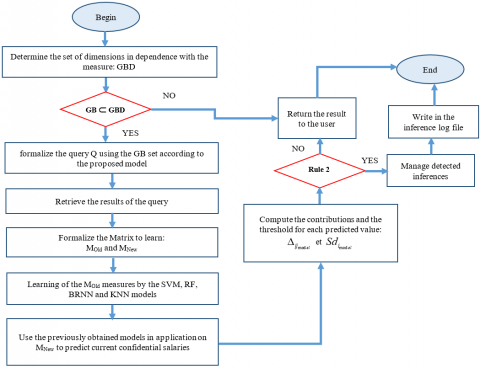
We describe the functioning of our system with the help of flowcharts to better understand the different steps described above. In a native manner, all database management systems or data warehouses record all the activities of a user in a single log file. For the sake of organization, although a log file already exists, we propose recording the history of all queries that produce inferences in a specific log file that is different from the basic log file. This has the advantage of facilitating the exploitation of the history of queries processed by our system, by reducing the search time in the log file. In addition, we propose two flowcharts that differ in the level of control performed. Figure 3 shows the scenario using control based on rule 2 presented above. If at least one of the above inference methods is used, then this rule is used. For a given query, all controls of this rule are checked. Figure 4 presents a scenario based on the choice of a better control model. This choice aims to reduce the checking time for a given query, by not checking all models simultaneously. The results show that this scenario is not optimal in terms of inference detection. However, it reduces the computation time.
Note that each step in the different scenarios is a series of instructions that may contain loops and control structures to obtain viable computed data without error. For example, the learning step consists of an iteration imposed by the cross-validation method. This iteration aims at improving the quality of the different predictions (see section 5). However, we have added a control structure after the second step. This check consists in testing the dependencies of the dimensions coming from the user's query.
Figure 3. Flowchart of the control system operation considering all models for an optimal result
Figure 4. Flowchart of the control system operation by selecting the best model to guarantee a better processing time of the request
5.1 Data model
The data of this study are the salary data of the years 2018 and 2021 of the employees of the county of Allegheny (https://data.wprdc.org/dataset/allegheny-county-employee-salaries). The simulations were performed at the National center of Computing of Ivory Coast (https://cncci.edu.ci/cncci/). This choice was made because of the massive amount of data to be processed and the computing power of this computer. Its computing power is 322.56 TFlops (322.56 thousand billion elementary calculations in one second); it has 7200 cores and 300 nodes; with 1.6 Po of data storage. The simulation tool used was Rstudio. Table 2 shows the data structure of the year 2021. In our study, the confidential data is the gross annual salary. The PayStatus column contains two values: Active and Terminated. For our experiments, we consider that employees are still active in the system. The number of non-active employees was 457 and the number of active employees was 5453. The initial dataset of salaries for the year 2021 had 5910 observations. After preprocessing the data, the final dataset consists of 5070 observations.
The second dataset of year 2018 salaries consists of 6073 data. Table 3 shows the data structure of this dataset. This dataset does not have a Sex column. Therefore, we proceeded to cross-reference the datasets employeSalary2021 and employeSalary2018 to assign gender to employees in the employeSalary2018 dataset. Finally, we obtained the 2018 and 2021 salaries of 2697 employees, which we used to simulate the inference attack.
Table 2. Structure of 2021 salary data for Allegheny County employees (employeSalary2021)
|
Column |
Type |
|
FirstName |
text |
|
LastName |
text |
|
Department |
text |
|
JobTitle |
text |
|
ElectedOfficial |
text |
|
DateStarted |
timestamp |
|
Sex |
text |
|
Ethnicity |
text |
|
OrigStart |
timestamp |
|
DateTerm |
timestamp |
|
PayStatus |
text |
|
AnnualSalary |
numeric |
|
RegularPay |
numeric |
|
OvertimePay |
numeric |
|
BonusPay |
numeric |
The final datasets selected were characterized by the following nine columns: LastName, FirstName, JobTitle, Department, DateStarted, Sex, Ethnicity, OrigStart and AnnualSalary. The remaining columns cannot be used among the cross-datasets because they characterize the employee at a given date (either 2021 or 2018).
Table 3. Structure of 2018 salary data for Allegheny County employees (employeSalary2018)
|
Column |
Type |
|
LastName |
text |
|
FirstName |
text |
|
JobTitle |
text |
|
Department |
text |
|
OriginalStartDate |
timestamp |
|
DateStarted |
timestamp |
|
DateTerm. |
text |
|
Status |
text |
|
AnnualSalary |
numeric |
|
YTDGrossPaythru |
text |
5.2 Analysis of the dependencies in the data
This section presents how the choice of dimensions in functional dependencies with AnnualSalary was performed. We recall that the purpose of this process is to show that such a choice could favor query results leading to inferences. Because the dimensions are specified in a GROUP BY clause, the data are grouped into sets that have the same criteria. This allows to have homogeneous groupings of salaries. Then, given the dependencies, the salaries in the same subset are relatively close. Similarly, a bad choice of dimensions would present varied subsets of salaries.
Table 4 presents the influence of the variables in the dataset on the "AnnualSalary" variable. We used the "lm" function of the R language which is used for regression analysis or analysis of variance. This analysis uses the Rsquared metric (Pearson's linear coefficient of determination) to show the importance of a variable in a regression model. This Table 4 shows the dependencies that exist between the public dimensions and the measure, when we consider the datasets employeSalary2018 and employeSalary2021. For each dataset, we analyze the dependencies in the variables from the regression models in Table 4 and their corresponding Rsquared value. A definition of Rsquared is given by Nagelkerke [34] who expresses it as the proportion of the variance explained by the regression model thus allowing the success of the prediction of the dependent variable from the independent variables. Thus, each value of Rsquared in Table 4 presents the proportion of the variance explained by the regression model according to the selected data set.
Table 4. Interaction of each variable in the dataset salaries through regression analysis
|
Regression model |
Multiple Rsquared (2018) |
Multiple Rsquared (2021) |
|
lm( AnnualSalary ~ JobTitle) |
0.8599 |
0.9267 |
|
lm( AnnualSalary ~ Department) |
0.2232 |
0.2755 |
|
lm(AnnualSalary ~ Sex) |
0.008755 |
0.01074 |
|
lm(AnnualSalary ~ DateStart) |
0.06486 |
0.03284 |
|
lm(AnnualSalary ~ Ethnicity) |
0.01171 |
0.0113 |
|
lm( AnnualSalary ~ OrigineStart) |
0.06332 |
0.03322 |
First, we analyzed the influence of each variable on AnnualSalary. These results reveal that the variable JobTitle has an influence of 85.99% on 2018 salaries and 92.67% on 2021 salaries. Next, the Department variable influences 2018 salaries at 22.32% and 2021 salaries at 27.55%. The other variables influence the AnnualSalary very weakly.
When we consider the simultaneous interaction of the two variables on salaries (Table 5), we find that all combinations containing the JobTitle variable strongly influence AnnualSalary. This is justified by the strong dependence between AnnualSalary and JobTitle. In this study we restrict ourselves to the interaction of two variables on AnnualSalary.
Table 5. Interaction of variables (combination of two) in the annual salary dataset through regression analysis
|
Regression model |
Multiple Rsquared (2018) |
Multiple Rsquared (2021) |
|
lm(Annualsalary ~ JobTitle + Department) |
0.864 |
0.9338 |
|
lm(Annualsalary ~ JobTitle + Sex) |
0.8599 |
0.9267 |
|
lm(Annualsalary ~ JobTitle + DateStart) |
0.8876 |
0.936 |
|
lm(Annualsalary ~ JobTitle + Ethnicity) |
0.86 |
0.9268 |
|
lm(Annualsalary ~ JobTitle + OrigineStart) |
0.8877 |
0.9361 |
From this analysis of the dependencies between AnnualSalary and the other variables, we have shown that JobTitle strongly influences AnnualSalary compared to the Department variable. The other variables had almost no influence on AnnualSalary. To highlight the influence of the dependencies, in a regression learning context, during an inference attack, we classify these queries into three groups: high risk (above 80%), medium risk (above 20% and below 80%) and low risk (below 20%). We justify this division of the risks into three groups, according to the value of the Rsquared corresponding to the selected model. The more this estimated percentage value tends towards 100%, the higher the risk of having a perfect fit of the regression model. Thus, the risk of inferring information is high. Based on these hypotheses, we conducted our experimentations. Consider the following queries Q1 and Q2 whose respective dependencies are 86.4% with the 2018 data and 93.38% with the 2021 data.
Q1 = "SELECT SUM(AnnualSalary), COUNT(AnnualSalary), AVG(AnnualSalary), STDEV(AnnualSalary) FROM employeeSalary2018 GROUP BY department, jobTitle".
Q2 = "SELECT SUM(AnnualSalary), COUNT(AnnualSalary), AVG(AnnualSalary), STDEV(AnnualSalary) FROM employeSalaire2021 GROUP BY department, jobTitle".
5.3 Training and testing phase
This section explains the experiments used to train the different prediction models. All data were used for training and testing using cross validation.
Cross-validation: Cross-validation is a technique used in the implementation of learning models to evaluate any machine learning algorithm. It is used in prediction frameworks where one wishes to estimate the accuracy of the performance of a predictive model. The goal of cross-validation is to significantly reduce the overfitting problems. It helps to generalize the model to an independent data set. This technique decomposes the data into k folds: k-1 folds are used for training and the last fold for testing. This process was repeated to involve each fold in the training and testing phases. In our study, we used a variation of this method which is repeated cross-validation, and which offers better performance [30] compared to cross-validation. It consists of repeating the cross-validation process several times. The purpose of this repetition was to optimize the prediction performance. The authors [35-37] recommended a value of k in the range from 5 to 10. However, other values were used [30, 38]. This leads us, for our study, to conduct several experiments to choose the best hyperparameters (number of folds and number of repetitions). We varied k from 5 to 30, by step of 5. Then for each number of folds, we proceeded to evaluate several numbers of repetitions r varying from 5 to 100, by step of 5. The goal of this approach is to choose the best couple (k,r) of hyperparameters having the best performance.
The results indicate that as the number of folds increases, the computation time of each algorithm increases. For example, Figure 5 shows the evolution of the CPU time required for prediction using the BRNN. Similarly, increasing the number of repetitions increases the execution time of the algorithms. Thus, there is a trade-off between computation time and accuracy to be achieved.
Figure 5. Impact of increasing the number of folds and the number of repetitions during the training by the " Bayesian Regularized Neural Network " algorithm for the query Q1
Given this growth in execution time when the number of folds increases, we opt for a maximum number of 10 folds as recommended by previous work [35-37] with several repetitions equal to 10. These results in terms of CPU computing time, expressed in milliseconds, are obtained thanks to the computing power made available to us by the National Computing Center of Côte d'Ivoire.
Performance measure: the performance metric used in this study was Rsquared. This metric is always positive and allows us to measure the differences between the predicted and actual values. Rsquared also known as the coefficient of determination, is between 0 and 1. The more this coefficient tends towards 1, the better it fits. This metric was used, when comparing several prediction models, to choose the best performing model. Eq. (9) allows to calculate this metric: where $\hat{y}$ is the predicted value; $y_{i}$ is the actual value; $\bar{y}$ is the average of the values to be predicted and n is the number of observations.
Rsquared $=1-\frac{\sum_{i=1}^{n}\left(y_{i}-\hat{y}\right)^{2}}{\sum_{i=1}^{n}\left(y_{i}-\bar{y}\right)^{2}}$ (9)
Table 6 presents the results of the cross-validation as described above. The results for the Rsquared metric present the best performance, in terms of predicting June 2018 salaries using the algorithms. Overall, the BRNN predicts June 2018 salaries better than the others models. In addition, the choice of 10 folds is justified by achieving better performance compared to several 5 folds.
Table 6. Performance (Rsquared) of each prediction regarding query Q1, with a repetition number of 10
|
SVM |
RF |
BRNN |
KNN |
|
|
5 folds |
73.10 % |
72.98 % |
76.06 % |
69.88 % |
|
10 folds |
73.25 % |
73.21 % |
76.11 % |
70.06 % |
5.4 Validation of the results
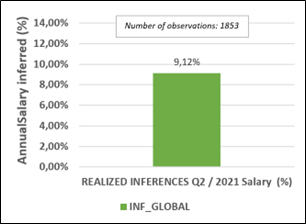
Figure 6. Inferences performed on 2021 salary data, combining the aggregative functions AVG, SUM, COUNT and STDEV and using several methods such as SVM, RF, BRNN, KNN
The prediction models selected in Table 8 were used to predict the 2021 salaries in the inference attack. We recall that for our study, we assume that the June 2021 salaries are unknown, and we wish to infer them from the results of the queries combining the aggregative functions AVG, COUNT, SUM and STDEV. Figure 6 shows the results of the inferences made in the inference attack. We detect the inferences using the different checking rules stated in section 4. This figure shows that, the number of observations concerned by the inference attack is 1853. While initially, the number of observations for the 2021 salaries was 2697. This is explained by the pre-processing that is performed after the execution of the queries: it is the exclusion of subsets consisting of a single element or whose standard deviation is zero. The exclusion of sets consisting of one element is justified by the access control constraint specified at the data warehouse level. Similarly, we exclude sets with zero standard deviations because in these cases, the mean accurately infers the salaries of these subsets.
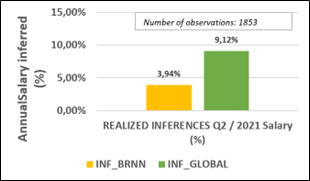
Our results show that it is possible to perform an inference attack on year 2021 salary data, when the AnnualSalary column is private and not accessible. This attack is performed in a context where the salary data of the year 2018 is known; where the attack is performed by combining the aggregative functions AVG, SUM, COUNT and STDEV, where learning algorithms are used as inference mechanisms. The results show that as the prediction model performs better, the number of inferences performed increases. For example, the BRNN performed in terms of prediction (76.11%) and allows the most inferences to be made (3.94%). Then comes the SVM with a prediction performance of 73.25% and an inference rate of 3.51%. Then, the RF has a prediction performance of 73.21% and an inference rate of 3.45%. Finally, the KNN which is the least performing (70.06%) has an inference rate of 3.08%.
The advantage of our study is that it uses a basket of several methods to ensure better control when one of its methods is used by an attacker. This control based on our basket of inference methods, is made possible by proposing a logical rule considering the inferences made by method. Figure 7 shows the detection capacity based on the logical rule proposed in our study. Our INF_GLOBAL approach, for the query Q2, presents a rate of 9.12%. We note that the detection rate presented by this figure is not defined as the sum of the inferences of each method.
We note that the detection rate presented by this figure is not defined as the sum of the inferences of each method. Indeed, some algorithms may or may not produce the same inferences. To illustrate our statements, we present the following Table 7 summarizing all the results obtained in terms of inferences realized.
Figure 7. Inference check performed by queries, based on our method basket and the proposed logical rule
Table 7. Analysis of the prediction time (CPU) of each algorithm
|
Algorithmes |
SVM |
RF |
BRNN |
KNN |
|
INF_SVM |
23 |
8 |
14 |
5 |
|
INF_RF |
8 |
18 |
13 |
5 |
|
INF_BRNN |
14 |
13 |
26 |
1 |
|
INF_KNN |
5 |
5 |
1 |
36 |
|
INF_RF / INF_BRNN |
10 |
0 |
0 |
5 |
|
INF_RF / INF_KNN |
1 |
0 |
5 |
0 |
|
INF_BRNN / INF_KNN |
0 |
5 |
0 |
0 |
|
INF_SVM / INF_KNN |
0 |
1 |
0 |
0 |
|
INF_BRNN / INF_SVM |
0 |
10 |
0 |
0 |
|
INF_SVM / INF_RF |
0 |
0 |
10 |
1 |
|
ALL |
4 |
4 |
4 |
4 |
|
REALIZED INFERENCES Q2 / 2021 Salary (%) |
3.51% |
3.45% |
3.94% |
3.08% |
This Table 7 presents the inferences made by models, showing the particularity of each case. The SVM, RF, BRNN and KNN algorithms have respectively detected 23, 18, 26 and 36 cases of inferences. In other terms, these 23 cases obtained by the SVM, were not detected by the other models. Similarly, the 18 inferences made by the RF, were not detected by the other models. This analysis is the same for the 26 BRNN inferences and the 36 KNN inferences. Also, this table shows the inferences that could be performed simultaneously by two, three or all four models in our study. For example, the BRNN makes 14 inferences that the SVM also manages to make. Similarly, the BRNN makes 10 inferences that the SVM and the RF also manage to make. The colored values represent the inferences made by combining all the models. They are without duplicates. The number of these inferences realized (in color) is 169, representing 9.12% which is the rate of inferences detected by our INF_GLOBAL approach.
Table 8. Analysis of the prediction time (CPU) of each algorithm
|
Algorithms |
CPU Time (milliseconds) |
|
BRNN |
9.63 |
|
KNN |
11.27 |
|
RF |
436.69 |
|
SVM |
45.89 |
|
Total CPU time (INF_GLOBAL) |
503.48 |
Although these results are satisfactory, insofar as the inferences are targeted according to the inference method used, there is a limit. Indeed, the computation time may be high because the proposed control is based on the combination of the inferences made from each predicted model and for an executed query. The following Table 8 presents the prediction time (CPU) of each regression algorithm and of our INF_GLOBAL approach. We estimate the computation time of INF_GLOBAL as the sum of the CPU prediction times of all the algorithms used in our model. For 1853 observations used in this study, we have the corresponding computation times recorded in Table 8.
Thus, in a real-world context of cloud data warehouse operations, where the data is much larger and expressed in terabytes, the computation times will be much higher than the CPU times observed in this study. Since our approach has the advantage of ensuring the inference control against several methods simultaneously, we advise to take advantage of the computational performances available from physical or cloud computing centers to overcome this limitation. Another compromise would be to select from our basket of methods used for inference attacks, the method with the best performance in terms of inference realization. Figure 8 shows the selection of the BRNN method for the Q2 query.
Figure 8. Selection of the method with the best performance in terms of inference realization
5.5 Management of detected inferences
The main objective of the inference control performed in this study is to generate alerts for risky queries. To realize an inference control support tool, we propose the following additional actions to be implemented by the data warehouse administrator:
These proposed actions make it possible to manage and delimit legitimate requests from those that are not.
This work is in the context of inference control in data warehouses when combining COUNT, SUM, AVG and STDEV aggregative features. We first presented a study highlighting an inference attack using supervised learning models such as Support Vector Machine (SVM), Random Forest (RF), Regularized Bayesian Neural Network (BRNN) and k-nearest neighbors (KNN). Then, we proposed a control rule based on these algorithms. Our study reveals that confidential information can be inferred from the combination of COUNT, SUM, AVG, and STDEV aggregate functions using the supervised regression learning algorithms SVM, RF, BRNN, and KNN. We note that the dependencies in the data, guarantee powerful prediction models and allow the realization of inference attacks. The more powerful the model, the more data it can infer. The proposed control logic rule allows to detect inferences when one of its inference methods is used. This work improves our previous study by exploring another inference attack scenario and proposing an appropriate control rule.
[1] Inmon, W.H. (2005). Building the Data Warehouse. John Wiley & Sons.
[2] Ma, J., Xing, M., Wang, X., Meng, J., Zhao, H. (2015). Research on multilevel secure database inference control. Journal of Applied Science and Engineering Innovation, 2(11): 451-454. Corpus ID: 20345545
[3] Woodruff, D., Staddon, J. (2004). Private inference control. In Proceedings of the 11th ACM Conference on Computer and Communications Security, pp. 188-197. https://doi.org/10.1145/1030083.1030109
[4] Aravind, K.N., Anand, A., Sarath, G. (2017). Inference detection in statistical database using frequent pattern. In 2017 International Conference on Communication and Signal Processing (ICCSP), pp. 1953-1956. https://doi.org/10.1109/ICCSP.2017.8286741
[5] Mei, B., Xiao, Y., Li, H., Cheng, X., Sun, Y. (2017). Inference attacks based on neural networks in social networks. In Proceedings of the Fifth ACM/IEEE Workshop on Hot Topics in Web Systems and Technologies, 1-6. https://doi.org/10.1145/3132465.3132469
[6] Han, X., Huang, H., Wang, L. (2019). F-PAD: Private attribute disclosure risk estimation in online social networks. IEEE Transactions on Dependable and Secure Computing, 16(6): 1054-1069. https://doi.org/10.1109/TDSC.2019.2934096
[7] Samadianfard, S., Jarhan, S., Salwana, E., Mosavi, A., Shamshirband, S., Akib, S. (2019). Support vector regression integrated with fruit fly optimization algorithm for river flow forecasting in Lake Urmia Basin. Water, 11(9): 1934. https://doi.org/10.3390/w11091934
[8] Jaiswal, J.K., Samikannu, R. (2017). Application of random forest algorithm on feature subset selection and classification and regression. In 2017 World Congress on Computing and Communication Technologies (WCCCT), pp. 65-68. https://doi.org/10.1109/WCCCT.2016.25
[9] Balram, D., Lian, K.Y., Sebastian, N. (2019). Air quality warning system based on a localized PM2. 5 soft sensor using a novel approach of Bayesian regularized neural network via forward feature selection. Ecotoxicology and Environmental Safety, 182: 109386. https://doi.org/10.1016/j.ecoenv.2019.109386
[10] Mittal, K., Aggarwal, G., Mahajan, P. (2019). Performance study of K-nearest neighbor classifier and K-means clustering for predicting the diagnostic accuracy. International Journal of Information Technology, 11(3): 535-540. https://doi.org/10.1007/s41870-018-0233-x
[11] Pahwa, N., Khalfay, N., Soni, V., Vora, D. (2017). Stock prediction using machine learning a review paper. International Journal of Computer Applications, 163(5): 36-43. https://doi.org/10.5120/ijca2017913453
[12] Zhang, W., Wu, C., Li, Y., Wang, L., Samui, P. (2021). Assessment of pile drivability using random forest regression and multivariate adaptive regression splines. Georisk: Assessment and Management of Risk for Engineered Systems and Geohazards, 15(1): 27-40. https://doi.org/10.1080/17499518.2019.1674340
[13] Peng, Z., Huang, Q., Han, Y. (2019). Model research on forecast of second-hand house price in Chengdu based on XGboost algorithm. In 2019 IEEE 11th International Conference on Advanced Infocomm Technology (ICAIT), pp.168-172. https://doi.org/10.1109/ICAIT.2019.8935894
[14] Burden, F., Winkler, D. (2008). Bayesian regularization of neural networks. Artificial Neural Networks, 23-42. https://doi.org/10.1007/978-1-60327-101-1_3
[15] Botchkarev, A. (2018). Evaluating hospital case cost prediction models using Azure Machine Learning Studio. arXiv preprint arXiv:1804.01825. https://doi.org/10.48550/arXiv.1804.01825
[16] Botchkarev, A. (2018). Evaluating performance of regression machine learning models using multiple error metrics in azure machine learning studio. SSRN. http://dx.doi.org/10.2139/ssrn.3177507
[17] Guarnieri, M., Marinovic, S., Basin, D. (2017). Securing databases from probabilistic inference. In 2017 IEEE 30th Computer Security Foundations Symposium (CSF), pp. 343-359. https://doi.org/10.1109/CSF.2017.30
[18] Triki, S., Ben-Abdallah, H., Feki, J., Harbi, N. (2011). Sécurisation des entrepôts de données contre les inférences précises et partielles. Ingénierie des Systèmes d Inf., 16(6): 117-138. https://doi.org/10.3166/isi.16.6.117-138
[19] Zhao, H.Y., Meng, J., Zhang, X. (2014). Research on Multilevel secure database inference channel. In Applied Mechanics and Materials, 644-650: 3310-3313. https://doi.org/10.4028/www.scientific.net/AMM.644-650.3310
[20] Sellami, M., Hacid, M.S., Gammoudi, M.M. (2015). Inference control in data integration systems. In OTM Confederated International Conferences, On the Move to Meaningful Internet Systems, pp. 285-302. https://doi.org/10.1007/978-3-319-26148-5_17
[21] Kundalwal, M.K., Singh, A., Chatterjee, K. (2018). A privacy framework in cloud computing for healthcare data. In 2018 International Conference on Advances in Computing, Communication Control and Networking (ICACCCN), pp. 58-63. https://doi.org/10.1109/ICACCCN.2018.8748480
[22] Kundalwal, M.K., Chatterjee, K., Singh, A. (2019). An improved privacy preservation technique in health-cloud. ICT Express, 5(3): 167-172. https://doi.org/10.1016/j.icte.2018.10.002
[23] Jebali, A., Sassi, S., Jemai, A. (2019). Inference control in distributed environment: A comparison study. In International Conference on Risks and Security of Internet and Systems, pp. 69-83. https://doi.org/10.1007/978-3-030-41568-6_5
[24] Grace Yenin Edwige, J., Joel, A., Souleymane, O. (2021). A mechanism for detecting partial inferences in data warehouses. International Journal of Advanced Research, 9(3): 369-378. https://doi.org/10.21474/ijar01/12593
[25] Zhu, R., Shu, T., Fu, H. (2017). Empirical statistical inference attack against PHY-layer key extraction in real environments. In MILCOM 2017-2017 IEEE Military Communications Conference (MILCOM), pp. 46-51. https://doi.org/10.1109/MILCOM.2017.8170755
[26] Bindschaedler, V., Grubbs, P., Cash, D., Ristenpart, T., Shmatikov, V. (2017). The tao of inference in privacy-protected databases. Cryptology ePrint Archive. Proceedings of the VLDB Endowment, 11(11): 1715-1728. https://doi.org/10.14778/3236187.3236217
[27] Deznabi, I., Mobayen, M., Jafari, N., Tastan, O., Ayday, E. (2017). An inference attack on genomic data using kinship, complex correlations, and phenotype information. IEEE/ACM transactions on Computational Biology and Bioinformatics, 15(4): 1333-1343. https://doi.org/10.1109/TCBB.2017.2709740.
[28] Duncan, G.T., Mukherjee, S. (2000). Optimal disclosure limitation strategy in statistical databases: Deterring tracker attacks through additive noise. Journal of the American Statistical Association, 95(451): 720-729. https://doi.org/10.1080/01621459.2000.10474260
[29] Basso, T., Matsunaga, R., Moraes, R., Antunes, N. (2016). Challenges on anonymity, privacy, and big data. In 2016 Seventh Latin-American Symposium on Dependable Computing (LADC), pp. 164-171. https://doi.org/10.1109/LADC.2016.34
[30] Güney, H., Öztoprak, H. (2018). Microarray-based cancer diagnosis: repeated cross-validation-based ensemble feature selection. Electronics Letters, 54(5): 272-274. https://doi.org/10.1049/el.2017.4550
[31] Farkas, C., Jajodia, S. (2002). The inference problem: A survey. ACM SIGKDD Explorations Newsletter, 4(2): 6-11. https://doi.org/10.1145/772862.772864
[32] Dieng, C.T. (2011). Etude et implantation de l'extraction de requêtes fréquentes dans les bases de données multidimensionnelles (Doctoral dissertation. Université de Cergy Pontoise; Université Gaston Berger (SENEGAL)).
[33] Brodsky, A., Farkas, C., Wijesekera, D., Wang, X.S. (2000). Constraints inference channels and secure databases. In International Conference on Principles and Practice of Constraint Programming, pp. 98-113. https://doi.org/10.1007/3-540-45349-0_9
[34] Nagelkerke, N.J. (1991). A note on a general definition of the coefficient of determination. Biometrika, 78(3): 691-692. https://doi.org/10.1093/biomet/78.3.691
[35] Kim, J.H. (2009). Estimating classification error rate: Repeated cross-validation, repeated hold-out and bootstrap. Computational Statistics & Data Analysis, 53(11): 3735-3745. https://doi.org/10.1016/j.csda.2009.04.009
[36] Berrar, D. (2019). Cross-Validation. in Encyclopedia of Bioinformatics and Computational, 542-545. https://doi.org/10.1016/B978-0-12-809633-8.20349-X
[37] Marcot, B.G., Hanea, A.M. (2021). What is an optimal value of k in k-fold cross-validation in discrete Bayesian network analysis? Computational Statistics, 36(3): 2009-2031. https://doi.org/10.1007/s00180-020-00999-9
[38] Mnich, K., Polewko-Klim, A., Golińska, A.K., Lesiński, W., Rudnicki, W.R. (2020). Super Learning with Repeated Cross Validation. In 2020 International Conference on Data Mining Workshops (ICDMW), pp. 629-635. https://doi.org/10.1109/ICDMW51313.2020.00089