Muhammed Yildirim* | Ahmet Cinar
© 2020 IIETA. This article is published by IIETA and is licensed under the CC BY 4.0 license (http://creativecommons.org/licenses/by/4.0/).
OPEN ACCESS
Alzheimer is a type of dementia disease that is common in older ages. This disease is a progressive form of neurological disease that causes the destruction of brain cells. Since Alzheimer's is a progressive disease, various problems increase over time. For this reason, it is very important to diagnose the disease early and start the treatment process. In this study, it was tried to determine at which stage the disease is or whether it is Alzheimer using brain images. CNN architectures are used to diagnose the disease. In addition, a hybrid method we have developed has been proposed. With the architectures used, it is classified in 4 stages according to the disease progression level. In the proposed hybrid model, the Resnet50 method is used as the basis. The results are obtained separately by Alexnet, Resnet50, Densenet201, Vgg16, and the Hybrid method we developed. An accuracy of 90% has been achieved with the developed hybrid model. Consequently, when other scientific paper in the literature are investigated, it is finalized that the hybrid model developed to diagnose Alzheimer’s disease has achieved the success achieved by other CNN architectures and even offers better results.
Alzheimer, deep learning, image processing, machine learning, CNN architectures
Alzheimer's is a neurological illness that occurs when brain cells are destroyed. Alzheimer patients suffer from confusion, difficulties in adapting to one's environment, problems related to speech and language skills, low motivation and problems. It is important to diagnose Alzheimer's illness early [1].
Studies on Alzheimer illness have been conducted in the literature. In their study, Lee et al. used deep learning methods for the diagnosis of Alzheimer's disease. They stated that when they used a single data method separately, they obtained an accuracy rate of 75%, and the second method they used achieved an accuracy rate of 81% [2].
Goo et al. applied more than one method in their study. They obtained accuracy values of 87.62% with CNN architectures, 85.61% with 2D SIFT method, 86.31% with 2D Kaze method, 85.26% with 3D SIFT method, and 83.15% with 3D Kaze method [3].
Zhao et al. stated that they obtained 92% accuracy by using SVM method in their study using 15 healthy and 15 patient data [4].
Ortiz et al. stated that using the deep learning methods, they increased the accuracy rate up to 90% in the diagnosis of the disease [5].
Moradi et al. stated that they achieved 90.2% accuracy using SVM and cross-validated. They used 10 folders for cross-validated. They stated that the results of their study played a major role in the diagnosis of the illness [6].
Salvatore et al. stated that they used a machine learning method that they optimized in their study for the diagnosis of Alzheimer disease and obtained the highest accuracy rate of 76% [7].
Lu et al. used the multiscale deep neural network structure to diagnose Alzheimer's illness. They stated that they used a data set taken from 1051 subjects and obtained an accuracy value of 82% [8].
In this paper, the Resnet50 architecture is used as the base and a hybrid model is proposed.
In this paper, CNN architectures are used to diagnose Alzheimer's illness. Results were obtained with Resnet50, Densenet201, Vgg16 and Alexnet architecture. Later, the classification operating was executed with the developed Hybrid model. The highest performance rate was achieved in the developed hybrid method. Resnet50 model was used as a base in the developed hybrid model. Some layers of Resnet50 model have been removed. In addition, new layers added to the Resnet50 model [9].
The article includes Theoretical Background in chapter 2, Application and Result in chapter 3 and Conclusion in chapter 4.
In this paper, deep learning architectures were used. Deep learning is a type of learning in which algorithms process data and perform the learning process inspired by the human brain [10].
2.1 Dataset
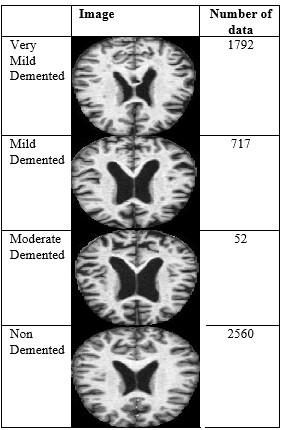
The data set used in this paper was taken from the open access Kaggle website. Alzheimer's Dataset consisting of MRI images was used in the study. There are 4 classes: Very Mild Demented, Mild Demented, Moderate Demented and Non Demented in the dataset used [11]. First of all, the data set was prepared and pre-processed. First of all, the network was trained with this data set [12]. It was then tested with test data. The amount of data and image samples used in the study are presented in Figure 1.
Figure 1. Images and image numbers
Figure 2. Structure of the hybrid model
2.2 Structure of systems
Instead of training a network from scratch in the proposed hybrid model, it is aimed to benefit from the current knowledge of Resnet50 architecture. In the improved hybrid model, the last five layers of Resnet50 have been removed. Ten new layers were added in place of these removed layers, and the number of layers increased from 177 to 182 [13]. The architecture of the proposed hybrid model is as in Figure 2.
The layers used in the developed hybrid model are explained respectively.
In this paper, it is aimed to classify using 4 class Alzheimer MRI images. First, the networks were trained with training data, and then they were tested using test data. While 80% of the data is used for training, 20% of the data is used for testing. The application was carried out on a computer with i7 processor in Matlab environment [14].
3.1 Performance metrics
There are several preferred methods for scale the performance of the classification. These calculations are calculated using the confusion matrix. The most preferred metrics are Accuracy, Precision, Recall and F-Score accuracy.
Confusion Matrix: The confusion matrix is one of the major metrics used in the classification process in CNN architectures. Other performance measures are calculated using the Confusion matrix [15]. Confusion Matrix used in the study is shown in Table 1.
Table 1. Confusion matrix
|
Classes |
C1 |
C2 |
C3 |
C4 |
|
C1 |
a1 |
a5 |
a9 |
a13 |
|
C2 |
a2 |
a6 |
a10 |
a14 |
|
C3 |
a3 |
a7 |
a11 |
a15 |
|
C4 |
a4 |
a8 |
a12 |
a16 |
True Negative (TN): What is really negative is that the data is estimated negatively [17].
False Positive (FP): The fact that it is actually negative is that data is estimated positively [18].
False Negative (FN): The fact that it is actually positive is that data is estimated negatively [19].
The metrics obtained from the confusion matrix are defined for class C1. The same values are calculated separately for other classes. a1 expression belongs to class C1 and is the number of correctly predicted values.
TP= a1
TN= Sum of all values except values in row and column C1
FP=a2+a3+a4
FN=a5+a9+a13
Accuracy (ACC): Calculation of the accuracy value is given in Eq. (1) [20].
$A C C=\frac{T P+T N}{T P+T N+F P+F N}$ (1)
Error Rate (ERR): Calculation of the error rate is given in Eq. (2) [21].
$E R R=\frac{F P+F N}{T P+T N+F P+F N}$ (2)
F-Score: The F-Score value is presented in Eq. (3) [22].
$F-Score=\frac{2 * { Precision } * { Recall }}{ { Precision }+ { Recall }}$ (3)
Precision $=\frac{T P}{T P+F P}$ (4)
$\operatorname{Recall}=\frac{T P}{T P+F N}$ (5)
$S P=\frac{T N}{T N+F P}$ (6)
3.2 Experimental results
In this paper, it is aimed to classify the data in 4 different stages of Alzheimer disease. CNN architectures and the Hybrid method we developed were used for education. Also the performance of the architectures has been tested with the metrics that we have presented the theory of in the title.
Abbreviations used in tables;
A=MildDemented
B=ModerateDemented
C=NonDemented
D=VeryMildDemented
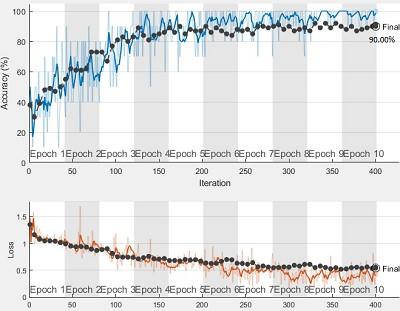
The accuracy and loss graphs of the network trained with the hybrid architecture we developed are presented in Figure 3.
When the network was tested with test data after training, the confusion matrix in Table 2 was obtained.
When the Confusion Matrix was examined, the hybrid model developed 90 test data correctly while placing 10 data in the wrong class. Accuracy rate in total is 90%. It achieved the highest accuracy rate in Class A with X%, while the lowest accuracy in Class B with y%.
Figure 3. Accuracy and loss curves of the hybrid model
Table 2. Confusion matrix of the Hybrid model
|
A |
29 |
- |
- |
1 |
|
B |
2 |
7 |
1 |
- |
|
C |
- |
1 |
27 |
2 |
|
D |
1 |
2 |
- |
27 |
|
|
A |
B |
C |
D |
While the developed Hybrid model achieved the highest accuracy rate in the MildDemented class, it achieved the lowest accuracy in the ModerateDemented class.
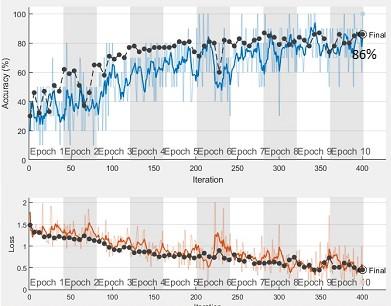
The accuracy and loss curves obtained using the Alexnet architecture are presented in Figure 4.
Table 3. Hybrid model performance criteria
|
|
Accuracy |
Precision |
Recall |
F-Score |
|
A |
96.6% |
96.6% |
90.62% |
%93.51 |
|
B |
70% |
70% |
70% |
%70 |
|
C |
90% |
90% |
96.42% |
%93.09 |
|
D |
90% |
90% |
90% |
%90 |
Figure 4. Alexnet accuracy and loss curves
Table 4. Alexnet confusion matrix
|
A |
30 |
- |
- |
- |
|
B |
9 |
1 |
- |
- |
|
C |
2 |
- |
27 |
1 |
|
D |
2 |
- |
- |
28 |
|
|
A |
B |
C |
D |
The Alexnet architecture, which was developed when Confusion Matrix was examined, classified 86 test data correctly and placed 14 data in the wrong class. The total accuracy rate is 86%.
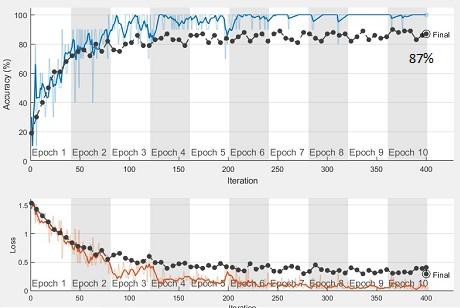
The accuracy and loss curves obtained using the Densenet201 architecture are presented in Figure 5.
Figure 5. Densenet201 accuracy and loss curves
The confusion matrix obtained after the network is trained and tested with test data is given in Table 5.
Table 5. Densenet201 confusion matrix
|
A |
30 |
- |
- |
- |
|
B |
7 |
3 |
- |
- |
|
C |
3 |
- |
25 |
2 |
|
D |
1 |
- |
- |
29 |
|
|
A |
B |
C |
D |
The accuracy and loss curves obtained using the Resnet50 architecture are presented in Figure 6.
Resnet50 architecture, which was developed when Confusion Matrix was examined, correctly classified 78 test data and placed 22 data in the wrong class. The total accuracy rate is 78%.
The accuracy and loss curves obtained using the Vgg16 architecture are presented in Figure 7.
The confusion matrix obtained after the network is trained and tested with test data is given in Table 7.
The Vgg16 architecture, which was developed when Confusion Matrix was examined, correctly classified 78 test data and placed 22 data in the wrong class. The total accuracy rate is 78%.
The results obtained with the developed hybrid model and other CNN architectures are given in Table 8.
Figure 6. Resnet50 accuracy and loss curves
The confusion matrix obtained after the network is trained and tested with test data is given in Table 6.
Table 6. Resnet50 confusion matrix
|
A |
27 |
1 |
2 |
- |
|
B |
5 |
4 |
1 |
- |
|
C |
- |
1 |
22 |
7 |
|
D |
- |
2 |
3 |
25 |
|
|
A |
B |
C |
D |
Figure 7. Vgg16 accuracy and loss curves
Table 7. Vgg16 confusion matrix
|
A |
29 |
1 |
- |
- |
|
B |
- |
10 |
- |
- |
|
C |
- |
2 |
25 |
3 |
|
D |
- |
10 |
6 |
14 |
|
|
A |
B |
C |
D |
Table 8. Accuracy rates of all models
|
Architectures Used |
Accuracy |
|
Densenet201 |
87% |
|
Vgg16 |
78% |
|
Alexnet |
86% |
|
Resnet50 |
78% |
|
Developed Hybrid Model |
90% |
Similar studies have been done in the literature before. But in most of the studies, 2 classes were used. It is either in 2 classes that he is sick or not. In this study, we have made an attempt to estimate the stage of the disease. The disease is classified in 4 stages in total. This is of very importance for the diagnosis of the illness. The previous studies related to the subject are presented in Table 9.
Table 9. Literature review table
|
Authors/Year |
Methods |
Accuracy |
|
Lee et al. /2019 [3] |
Deep Learning |
75.00% 81% |
|
Goo et al. /2017 [4] |
CNN, 2D SIFT, 2D KAZE, 3D SIFT, 3D KAZE. |
87.62% 85.61% 86.31% 85.26% 83.15% |
|
Zhao et al./2015 [5] |
SVM |
92% |
|
Ortiz et al./2016 [6] |
Deep Learning |
90% |
|
Moradi et al. /2015 [7] |
SVM |
90.2% |
|
Salvatore et al. /2015 [8] |
Machine Learning |
76% |
|
Lu et al. /2018 [9] |
Multiscale Deep Neural Network |
82% |
Alzheimer's is a type of neurological disease that occurs in later years. It causes many ailments such as losing human memory and confusion. People with Alzheimer's disease become unable to do their daily activities. It is of major importance that this disease can be diagnosed early by computer-aided systems. In this paper, Resnet50 model, one of the CNN-based architectures, was used as the basis in the method we improved. Thanks to the layers added and removed to the Resnet50 architecture, the accuracy rate of 78% has increased to 90% with the Hybrid model we have developed. This rate has a high success compared to previous studies. In addition, while most of the previous studies in the literature were working on two classes, a data set showing the 4 stages of the disease was used in our study. However, it is thought to be a high performance study.
[1] Irwin, M.R., Vitiello, M.V. (2019). Implications of sleep disturbance and inflammation for Alzheimer's disease dementia. The Lancet Neurology, 18(3): 296-306. https://doi.org/10.1016/S1474-4422(18)30450-2
[2] Lee, G., Nho, K., Kang, B., Sohn, K.A., Kim, D. (2019). Predicting Alzheimer’s disease progression using multi-modal deep learning approach. Scientific Reports, 9(1): 1-12. https://doi.org/10.1038/s41598-018-37769-z
[3] Gao, X.W., Hui, R., Tian, Z. (2017). Classification of CT brain images based on deep learning networks. Computer Methods and Programs in Biomedicine, 138: 49-56. https://doi.org/10.1016/j.cmpb.2016.10.007
[4] Zhao, Y., He, L. (2014). Deep learning in the EEG diagnosis of Alzheimer’s disease. In Asian Conference on Computer Vision, Springer, Cham, 340-353. https://doi.org/10.1007/978-3-319-16628-5_25
[5] Ortiz, A., Munilla, J., Gorriz, J.M., Ramirez, J. (2016). Ensembles of deep learning architectures for the early diagnosis of the Alzheimer’s disease. International journal of Neural Systems, 26(7): 1650025. https://doi.org/10.1142/S0129065716500258
[6] Moradi, E., Pepe, A., Gaser, C., Huttunen, H., Tohka, J., Alzheimer's Disease Neuroimaging Initiative. (2015). Machine learning framework for early MRI-based Alzheimer's conversion prediction in MCI subjects. Neuroimage, 104: 398-412. https://doi.org/10.1016/j.neuroimage.2014.10.002
[7] Salvatore, C., Cerasa, A., Battista, P., Gilardi, M.C., Quattrone, A., Castiglioni, I. (2015). Magnetic resonance imaging biomarkers for the early diagnosis of Alzheimer's disease: A machine learning approach. Frontiers in Neuroscience, 9: 307. https://doi.org/10.3389/fnins.2015.00307
[8] Lu, D., Popuri, K., Ding, G.W., Balachandar, R., Beg, M. F., Alzheimer’s Disease Neuroimaging Initiative. (2018). Multiscale deep neural network based analysis of FDG-PET images for the early diagnosis of Alzheimer’s disease. Medical İmage Analysis, 46: 26-34. https://doi.org/10.1016/j.media.2018.02.002
[9] Çinar, A., Yildirim, M. (2020). Classification of malaria cell images with deep learning architectures. Ingénierie des Systèmes d’Information, 25(1): 35-39. https://doi.org/10.18280/isi.250105
[10] Yildirim, M., Çinar, A. (2019). Classification of white blood cells by deep learning methods for diagnosing disease. Revue d'Intelligence Artificielle, 33(5): 335-340. https://doi.org/10.18280/ria.330502
[11] Kaggle. https://www.kaggle.com/datasets.
[12] Yildirim, M., Çinar, A. (2019). Simultaneously realization of ımage enhancement techniques on real-time fpga. 2019 International Artificial Intelligence and Data Processing Symposium (IDAP), Malatya, Turkey, pp. 1-6. https://doi.org/10.1109/IDAP.2019.8875959
[13] Çinar, A., Yıldırım, M. (2020). Detection of tumors on brain MRI images using the hybrid convolutional neural network architecture. Medical Hypotheses, 139: 109684. https://doi.org/10.1016/j.mehy.2020.109684
[14] Matlab. www.mathworks.com/products/matlab.html.
[15] Ruuska, S., Hämäläinen, W., Kajava, S., Mughal, M., Matilainen, P., Mononen, J. (2018). Evaluation of the confusion matrix method in the validation of an automated system for measuring feeding behaviour of cattle. Behavioural Processes, 148: 56-62. https://doi.org/10.1016/j.beproc.2018.01.004
[16] Deng, X., Liu, Q., Deng, Y., Mahadevan, S. (2016). An improved method to construct basic probability assignment based on the confusion matrix for classification problem. Information Sciences, 340-341: 250-261. https://doi.org/10.1016/j.ins.2016.01.033
[17] Chicco, D., Jurman, G. (2020). The advantages of the Matthews correlation coefficient (MCC) over F1 score and accuracy in binary classification evaluation. BMC Genomics, 21(1): 6. https://doi.org/10.1186/s12864-019-6413-7
[18] Yildirim, M., Cinar, A. (2020). A deep learning based hybrid approach for COVID-19 disease detections. Traitement du Signal, 37(3): 461-468. https://doi.org/10.18280/ts.370313
[19] Tharwat, A. (2018). Classification assessment methods. Applied Computing and Informatics. https://doi.org/10.1016/j.aci.2018.08.003
[20] Abdel-Zaher, A.M., Eldeib, A.M. (2016). Breast cancer classification using deep belief networks. Expert Systems with Applications, 46: 139-144. https://doi.org/10.1016/j.eswa.2015.10.015
[21] Xu, J., Zhang, Y., Miao, D. (2020). Three-way confusion matrix for classification: A measure driven view. Information Sciences, 507: 772-794. https://doi.org/10.1016/j.ins.2019.06.064
[22] Muhammad, K., Hussain, T., Baik, S.W. (2020). Efficient CNN based summarization of surveillance videos for resource-constrained devices. Pattern Recognition Letters, 130: 370-375. https://doi.org/10.1016/j.patrec.2018.08.003