Yue Liu | Hua Yang* | Gengxin Sun | Sheng Bin
© 2020 IIETA. This article is published by IIETA and is licensed under the CC BY 4.0 license (http://creativecommons.org/licenses/by/4.0/).
OPEN ACCESS
For solving the data sparsity of traditional algorithms, this paper proposes a novel collaborative filtering recommendation algorithm based on multi-relationship social network. On the basis of traditional matrix decomposition model, the proposed algorithm obtains the trust and trust feature matrix by integrating the user preferences of multi-relationship social network, and then, the rating of the commodity is predicted by the social feature matrix, the commodity feature matrix, and the similarity of user rating preference. In order to verify the reliability of the proposed algorithm, the Epinions dataset is used to compare the performance of the algorithm with that of the existing social network recommendation algorithms. According to the experimental results, the proposed algorithm had smaller mean absolute error (MAE) and root mean square error (RMSE), indicating that it has effectively reduced the impact of data sparsity on recommendation results and improved the recommendation accuracy.
collaborative filtering recommendation algorithm, complex network, matrix decomposition, data sparsity, social network
The basic idea of personalized recommender system is to recommend the commodities to the user according to his/her historical behaviors, aiming to provide better personalized services for the user. At present, personalized recommendation technology is mainly divided into collaborative filtering recommendation [1, 2], content-based recommendation [3], graph-based recommendation [4], and hybrid recommendation [5]. Thereinto, collaborative filtering recommendation, including model-based collaborative filtering and memory-based collaborative filtering detects the user's potential interests by analyzing his/her resources. It has become the most mature and popular recommendation technology in recommender systems [6, 7], laying the basis for prediction and recommendation.
However, there are some inherent defects in collaborative filtering recommendation. Firstly, the recommendation is grounded on the user-commodity rating matrix, which faces serious data sparsity problem in reality. Secondly, the technology suffers from the cold start problem because some users only rate a small portion of the commodities. Finally, the user-commodity rating matrix, as the single data source of the traditional method, might distort the recommendation result [8].
With the development of social networks, the connection between users is increasingly dependent on network social media, such as Facebook, WeChat and so on [9]. The social relationships act as an independent information source for recommender systems, and bring new inspirations to social recommendation algorithms. To a certain extent, the social relationship-based recommendation method alleviates the data sparsity and cold start [10, 11], and enhances the recommendation accuracy. Nevertheless, there are still two outstanding problems. For one thing, it is difficult to distinguish the trust degree between users, as only a few existing network datasets have user social relationship matrix, the elements of which are valued in binary data. For another, most of user social models only considers explicit user trust relationship, ignoring the implicit social relationship between users.
To overcome the above problems, this paper presents a collaborative filtering recommendation method which integrates social network information and user rating information. The method is realized through the following steps: 1. The user rating matrix and the user trust matrix are respectively mapped into low-dimensional space like user space, commodity space, trust space and trusted space. 2. Sparse user rating matrix is estimated based on social features, commodity feature vectors, and user similarity. 3. According to the intensive user rating matrix, the N top rated commodities are chosen to form a recommendation list. After that, the proposed algorithm is validated on the Epinions dataset. It is proved that the algorithm effectively alleviates the effect of data sparsity on recommendation results and elevates the recommendation accuracy.
The remainder of this paper is organized as follows: Section 2 briefly introduces the collaborative filtering algorithm based on the traditional decomposition model, and the proposed collaborative filtering method based on the social network relationship; Section 3 verifies the proposed algorithm by simulation, and gives the experimental results; Section 4 wraps up this research with some meaningful conclusions.
2.1 Literature review
Traditional collaborative filtering recommendation algorithms often pay more attention to the data in user rating matrix over the information between users. In practice, the importance of social network information is increasingly pronounced in recommender systems. More and more researchers have introduced the trust relationships of social networks into recommender systems. Massa et al. [12] proposed to integrate social trust relationship into recommendation algorithm, and replaced the traditional similarity with the trust degree between users to predict the user's vacancy value. Hu et al. [13] integrated the concept of social rules into the recommender system, and explained the contributions of the two social rules proposed in the system. Their experiment shows that the recommendation based on social rules effectively increase the recommendation accuracy. Wang et al. combined user social trust degree and rating similarity into a new matrix-filled recommendation method, which ameliorates the data sparsity in the recommendation process. Tran et al. [14] mapped the high-dimensional user rating matrix to the low-dimensional feature matrix, and adopted the user social information and the respective implicit data sources in recommendation.
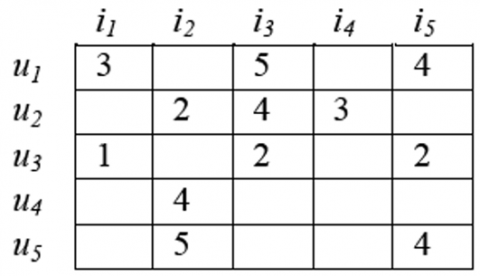
It is assumed that the proposed recommender system contains M users and N commodities, with R=[Ru,i]m×n representing the user-commodity rating matrix (Figure 1).
Figure 1. User-commodity matrix R
where, U={u1,u2,…,um} is a full set of users; I={i1,i2,…,in} is a full set of commodities; Ru,i∈[1,5] is the rating of user u to commodity i; 1~5 means “strongly dislike”, “dislike”, “neither like nor dislike”, “like” and “strongly like”, respectively. Empty rating indicates that the user has not rated the commodity.
The determination of the predicted rating of commodity $R_{u, i}^{\prime}$ is a crucial step in personalized recommendation. The recommendation accuracy of the system could be evaluated against the minimum difference between the actual and predicted ratings. In this way, the problem is converted into the search for the optimal solution. The target function of the problem can be formalized as follows:
$\min \sum_{u=1}^{m} \sum_{i=1}^{n}\left\|R_{u, i}-R_{u, i}^{\prime}\right\|^{2}$ (1)
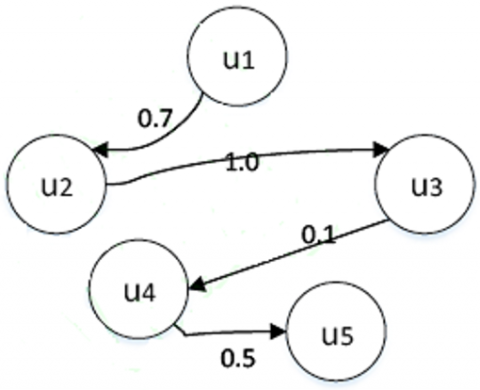
The prediction accuracy is bettered with additional social network data, as two users with similar preferences usually maintain a trust social relationship, i.e. once a user gives a high rating on a commodity, the other user is expected to give a high rating on that commodity, too. In a social network, the trust relationship between users can be represented by the matrix T=[Tu,v]m×m, where Tu,v∈[0, 1] is the trust degree between users (Figure 2).
Figure 2. Trust network T
From Figure 2, we can see that user u1 trusts user u2, u3 and u4.
The distrust relationship between users can be expressed by the matrix D=[Du,v]m×m, where Du,v∈(0, 1] is the distrust degree between users (Figure 3).
Figure 3. Distrust network D
It can be seen from Figure 3 that user u1 distrusts user u2.
2.2 Traditional matrix decomposition model
Capable of analyzing the data of user-commodity rating matrix, the matrix decomposition model has been extensively used in collaborative filtering recommendation algorithm. The matrix decomposition refers to decomposing a high-dimensional user rating matrix into a low-dimensional user feature matrix U∈Rl×m and a commodity feature matrix I∈Rl×n, where l≤min(m,n). The decomposed user features solely depend on a limited number of important features, and the rating matrix R can be approximated by UTI. The user rating data are typically mapped to [0,1] by functions f(x)=x⁄Rmax, where Rmax is the maximum user rating.
Based on matrix decomposition model, the traditional collaborative filtering method approximately fits the rating matrix with a simple linear model. The strategy is high likely to cause huge deviation between the actual and predicted ratings. To prevent overfitting, this paper introduces the nonlinear logistic function g(x)=1/(1+e-x) to map the predicted ratings in [0,1].
Using the user feature matrix U and the commodity feature matrix I, the minimum cost function φ of Eq. (1) is solved:
$\varphi=\sum_{(u, i) \in R}\left(R_{u, i}-g\left(U_{U}^{T} I_{i}\right)\right)^{2}+\lambda_{u}\|U\|_{F}^{2}+\lambda_{i}\|I\|_{F}^{2}$ (2)
where, $\|\cdot\|_{F}^{2}$ is the two-order bound norm; λu and λi are the regularization coefficients of the feature matrices U and I, respectively.
The user-commodity ratings can be predicted by Eq. (3):
$R_{u, i}=g\left(U_{u}^{T} V_{i}\right) \cdot R_{\max }$ (3)
2.3 Collaborative filtering method based on multi-relationship social network
Following the decomposition method based on the matrix decomposition model (Section 2.2), it is possible to decompose the high-dimensional trust relationship matrix T∈Rm×m into a low-dimensional trust feature matrix P∈Rk×m and a low-dimensional trusted feature matrix Q∈Rk×m, and approximate the value of the trust matrix T by a linear combination T=PTQ, where m is the number of users, and k≤m is the number of features.
It is assumed that whether user u trusts user v or not is determined by k feature factors. Then, the trust criteria of user u can be expressed by a k-dimensional vector Pu=[p1,p2,…,pk]T, the feature of the trusted user v can be expressed by Qv=[q1,q2,…,q]T, and the trust value Tuv of user u to user v can be approximated by $P_{u}^{T} Q_{v}$. Hence, the minimum cost function is shown in Eq. (4):
$\varphi=\sum_{(u, i) \in T}\left(T_{u, v}-g\left(P_{u}^{T} Q_{v}\right)\right)^{2}+\lambda_{p}\|P\|_{F}^{2}+\lambda_{q}\|Q\|_{F}^{2}$ (4)
where, λp and λq are the regularization coefficients of feature matrices P and Q, respectively. The predicted social trust data can be mapped in [0,1] by the nonlinear logistic function g(x)=1/(1+e-x).
Usually, users are partially correlated rather than completely independent. To calculate the correlation between users, the Pearson correlation method is employed as follows:
$\operatorname{Sim}_{1}(u, v)=\frac{\sum_{I}\left(r_{u i}-\bar{r}_{u}\right) \cdot\left(r_{v i}-\bar{r}_{v}\right)}{\sqrt{\sum_{I}\left(r_{u i}-\bar{r}_{u}\right)^{2}} \sqrt{\sum_{I}\left(r_{v i}-\bar{r}_{v}\right)^{2}}}$ (5)
where, I is the set of common rating commodities between users u and v; rui and rvi are the ratings on commodity i (i∈I) given by users u and v, respectively; $\overline{r_{u}}$ and $\overline{r_{v}}$ are the mean rating given by users u and v, respectively. The user rating preference is defined in Eq. (6):
$P(u, v)=\left(\frac{\left|I_{u} \cap I_{v}\right|^{(\geq t)}}{\left|I_{u}\right|^{(\geq t)}}+\frac{\left|I_{u} \cap I_{v}\right|^{(<t)}}{\left|I_{u}\right|^{(<t)}}\right) \times\left(\frac{\left|I_{u} \cap I_{v}\right|^{(\geq t)}}{\left|I_{v}\right|^{(\geq t)}}+\frac{\left|I_{u} \cap I_{v}\right|^{(<t)}}{\left|I_{v}\right|^{(<t)}}\right)$ (6)
where, t is the threshold between good and bad evaluations; Iu and Iv are the sets of commodities rated by users u and v, respectively.
The user preferences are then integrated into similarity computing. The preference-based similarity measurement method can be defined as follows:
$\operatorname{sim}(u, v)=P(u, v) \times \operatorname{sim}_{1}(u, v)$ (7)
where, P(u,v) is the preference degree between users; sim1(u,v) is the Pearson correlation coefficient between users. The minimum cost function φ of social trust relationship is shown in Eq. (8):
$\phi=\sum_{(u, v) \in T} \operatorname{sim}(u, v)\left(T_{u, v}-g\left(P_{u}^{T} Q_{v}\right)\right)^{2}+\lambda_{p}\|P\|_{F}^{2}+\lambda_{q}\|Q\|_{F}^{2}$ (8)
The existing studies on social network have shown that social and commodity features can be used to correct the predicted user ratings of commodities. The correction formula can be defined as follows:
$R_{u, i}=g\left(\beta P_{u}^{T} V_{i}+\gamma Q_{u}^{T} V_{i}+\theta \operatorname{sim}(u, v)\right)$ (9)
where, β, γ and θ∈(0,1) and β+γ+θ=1. The three parameters represent the contribution rates of trust feature vectors, trusted feature vectors and similarity, respectively.
In the proposed algorithm, the Euclidean distance of user feature vector is calculated to reflect the difference of preferences between users.
$\sum_{u=1}^{m} \sum_{w \in D(u)}\left\|P_{u}-P_{v}\right\|^{2}+\sum_{u=1}^{m} \sum_{w \in D(u)}\left\|Q_{u}-Q_{v}\right\|^{2}$ (10)
Based on Eq. (10), the minimum cost function φ can be redefined as follows:
$\phi=\sum_{(u, i) \in R}\left(g\left(\beta P_{u}^{T} V_{i}+(1-\beta) Q_{u}^{T} V_{i}\right)-R_{u, i}\right)^{2}$
$+\sum_{(u, v) \in T} \operatorname{sim}(u, v)\left(g\left(P_{u}^{T} Q_{v}\right)-T_{u, v}\right)^{2}+\lambda_{p}\|P\|_{F}^{2}+\lambda_{q}\|Q\|_{F}^{2}+\lambda_{v}\|V\|_{F}^{2}$
$-\lambda_{1} \sum_{u=1}^{m} \sum_{w \in D(u)}\left\|P_{u}-P_{v}\right\|^{2}-\lambda_{2}$
$\sum_{u=1}^{m} \sum_{w \in D(u)}\left\|Q_{u}-Q_{v}\right\|^{2}$ (11)
where, λ1 and λ2 are the regularization coefficients of social network feature matrix; λp, λq and λv are the regularization coefficients of matrices P, Q and V, respectively.
The reliability and validity of the proposed algorithm is verified through comparison with the existing social recommendation algorithms in the Epinions dataset [15]. The extremely sparse dataset consists of the rating data given by 49,290 users on 139,738 different commodities, as well as the social data between 664,824 users. 487,181 records signify positive relationships among users, while the rest of the records indicate distrust relationships. If the number of comments is fewer than 5, the users are considered as cold start users. The category covers more than half of the users in the dataset.
Two of the most common evaluation methods for recommendation performance are employed to verify the accuracy of these recommendation algorithms, namely, the statistical mean absolute error (MAE) [16, 17] and root mean square error (RMSE) [18, 19].
The formalization of MAE is shown in Eq. (12):
$M A E=\frac{\sum_{u, i \in T_{u}}\left|R_{u, i}-R_{u, i}^{\prime}\right|}{N}$ (12)
The formalization of MAE is shown in Eq. (13):
$R M S E=\sqrt{\frac{\sum_{u, i \in T_{u}}\left(R_{u, i}-R_{u, i}^{\prime}\right)^{2}}{N}}$ (13)
where, Tu is the user dataset in the test set; N is the quantity of commodities in the test set; Ru,i is the actual rating; $R_{u, i}^{\prime}$ is the rating given by user u to commodity i.
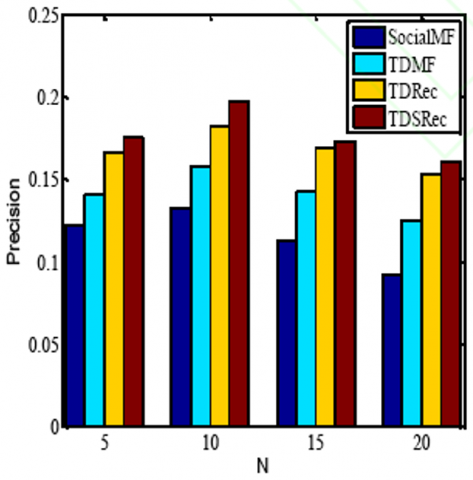
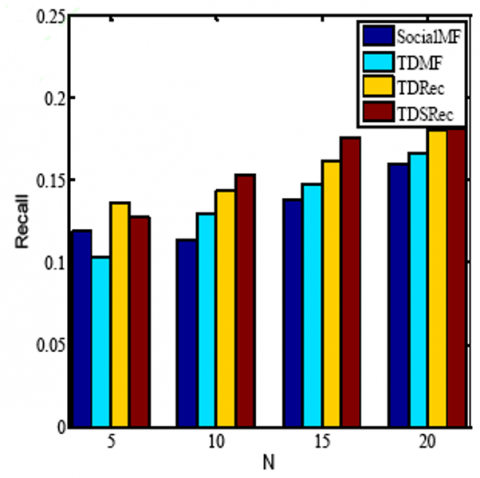
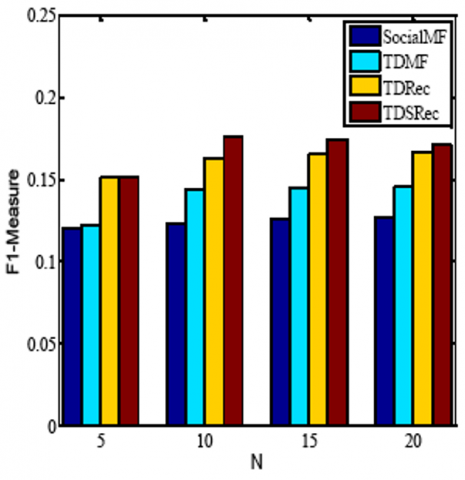
The Precision, Recall and F1-Measure [20, 21], as common tools for evaluating recommender systems, are respectively defined as follows:
Precision $=\frac{\sum_{u \in T_{u}}\left|L_{u} \cap B_{u}\right|}{\sum_{u \in T_{u}}\left|L_{u}\right|}$ (14)
Recall $=\frac{\sum_{u \in T_{u}}\left|L_{u} \cap B_{u}\right|}{\sum_{u \in T_{u}}\left|B_{u}\right|}$ (15)
$F_{1}=\frac{2 \times \text { Precision } \times \text { Re call }}{\text { Precision }+\text { Recall }}$ (16)
where, Lu is user u’s recommended commodities obtained by a training dataset; Bu is the commodity set with positive ratings in the test set; Tu is the user dataset in the test set.
The proposed algorithm (TDSRec) is evaluated against SocialMF, TDMF and TDRec. The parameters of each algorithm are listed in Table 1.
Table 1. Parameter settings of each algorithm
|
Algorithm |
Parameter |
|
SocialMF |
$\lambda_{u}=\lambda_{v}=0.001, \lambda_{r}=1$ |
|
TDMF |
$\lambda_{u}=\lambda_{v}=0.001, \lambda_{s}=10$ |
|
TDRec |
$\lambda_{p}=\lambda_{w}=\lambda_{v}=\lambda_{c}=0.001, \lambda=\lambda_{t}=0.5, \beta=0.4,\alpha=0.001$ |
|
TDSRec |
$\lambda_{p}=\lambda_{w}=\lambda_{v}=0.001, \lambda_{1}=\lambda_{2}=0.0001, \beta=0.3,\gamma=0.5, \theta=0.2, \alpha=0.001$ |
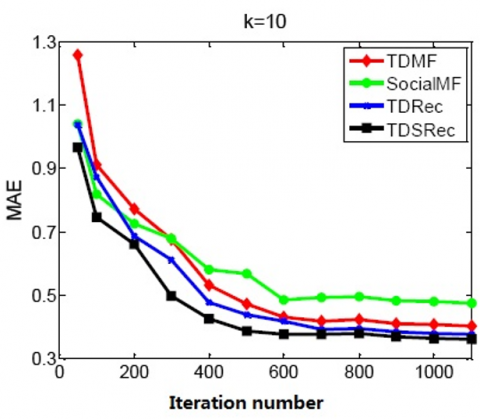
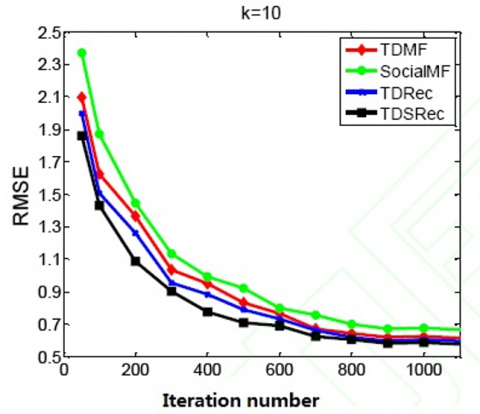
From Figure 4 and Figure 5, it is learned that the MAE and RMSE gradually stabilize with the increase in the number of iterations. The experimental results indicate that the proposed algorithm is superior to the comparison algorithms.
Through the experimental comparison, we analyze the Precision, Recall and F1-Measure of the proposed algorithm and those of the existing algorithms under different number of neighbors N. The results are shown in Figure 6, Figure 7 and Figure 8.
Figure 4. MAE at different iterations on all users
Figure 5. RMSE at different iterations on all users
Figure 6. Precision of different algorithms
Figure 7. Recall of different algorithms
Figure 8. F1-Measure of different algorithms
It is demonstrated in the above figures that, whichever the number of neighbors N, the proposed algorithm always outperforms the other algorithms in terms of the Precision, Recall and F1-Measure.
Despite being a mature and popular method with a good recommendation effect, the collaborative filtering recommendation algorithm has several intrinsic flaws. For example, the traditional algorithm fails to consider the social relationship of users during the similarity computation, which undermines the recommendation accuracy and diversity. Therefore, this paper proposes a novel collaborative filtering recommendation algorithm based on multi-relationship social network. It is proved that the proposed algorithm is applicable to the recommendation of large user-commodity sets, and is an effective way to reduce data sparseness, enhance prediction accuracy, and promote recommendation accuracy.
The work was supported by the Agricultural Internet of Things Engineering and Technology Center of Kaifeng City and the Science and Funding scheme for young backbone teachers of Henan Province (2017GGJS270), and the Key Research Projects Plan for Colleges and Universities of Henan Province (19B520014), and Teaching Reform Research Projects for Higher Education of Henan Province (2014SJGLX439).
[1] Victor, P., Verbiest, N., Cornelis, C., Cock, M.D. (2013). Enhancing the trust-based recommendation process with explicit distrust. ACM Transactions on the Web (TWEB), 7(2): 1-19. https://doi.org/10.1145/2460383.2460385
[2] Kanimozhi, S. (2011). Effective constraint based clustering approach for collaborative filtering recommendation using social network analysis. Bonfring International Journal of Data Mining, 1(Special Issue Inaugural Special Issue): 12-17. https://doi.org/10.9756/BIJDM.I1003
[3] Verbert, K., Manouselis, N., Ochoa, X., Wolpers, M., Drachsler, H., Bosnic, I., Duval, E. (2012). Context-aware recommender systems for learning: A survey and future challenges. IEEE Transactions on Learning Technologies, 5(4): 318-335. https://doi.org/10.1109/TLT.2012.11
[4] Zhang, Y.M., Wang, L., Cao, H.H., Mao, G.J. (2015). Recommendation algorithm based on user-interest-item tripartite graph. Pattern Recogn. Artif. Intell, 28(10): 913-921. https://doi.org/10.16451/j.cnki.issn1003-6059.201510006
[5] Ahmed, A.M., Qiu, T., Xia, F., Jedari, B., Abolfazli, S. (2014). Event-based mobile social networks: Services, technologies, and applications. IEEE Access, 2: 500-513. https://doi.org/10.1109/ACCESS.2014.2319823
[6] Guo, L.J., Liang, J., Zhao, X. (2016). Collaborative filtering recommendation algorithm incorporating social network information. Pattern Recognition and Artificial Intelligence, 29(3): 281-288. https://doi.org/10.16451/j.cnki.issn1003-6059.201603010
[7] Wang, M., Ma, J. (2016). A novel recommendation approach based on users’ weighted trust relations and the rating similarities. Soft Computing, 20(10): 3981-3990. https://doi.org/10.1007/s00500-015-1734-1
[8] Tan, F., Li, L., Zhang, Z., Guo, Y. (2016). A multi-attribute probabilistic matrix factorization model for personalized recommendation. Pattern Analysis and Applications, 19(3): 857-866. https://doi.org/10.1007/s10044-015-0510-2
[9] Park, J., Chun, J., Park, H. (2010). Generalised singular value decomposition-based algorithm for multi-user multiple-input multiple-output linear precoding and antenna selection. IET Communications, 4(16): 1899-1907. https://doi.org/10.1049/iet-com.2009.0623
[10] Wei, C., Khoury, R., Fong, S. (2013). Web 2.0 Recommendation service by multi-collaborative filtering trust network algorithm. Information Systems Frontiers, 15(4): 533-551. https://doi.org/10.1007/s10796-012-9377-6
[11] Chang, W.L., Diaz, A.N., Hung, P.C. (2015). Estimating trust value: A social network perspective. Information Systems Frontiers, 17(6): 1381-1400. https://doi.org/10.1007/s10796-014-9519-0
[12] Massa, P., Bhattacharjee, B. (2004). Using trust in recommender systems: An experimental analysis. In International Conference on Trust Management, pp. 221-235. https://doi.org/10.1007/978-3-540-24747-0_17
[13] Hu, X., Wang, W., Gong, X., Wang, B., Que, X., Xia, H. (2015). Social Recommendation with Biased Regularization. Applied Mathematics & Information Sciences, 9(5): 2637. https://doi.org/10.12785/amis/090548
[14] Tran, T.N.T., Atas, M., Felfernig, A., Stettinger, M. (2018). An overview of recommender systems in the healthy food domain. Journal of Intelligent Information Systems, 50(3): 501-526. https://doi.org/10.1007/s10844-017-0469-0
[15] Koyejo, O., Lee, C., Ghosh, J. (2014). A constrained matrix-variate Gaussian process for transposable data. Machine Learning, 97(1-2): 103-127. https://doi.org/10.1007/s10994-014-5444-1
[16] Willmott, C.J., Matsuura, K. (2005). Advantages of the mean absolute error (MAE) over the root mean square error (RMSE) in assessing average model performance. Climate Research, 30(1): 79-82. https://doi.org/10.3354/cr030079
[17] Chai, T., Draxler, R.R. (2014). Root mean square error (RMSE) or mean absolute error (MAE)?–Arguments against avoiding RMSE in the literature. Geoscientific Model Development, 7(3): 1247-1250. https://doi.org/10.5194/gmd-7-1247-2014
[18] Zollanvari, A., Dougherty, E.R. (2014). Moments and root-mean-square error of the Bayesian MMSE estimator of classification error in the Gaussian model. Pattern Recognition, 47(6): 2178-2192. https://doi.org/10.1016/j.patcog.2013.11.022
[19] Dalton, L.A., Dougherty, E.R. (2010). Bayesian minimum mean-square error estimation for classification error—Part I: Definition and the Bayesian MMSE error estimator for discrete classification. IEEE Transactions on Signal Processing, 59(1): 115-129. https://doi.org/10.1109/TSP.2010.2084572
[20] Cui, L., Sahoo, S.S., Lhatoo, S.D., Garg, G., Rai, P., Bozorgi, A., Zhang, G.Q. (2014). Complex epilepsy phenotype extraction from narrative clinical discharge summaries. Journal of Biomedical Informatics, 51: 272-279. https://doi.org/10.1016/j.jbi.2014.06.006
[21] Shen, D., Pan, R., Sun, J.T., Pan, J.J., Wu, K., Yin, J., Yang, Q. (2006). Query enrichment for web-query classification. ACM Transactions on Information Systems (TOIS), 24(3): 320-352. https://doi.org/10.1145/1165774.1165776