Timothy T. Adeliyi*![]() | Deborah Oluwadele
| Deborah Oluwadele![]() | Oluwasegun J. Aroba
| Oluwasegun J. Aroba![]() | Kevin Igwe
| Kevin Igwe![]()
© 2025 The authors. This article is published by IIETA and is licensed under the CC BY 4.0 license (http://creativecommons.org/licenses/by/4.0/).
OPEN ACCESS
In recent years, several impactful studies have provided stakeholders with actionable insights aimed at reducing accident severity, aligning with Sustainable Development Goals 3 and 11, which target a reduction in global deaths and injuries by 2030. Building upon this foundation, the present study applies the Multiple Correspondence Analysis (MCA) technique to uncover complex and latent relationships among categorical variables influencing road accident severity across Sub-Saharan Africa. The dataset comprises 12,316 accident records spanning 2017 to 2020, with 22 carefully selected categorical variables relevant to driver demographics, environmental conditions, vehicle characteristics, and road infrastructure. Through MCA, the dimensionality of the original 182 dimensions was reduced to 29 dimensions based on eigenvalue retention, with the first two dimensions accounting for 60.2% of the total variance. The resulting MCA biplot reveals distinct quadrant-based groupings of variables. The top-right quadrant demonstrates a strong positive correlation among factors such as younger drivers (aged 18-30), vehicle ownership, type of vehicle, service year, presence of medians or lanes, specific accident-prone areas, and weekdays. This cluster suggests that accident severity is significantly influenced by driver age and vehicle characteristics in particular contexts. This study revealed the interrelationships among key features, offering a data-driven foundation upon which policymakers and transport authorities can design and implement targeted interventions. These may include stricter licensing regulations for younger drivers, the enforcement of improved vehicle safety standards, and strategic infrastructural enhancements in identified high-risk zones. The findings provide a strong foundation for the expansion of sustainable road safety strategies and contribute to the growing discourse on mitigating accident severity in Sub-Saharan Africa.
accident severity, Multiple Correspondence Analysis, road safety strategies, driver demographics, Sub-Saharan Africa, sustainable development goals
Road traffic accidents continue to pose a serious challenge, especially across Sub-Saharan Africa, which, quite disturbingly, recorded the highest mortality rate globally in 2021, with 19 deaths per 100,000 people [1]. While numerous efforts have been made to identify contributing factors and curb the trend, the statistics remain sobering: road accidents still top the list as the leading cause of death among children and young people aged 5 to 29, and sit as the 12th leading cause of death across all age groups. Beyond the tragic loss of lives and the burden of long-term injuries, the economic impact is also significant, with some countries losing up to 6% of their GDP to costs associated with road crashes [2]. Road traffic accidents, therefore, not only constitute a major health challenge but also a development challenge, requiring equal or more attention to those given to other sustainable development objectives, such as poverty reduction [3, 4].
Much research has investigated factors affecting road accident severity, especially in developing African countries. These include human factors, such as driver inattention, speeding, alcohol consumption, young inexperienced drivers, and the failure to maintain vehicles [5]. Both studies [6, 7] identified speeding as a significant predictor of accident severity, while alcohol consumption increases crash likelihood. Also, behaviors such as dangerous overtaking pedestrian actions, like jaywalking, can have a pronounced impact on accident severity [8]. Another notable factor is vehicle conditions, including vehicle type, age, and maintenance levels. Ouni and Chaibi in reference [8] suggest maintenance conditions as a key contributor to accident outcomes. Environmental factors such as roadway geometry, lighting conditions, and weather were not exempted. For example, poor road infrastructure, such as poor lighting and road designs, contributes to severe accidents [5, 9].
Most of the research has focused on the use of machine learning models, such as decision trees and support vector machines, to identify how these factors affect road accident severity. For instance, the J48 pruned tree model has been shown to outperform other models presented in reference [6]. Recent reviews [10, 11] of several statistical methods applied in road accident analysis show that tangible milestones have been achieved in identifying the factors influencing road traffic accidents and their severity. For example, logistic regression was used to identify risk factors in single-vehicle traffic accidents and to investigate how various factors, like road environmental conditions, affect accident severity [12, 13]. Ordered probit models were used to determine the ordered severity levels of injuries in accidents occurring in a specific area or during a defined period, such as cold and snowy [14]. Among others, a Bayesian Hierarchical Model, an advanced statistical technique, has been applied to assess the role of multi-level data hierarchies in road safety, such as the influence of individual, road, and environmental factors on motorcycle crashes at intersections [15].
While it is widely acknowledged that identifying the specific factors influencing traffic accident severity is important, far less attention has been given to exploring the deeper, often hidden relationships between these variables. These often-overlooked connections, frequently buried beneath layers of categorical complexity, remain underexplored, not least because of the methodological hurdles involved. Yet, understanding these relationships is vital if we are to set meaningful priorities and craft policies that go beyond surface-level fixes. To probe how various factors interplay in shaping accident severity, this study employs Multiple Correspondence Analysis (MCA), a method well-suited to unpacking nuanced patterns that might otherwise go unnoticed. While MCA isn’t a silver bullet, its strength lies in its ability to distill multi-dimensional data into digestible trends, offering a clearer picture of how seemingly disparate variables coalesce. In the context of global road safety goals and the push toward sustainable development, these insights serve a practical purpose: guiding more targeted interventions that can reduce not just the economic toll but also the deeper, often hidden social costs of traffic accidents.
In Sub-Saharan Africa (SSA), traffic accidents remain a deeply troubling public health and socioeconomic issue, one that touches the lives of individuals, disrupts communities, and hampers national development efforts. These accidents continue to place an avoidable burden on low- and middle-income countries (LMICs), both economically and developmentally, and are among the leading causes of death and serious injury across the globe [16]. To better understand the factors behind various crash outcomes, researchers often conduct injury severity analyses using crash data. Human-related factors such as speeding, fatigue, intoxicated driving, drug use, distractions, and wrong-way driving are repeatedly identified as key contributors, particularly in head-on collisions. Supporting this, a recent study [17] found that speeding alone accounts for nearly 54% of global road fatalities, with an alarming 95% of these deaths occurring on roads in LMICs. Other factors, such as hazardous roadway conditions and improper passing, have also been identified as contributing to head-on crashes [18].
On the other hand, understanding the determinants of accident severity is crucial for effective intervention strategies aimed at reducing fatalities and injuries on SSA roads. According to the study [19], road traffic crashes were common among younger age and males’ gender. Other factors identified included poor road network, unplanned stoppage by police, unlawful vehicular parking, increased urbanization, and slippery floors. Using MCA as a statistical technique for analyzing complex datasets with interrelated categorical variables, the Highway Safety Manual (HSM) of the American Association of State Highway and Transportation Officials (AASHTO) categorizes road crash risk factors into three main groups: human, vehicle, and road environmental factors [20]. These factors contribute to road traffic crashes (RTCs) at rates of 93%, 34%, and 13%, respectively the study [21]. According to the study [22], life losses from road traffic accidents in the African region are 40% greater than in all other countries, with LMICs generally being about 50% greater than the world average. Through the multi-dimensional mapping of these linkages, MCA enables researchers to identify patterns and associations that might not be readily evident using more conventional methodologies.
World Health Organization [23] affirms that African countries have the highest regional rates of road traffic deaths, estimated at 26.6 deaths per 100,000 population, with Pedestrians and cyclists, known as vulnerable road users, representing 26% of all deaths due to road traffic crashes (RTCs). In the Nigerian context, for instance, incidences of RTCs were highest across peak commuting hours (07:00-12:59 and 13:00-18:59), rainy season, and harmattan (foggy) months, and in densely populated local government areas (LGAs) in Lagos state. Five urban LGAs accounted for over half of RTCs distributions: Eti-Osa (14.7%), Ikeja (14.4%), Kosofe (9.9%), Ikorodu (9.7%), and Alimosho (6.6%) [24]. Safety-conscious Road design, construction, and maintenance are vital in ensuring safe roads and reducing death and serious injury from traffic crashes [25]. MCA is a powerful statistical technique that can facilitate the identification of high-risk groups and locations within SSA, guiding targeted interventions and resource allocation. Using MCA, the cause and severity of accidents analysis is developed based on traffic accident data to explore the relationship among factors such as people, vehicles, roads, environment, and their combination [26].
Recent studies have yielded significant insights into the factors determining the severity of road accidents in Sub-Saharan Africa [27-30]. These insights have highlighted important causes, methodologies, and conclusions that might guide future investigations and policy initiatives. Driver actions continuously show that the severity of traffic accidents is significantly influenced by the actions of drivers. Gudugbe et al. [31] found that among minibus cab drivers in Addis Ababa, Ethiopia, critical factors included driver weariness, over-speeding, and poor vehicle maintenance. Environmental factors, poor road conditions, and inadequate vehicle maintenance were also identified as major factors contributing to road traffic accidents. However, the study [30] highlighted that in the North Gondar Zone of Ethiopia, poor road conditions and a deficiency of traffic signs play significant roles in road traffic accidents. Similarly, the public’s understanding of traffic laws and their enforcement is a crucial problem. Konlan and Hayford [19] indicated that a significant factor in the high incidence of motorcycle-related accidents in Africa is the lack of public knowledge and the ineffective implementation of traffic laws. One of the persistent barriers to improving road safety is the weak enforcement of traffic laws, where existing regulations, even when well-intended, are often applied inconsistently or overlooked entirely. This regulatory laxity undermines broader safety efforts.
Beyond enforcement, several studies have highlighted the role of sociodemographic factors in traffic incidents. For example, younger and less experienced drivers remain disproportionately involved in road crashes [32], which suggests a need for more tailored, perhaps even proactive, interventions aimed at this group. Accidents also appear to concentrate in densely populated urban settings and during peak traffic hours. Data from Lagos State, Nigeria, illustrates this vividly: local government areas with both high population density and heavy congestion tend to record the highest crash rates [24]. These patterns emerging from the literature make a compelling case for multi-layered interventions ranging from infrastructural upgrades and sustained public awareness campaigns to, quite crucially, a more disciplined approach to law enforcement. As the study [31] rightly observes, without these deliberate efforts, the goal of significantly lowering traffic-related fatalities may remain aspirational.
Multiple Correspondence Analysis (MCA), an evolution of Correspondence Analysis (CA), was designed to work specifically with categorical data [33]. At its core, MCA seeks to reveal and map out the hidden relationships within datasets composed of multiple categorical variables. Rather than merely providing tabular summaries, it brings these associations to life through intuitive visualizations, making it easier to spot underlying patterns that might otherwise go unnoticed [34]. In this study, MCA is employed not just for its technical suitability, but also for its ability to expose the geometric configurations of factors influencing road traffic accident severity, something conventional summaries often fail to capture. The process unfolds in three essential stages: preparing the dataset, applying appropriate coding, and performing the analysis.
3.1 Data preparation
The dataset underpinning this study was sourced from manually documented road traffic accident reports spanning 2017 to 2020, yielding a total of 12,316 entries across 32 initially derived features [35]. Since MCA is best suited to categorical data, the dataset comprises a deliberate mix of nominal and ordinal variables. During the pre-processing phase, entries with missing or incomplete information were filtered out, resulting in a more analytically viable subset of 6,422 valid records. To maintain analytical clarity and reduce noise, 22 features out of the original 32 were retained based on their relevance to accident causality. These selected variables, as detailed in Table 1 alongside their category distributions, capture dimensions frequently associated with road traffic outcomes. It should be acknowledged, however, that the dataset is constrained to a specific time frame (2017-2020). While this window provides a solid snapshot of recurring patterns and risk factors, it may not fully reflect the influence of more recent shifts in driving behaviour, safety regulations, or emerging vehicular technologies elements that could reshape the current risk landscape in ways this dataset cannot fully anticipate.
Table 1. Description of road traffic accident features
|
Features |
Number of Categories Per Feature |
Definitions |
|
Day of week |
7 |
The day of the week on which the road traffic accident occurred |
|
Age band of driver |
5 |
The age range of the driver involved in the accident |
|
Sex of driver |
3 |
The gender of the driver involved in the accident |
|
Educational level |
7 |
The highest level of education attained by the drive |
|
Vehicle driver relation |
4 |
The relationship between the driver and the vehicle |
|
Driving experience |
7 |
The number of years the driver has been driving |
|
Type of vehicle |
18 |
The type of vehicle involved in the accident |
|
Owner of the vehicle |
4 |
The owner of the vehicle involved in the accident |
|
Service year of the vehicle |
6 |
The age of the vehicle in years, indicating how long it has been in service |
|
Area accident occurred |
12 |
The type of area where the accident occurred |
|
Lanes or Medians |
7 |
The presence and type of lanes or medians on the road where the accident occurred |
|
Road alignment |
9 |
The alignment of the road at the accident site |
|
Types of Junctions |
8 |
The type of junction where the accident occurred |
|
Road surface type |
5 |
The type of surface of the road where the accident occurred |
|
Road surface conditions |
4 |
The condition of the road surface at the time of the accident
|
|
Light conditions |
4 |
The lighting conditions at the time of the accident |
|
Weather conditions |
9 |
The weather conditions at the time of the accident |
|
Type of collision |
10 |
The nature of the collision, |
|
Number of vehicles involved |
6 |
The number of vehicles involved in the accident |
|
Number of casualties |
8 |
The total number of casualties (injured or deceased) resulting from the accident |
|
Vehicle movement |
13 |
The movement of the vehicle at the time of the accident |
|
Accident severity |
3 |
The severity of the accident |
3.2 Data codification
The MCA categorical data was coded using 6422 records after data pre-processing. The MCA analysis considered features, categories per feature, and frequency of each category. The first 22 features presented in Table 2 are numbered from 1 to 22, coded F1 to F22. Each category within these 22 features is assigned a code ranging from 1 to 159, coded F23-F181. The frequency of each category is classified into four groups, coded 1 to 4, representing very small, small, large, and very large frequencies, respectively coded F182 to F185. The sample size ranges are as follows: 1 to 1600 (very small), 1601 to 3200 (small), 3201 to 4800 (large), and 4801 to 6400 (very large). Table 2 presents the coding for the severity of road accident factors.
Table 2. Severity of road accident factors
|
Label |
Factor |
Label |
Factor |
|
F1 |
Day of Week |
F2 |
Age Band of Driver |
|
F3 |
Sex of Driver |
F4 |
Educational Level |
|
F5 |
Vehicle Driver Relation |
F6 |
Driving Experience |
|
F7 |
Type of Vehicle |
F8 |
Owner Of the Vehicle |
|
F9 |
Service Year of The Vehicle |
F10 |
Area Accident Occurred |
|
F11 |
Lanes or Medians |
F12 |
Road Alignment |
|
F13 |
Types of Junctions |
F14 |
Road Surface Type |
|
F15 |
Road Surface Conditions |
F16 |
Light Conditions |
|
F17 |
Weather Conditions |
F18 |
Type Of Collision |
|
F19 |
Number of Vehicles Involved |
F20 |
Number Of Casualties |
|
F21 |
Vehicle Movement |
F22 |
Accident Severity |
|
F23 |
Monday |
F24 |
Tuesday |
|
F25 |
Wednesday |
F26 |
Thursday |
|
F27 |
Friday |
F28 |
Saturday |
|
F29 |
Sunday |
F30 |
Under 18 |
|
F31 |
18-30 |
F32 |
31-50 |
|
F33 |
Over 51 |
F34 |
Unknown |
|
F35 |
Male |
F36 |
Female |
|
F37 |
Unknown |
F38 |
Illiterate |
|
F39 |
Writing & Reading |
F40 |
Elementary School |
|
F41 |
Junior High School |
F42 |
High School |
|
F43 |
Above High School |
F44 |
Unknown |
|
F45 |
Employee |
F46 |
Owner |
|
F47 |
Unknown |
F48 |
Other |
|
F49 |
No Licence |
F50 |
Below 1yr |
|
F51 |
1 2yr |
F52 |
2 5yr |
|
F53 |
5 10yr |
F54 |
Above 10yr |
|
F55 |
Unknown |
F56 |
Automobile |
|
F57 |
Bajaj |
F58 |
Long Lorry |
|
F59 |
Lorry (11 400) |
F60 |
Lorry (41 1000) |
|
F61 |
Pick Up to 10Q |
F62 |
Public (> 45 Seats) |
|
F63 |
Public (12 Seats) |
F64 |
Public (13 45 Seats) |
|
F65 |
Ridden Horse |
F66 |
Special Vehicle |
|
F67 |
Station Wagon |
F68 |
Taxi |
|
F69 |
Turbo |
F70 |
Motorcycle |
|
F71 |
Other |
F72 |
Unknown |
|
F73 |
Bicycle |
F74 |
Owner |
|
F75 |
Governmental |
F76 |
Organization |
|
F77 |
Other |
F78 |
Below 1yr |
|
F79 |
1 2yr |
F80 |
2 5yr |
|
F81 |
5 10yr |
F82 |
Above 10yr |
|
F83 |
Unknown |
F84 |
Residential Areas |
|
F85 |
Office Areas |
F86 |
Market Areas |
|
F87 |
Church Areas |
F88 |
Other |
|
F89 |
Outside Rural Areas |
F90 |
Industrial Areas |
|
F91 |
School Areas |
F92 |
Rural Village Areas |
|
F93 |
Hospital Areas |
F94 |
Recreational Areas |
|
F95 |
Rural Village Areas Office Areas |
F96 |
Other |
|
F97 |
Two-Way (Divided with Broken Lines Road Marking) |
F98 |
Undivided Two Way |
|
F99 |
Double Carriageway (Median) |
F100 |
Two-Way (Divided with Solid Lines Road Marking) |
|
F101 |
One Way |
F102 |
Unknown |
|
F103 |
Escarpments |
F104 |
Tangent Road with Flat Terrain |
|
F105 |
Steep Grade Downward with Mountainous Terrain |
F106 |
Tangent Road with Mild Grade and Flat Terrain |
|
F107 |
Tangent Road with Mountainous Terrain |
F108 |
Sharp Reverse Curve |
|
F109 |
Steep Grade Upward with Mountainous Terrain |
F110 |
Gentle Horizontal Curve |
|
F111 |
Tangent Road with Rolling Terrain |
F112 |
Crossing |
|
F113 |
Y Shape |
F114 |
No Junction |
|
F115 |
O Shape |
F116 |
T Shape |
|
F117 |
X Shape |
F118 |
Other |
|
F119 |
Unknown |
F120 |
Asphalt Roads |
|
F121 |
Earth Roads |
F122 |
Gravel Roads |
|
F123 |
Other |
F124 |
Asphalt Roads with Some Distress |
|
F125 |
Dry |
F126 |
Wet Or Damp |
|
F127 |
Snow |
F128 |
Flood Over 3cm Deep |
|
F129 |
Daylight |
F130 |
Darkness Lights Lit |
|
F131 |
Darkness No Lighting |
F132 |
Darkness Lights Unlit |
|
F133 |
Normal |
F134 |
Cloudy |
|
F135 |
Raining |
F136 |
Windy |
|
F137 |
Other |
F138 |
Snow |
|
F139 |
Raining and Windy |
F140 |
Fog Or Mist |
|
F141 |
Unknown |
F142 |
Collision With Animals |
|
F143 |
Collision With Roadside Parked Vehicles |
F144 |
Collision With Roadside Objects |
|
F145 |
Collision With Pedestrians |
F146 |
A Vehicle with A Vehicle Collision |
|
F147 |
Fall From Vehicles |
F148 |
Rollover |
|
F149 |
Other |
F150 |
Unknown |
|
F151 |
With Train |
F166 |
Turnover |
|
F167 |
Going Straight |
F168 |
Moving Backward |
|
F169 |
Reversing |
F170 |
Waiting To Go |
|
F171 |
Getting Off |
F172 |
Other |
|
F173 |
U Turn |
F174 |
Stopping |
|
F175 |
Entering A Junction |
F176 |
Overtaking |
|
F177 |
Unknown |
F178 |
Parked |
|
F179 |
Slight Injury |
F180 |
Serious Injury |
|
F181 |
Fatal Injury |
F182 |
Very Small |
|
F183 |
Small |
F184 |
Large |
|
F185 |
Very Large |
3.3 Data analysis
Correspondence Analysis extends the application of CA to more than two categorical variables, generalizing Principal Component Analysis (PCA) for categorical data and revealing patterns in complex datasets [36]. The subset of the dataset focusing on influencing factors and sources of heterogeneity was analyzed using MCA to uncover hidden associations.
MCA presents a methodologically and strategically appropriate choice as the primary analytical technique for this study. This is largely due to the categorical nature of the variables typically encountered in accident severity datasets, such as vehicle type, road condition, time of day, weather, type of collision, and severity level (e.g., fatal, serious, or minor). Unlike traditional statistical techniques that are more suited to numerical or normally distributed data, MCA is specifically designed to accommodate multiple categorical variables simultaneously. This makes it particularly effective in uncovering meaningful patterns and relationships within complex, categorical datasets.
MCA, a type of Correspondence Analysis, can be performed on either an indicator matrix or a Burt matrix, with both matrices being central to the analysis. However, the standard approach to MCA is fundamentally based on the indicator matrix [37]. This matrix presents each observation as a disjunctive map of variables; essentially, each column corresponds to a specific category within a categorical variable [33]. Each observation is assigned a binary indicator: a 1 if it belongs to a specific category and 0 otherwise. To explore this categorical structure, we employed Multiple Correspondence Analysis (MCA) via the MultipleCar toolbox [34], which uses weighted least squares estimation balancing precision with a reasonable degree of robustness in how parameters are derived.
At the heart of this approach lies the disjunctive (indicator) matrix, which reformulates categorical responses into a format amenable to multivariate analysis. While this transformation appears mechanical, it plays a critical role in clarifying hidden associations among variables and lends itself well to visual interpretation, without sacrificing computational simplicity. In practice, the indicator matrix offers more than just structural clarity. It’s relatively easy to construct, keeps the underlying data intact, and brings to light nuances at the individual level. Its flexibility in handling incomplete records is a quiet advantage, especially when working with large, imperfect datasets, something most real-world studies inevitably contend with.
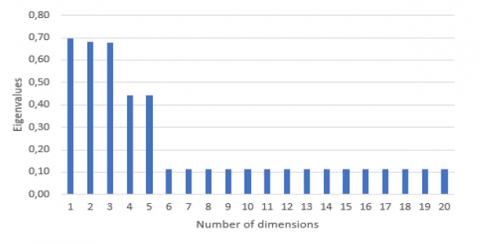
The total variance percentage for each dimension is represented by the inertia (eigenvalue). A higher inertia indicates a larger portion of the total variance among the variables on that dimension. The MCA analyzed 3 variables with a total of 185 categories, resulting in an overall solution of 182 dimensions. The first five dimensions exhibit a higher percentage of variance compared to the others, as illustrated in Figure 1. Given the low data variability, dimension reduction was performed in this study. Figure 1 displays the scree plot, plotting eigenvalues against the number of principal dimensions. Based on the scree test, the “elbow” of the plot, where the eigenvalues begin to level off, occurs at dimension 5 in this case. This indicates that the significant number of dimensions to retain is 5, as identified to the left of the elbow, further confirming visually that these dimensions should be used for the subsequent MCA analysis.
Before applying dimensionality reduction, the dataset originally consisted of 182 dimensions, collectively explaining 100% of the cumulative variance, with a total eigenvalue of 6.913. However, as part of the refinement process, Table 3 illustrates that dimension reduction reduced the dataset to 29 dimensions, while still preserving 100% of the cumulative variance, albeit with a lower total eigenvalue of 2.414. Despite retaining all 29 dimensions post-reduction, a more granular analysis revealed that only 5 dimensions were ultimately selected for further analysis. This decision was based on the eigenvalue scree plot, where a noticeable levelling off occurred at dimension 5, indicating that additional dimensions contributed marginal variance beyond this point. Consequently, these 5 dimensions were deemed most significant for representing the dataset effectively while minimizing complexity.
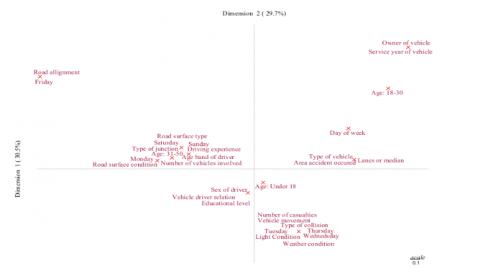
MCA provides insights into a dataset through information visualization, serving as a valuable tool for visualizing relationships between variable categories. Typically, the first and second dimensions are plotted to examine these relationships. In the resulting biplot shown in Figure 2, categories farther from the origin are more discriminating, while those closer to the origin are less distinct.
Figure 2 presents the Multiple Correspondence Analysis (MCA) biplot, which visually illustrates the relationships among categorical variables influencing accident severity, forming a combination cloud. Dimension 1 accounts for 30.5% of the total variance in the data, capturing factors related to road conditions, driver behaviour, and vehicle attributes. Dimension 2 explains 29.7% of the variance, focusing on variables such as vehicle ownership, service years, and demographic characteristics of drivers. Together, these two dimensions explain 60.2% of the variability in the dataset.
If two variables point in the same direction, they are positively correlated and exhibit a strong association. When variables form a 90-degree angle, no correlation exists between them. Conversely, variables pointing in opposite directions indicate a negative correlation. In the context of the MCA biplot, negative correlations are particularly significant for factors in the top-left, bottom-left, and bottom-right quadrants, as they highlight contrasting influences on accident severity, such as driver demographics, environmental conditions, and situational elements. Positive correlations in the top-right quadrant emphasize a cluster of factors such as vehicle ownership, type, and younger driver involvement that work together to shape accident trends, revealing opportunities for targeted interventions.
Figure 1. Scree plot of eigenvalues vs 20 dimensions
Table 3. The Eigenvalue for 29 dimensions (Dim)
|
Dim |
Eigenvalue |
Percentage Inertia |
Cumulative Percentage |
|
1 |
0.7358 |
30.5 |
30.5 |
|
2 |
0.7166 |
29.7 |
60.2 |
|
3 |
0.1187 |
4.9 |
65.1 |
|
4 |
0.1111 |
4.6 |
69.7 |
|
5 |
0.1111 |
4.6 |
74.3 |
|
6 |
0.1111 |
4.6 |
78.9 |
|
7 |
0.1111 |
4.6 |
83.5 |
|
8 |
0.1111 |
4.6 |
88.1 |
|
9 |
0.1111 |
4.6 |
92.7 |
|
10 |
0.0878 |
3.6 |
96.3 |
|
11 |
0.0430 |
1.8 |
98.1 |
|
12 |
0.0427 |
1.8 |
99.9 |
|
13 |
0.0032 |
0.1 |
100.0 |
|
14 |
0.0000 |
0.0 |
100.0 |
|
15 |
0.0000 |
0.0 |
100.0 |
|
16 |
0.0000 |
0.0 |
100.0 |
|
17 |
0.0000 |
0.0 |
100.0 |
|
18 |
0.0000 |
0.0 |
100.0 |
|
19 |
0.0000 |
0.0 |
100.0 |
|
20 |
0.0000 |
0.0 |
100.0 |
|
21 |
0.0000 |
0.0 |
100.0 |
|
22 |
0.0000 |
0.0 |
100.0 |
|
23 |
0.0000 |
0.0 |
100.0 |
|
24 |
0.0000 |
0.0 |
100.0 |
|
25 |
0.0000 |
0.0 |
100.0 |
|
26 |
0.0000 |
0.0 |
100.0 |
|
27 |
0.0000 |
0.0 |
100.0 |
|
28 |
0.0000 |
0.0 |
100.0 |
|
29 |
0.0000 |
0.0 |
100.0 |
Figure 2. MCA Biplot of the first and second dimensions
Figure 2 shows how different factors are connected in road accidents. It helps us understand which things commonly occur together when accidents happen. For example, it shows that younger drivers (ages 18-30) are more likely to be involved in accidents with newer or personally owned vehicles, usually during the weekdays, and on roads with specific features like medians or lanes. In contrast, more severe accidents often happen during bad weather, at night, or when visibility is poor, especially involving teen drivers (under 18). It also shows that road conditions, weekend days, and older drivers (31-50) are linked to different types of accident patterns. Meanwhile, factors like gender, education, and whether the driver owns the car also play a role, but are less connected to other factors. Overall, the chart makes it easier to see patterns in road accidents and can help improve road safety by focusing on who is most at risk and under what conditions.
The top-right quadrant presents variables which include owner of vehicle, service year of vehicle, age: 18-30, type of vehicle, lanes or median, area accident occurred, and day of the week. These factors suggest that accidents involving younger drivers (18-30) are closely associated with vehicle ownership and type of vehicle. Such incidents often occur in specific areas or lanes, with weekdays playing a role in influencing severity. The bottom-right quadrant presents key variables, including weather condition, light condition, type of collision, vehicle movement, number of casualties, age: under 18, and specific days like Tuesday, Thursday, and Wednesday. These factors relate to environmental and situational aspects of accidents, such as poor weather, low visibility, and vehicle movement, which significantly contribute to accident severity. Younger drivers under 18 are also linked to severe accidents under these conditions.
Furthermore, the bottom-left quadrant has variables such as sex of driver, vehicle-driver relation, and educational level. These factors indicate that driver demographics (gender, relationship to the vehicle, and education) influence accident severity but are less interconnected with other variable clusters. While the top-left quadrant variables include road alignment, Friday, road surface type, road surface condition, type of junction, driving experience, age band of driver (31-50), number of vehicles involved, as well as days like Saturday, Sunday, and Monday. These factors suggest that road alignment and specific days, such as Friday, may independently affect accident trends. Additionally, factors such as road surface conditions, junction types, driving experience, and the age group (31-50) form a moderately related cluster. This grouping represents routine contributors to accidents, especially during weekends and early weekdays.
Identifying the relationship between factors that impact accident severity helps make sense of complex datasets to transform raw data into meaningful, actionable insights. Leveraging MCA, the results provide connections among variables and reveal unexpected patterns that might otherwise go unnoticed. The biplot highlights distinct clusters of variables influencing accident severity. While some factors are interconnected, others show more independent influences, providing a comprehensive understanding of the interplay between demographics, environmental conditions, vehicle characteristics, and temporal patterns. With the top-right quadrant showing positive correlations, the results highlight factors such as vehicle ownership, vehicle type, younger driver demographics (18-30), specific lanes or medians, area of occurrence, and weekdays and implies that a cluster of factors such as vehicle ownership, type, and younger driver involvement work together to shape accident severity, revealing opportunities for targeted interventions. The key findings from this study provide valuable insights that can guide stakeholders in identifying critical areas of focus. By aligning their strategies with the study’s findings, stakeholders are better positioned to make thoughtful decisions, focus on what truly matters, and apply solutions where they’ll have the most impact. The points below outline key areas that deserve attention to ensure efforts are effective and outcomes are genuinely meaningful:
Road accidents remain a critical public health issue in Sub-Saharan Africa, ranking as the leading cause of death among children and young people aged 5 to 29 and the 12th leading cause of mortality across all age groups. Despite numerous interventions, the burden of road traffic incidents persists. Existing studies have identified several contributing factors, including driver inattention, excessive speed, alcohol consumption, inexperienced and young drivers, poor vehicle maintenance, and hazardous overtaking behaviours. However, limited attention has been given to exploring the interrelationships among these variables to generate deeper, actionable insights.
This study applied Multiple Correspondence Analysis (MCA) to a curated dataset comprising 12,316 road accident records from 2017 to 2020, focusing on 22 categorical features most relevant to accident severity. The findings revealed strong associations among factors such as drivers aged 18-30, vehicle ownership, vehicle type, road features (medians or lanes), weekdays, and specific high-risk areas. These insights underscore the complex interplay between driver demographics, vehicle characteristics, and spatial-temporal patterns of road use in influencing accident outcomes.
The analysis informs a number of targeted interventions, including the enforcement of stricter licensing protocols for younger drivers, improvements in vehicle safety regulations, and strategic upgrades to infrastructure in high-risk areas. This study thus presents a data-driven framework for the development of sustainable, context-specific road safety strategies in Sub-Saharan Africa. Moreover, the results create a foundation for further investigation. Future studies can extend this research by exploring variable relationships across different geographic regions, conducting comparative analyses, or applying state-of-the-art predictive techniques. Data scientists are also encouraged to refine data integrity by detecting anomalies and inconsistencies in accident records, thereby enhancing dataset reliability.
Lastly, the study recommends longitudinal research to assess the stability of these findings over time and across countries. Such efforts will contribute meaningfully to the achievement of Sustainable Development Goals 3 and 11, particularly Target 3.6, reducing global deaths and injuries from road traffic accidents, and Target 11.2, ensuring safe, affordable, accessible, and sustainable transport systems for all.
[1] World Health Organization. (2023). Pedestrian safety: A road safety manual for decision-makers and practitioners. World Health Organization. https://www.who.int/publications/i/item/978924007249.
[2] World Health Organization. (2023). Global status report on road safety. https://www.who.int/teams/social-determinants-of-health/safety-and-mobility/global-status-report-on-road-safety-2023.
[3] Aworinde, H.O., Adeniyi, A.E., Adebayo, S., Adeniji, F., Aroba, O.J. (2024). Development of a prioritized traffic light control system for emergency vehicles. IAES International Journal of Artificial Intelligence, 13(4): 4019-4028. https://doi.org/10.11591/ijai.v13.i4.pp4019-4028
[4] Aroba, O.J., Mabuza, P., Mabaso, A., Sibisi, P. (2023). Adoption of smart traffic system to reduce traffic congestion in a smart city. In International Conference on Digital Technologies and Applications. Cham: Springer Nature Switzerland, pp. 822-832. https://doi.org/10.1007/978-3-031-29857-8_82
[5] Oguntoyinbo, O., China, S., Obiri, J. (2024). Human factors contributing to accidents and disasters in road transport of petroleum products in Kenya. African Journal of Empirical Research, 5: 184-194.
[6] Adeliyi, T., Oluwadele, D., Igwe, K., Aroba, O.J. (2023). Analysis of road traffic accidents severity using a pruned tree-based model. International Journal of Transport Development and Integration, 7(2): 131-138. https://DOI.org/10.18280/ijtdi.070208
[7] Chibaro, M., Munuhwa, S., Mupfiga, C., Farai, F.C. (2024). Human factors and road traffic safety: An inquiry into the causes of upsurge in road traffic accidents in harare metropolitan province, Zimbabwe. Asian Journal of Management, Entrepreneurship and Social Science, 4(03): 92-18. https://doi.org/10.63922/ajmesc.v4i03.779
[8] Ouni, F., Chaibi, M. (2024). Factors impacting traffic crash severity of vulnerable and non-vulnerable road users in Tunisia. In 2024 IEEE 15th International Colloquium on Logistics and Supply Chain Management (LOGISTIQUA), Sousse, Tunisia, pp. 1-9. https://doi.org/10.1109/LOGISTIQUA61063.2024.10571437
[9] Mphekgwana, P.M. (2022). Influence of environmental factors on injury severity using ordered Logit regression model in limpopo province, South Africa. Journal of Environmental and Public Health, 2022(1): 5040435. https://doi.org/10.1155/2022/5040435
[10] Ferreira-Vanegas, C.M., Vélez, J.I., García-Llinás, G.A. (2022). Analytical methods and determinants of frequency and severity of road accidents: A 20‐Year systematic literature review. Journal of Advanced Transportation, 2022(1): 7239464. https://doi.org/10.1155/2022/7239464
[11] Hossain, S., Maggi, E., Vezzulli, A. (2024). Factors influencing the road accidents in low and middle-income countries: A systematic literature review. International Journal of Injury Control and Safety Promotion, 31(2): 294-322. https://doi.org/10.1080/17457300.2024.2319618
[12] Alrumaidhi, M., Rakha, H.A. (2022). Factors affecting crash severity among elderly drivers: A multilevel ordinal logistic regression approach. Sustainability, 14(18): 11543. https://doi.org/10.3390/su141811543
[13] Sari, N., Malkhamah, S., Suparma, L.B. (2024). Prediction model of factors causing traffic accidents on rural arterial roads: A binary logistic regression approach. Journal of Infrastructure, Policy and Development, 8(6): 6692.https://doi.org/10.24294/jipd.v8i6.6692
[14] Hyodo, S., Hasegawa, K. (2021). Factors affecting analysis of the severity of accidents in cold and snowy areas using the ordered probit model. Asian Transport Studies, 7: 100035. https://doi.org/10.1016/j.eastsj.2021.100035
[15] Rezapour, M., Wulff, S.S., Ksaibati, K. (2020). Bayesian hierarchical modelling of traffic barrier crash severity. International Journal of Injury Control and Safety Promotion, 28(1): 94-102. https://doi.org/10.1080/17457300.2020.1849312
[16] Fumagalli, E., Bose, D., Marquez, P., Rocco, L., Mirelman, A., Suhrcke, M., Irvin, A. (2017). The high toll of traffic injuries: Unacceptable and preventable.
[17] Fondzenyuy, S.K., Turner, B.M., Burlacu, A.F., Jurewicz, C. (2024). The contribution of excessive or inappropriate speeds to road traffic crashes and fatalities: A review of literature. Transportation Engineering, 17: 100259. https://doi.org/10.1016/j.treng.2024.100259
[18] Adanu, E.K., Agyemang, W., Lidbe, A., Adarkwa, O., Jones, S. (2023). An in-depth analysis of head-on crash severity and fatalities in Ghana. Heliyon, 9(8). https://doi.org/10.1016/j.heliyon.2023.e18937
[19] Konlan, K.D., Hayford, L. (2022). Factors associated with motorcycle-related road traffic crashes in Africa, a scoping review from 2016 to 2022. BMC Public Health, 22(1): 649. https://doi.org/10.1186/s12889-022-13075-2
[20] Jalayer, M., Pour-Rouholamin, M., Zhou, H. (2018). Wrong-way driving crashes: A multiple correspondence approach to identify contributing factors. Traffic Injury Prevention, 19(1): 35-41. https://doi.org/10.1080/15389588.2017.1347260
[21] Asefa, F., Assefa, D., Tesfaye, G. (2014). Magnitude of, trends in, and associated factors of road traffic collision in central Ethiopia. BMC Public Health, 14: 1-11. https://doi.org/10.1186/1471-2458-14-1072
[22] Alganesh, T.G., Yetnayet, B.T., Delia, G.R., Fekadu, B.A., Tesfa, K.D., Taye, T.E. (2022). Assessment of risk factors of food safety in local butter marketing in Kersa, Mana and Welmera districts of Oromia, Ethiopia. African Journal of Food, Agriculture, Nutrition and Development, 22(9): 21528-21547. http://dx.doi.org/https://doi.org/10.18697/ajfand.114.20475
[23] World Health Organization (2016). Global status report on road safety. https://www.afro.who.int/sites/default/files/2017-06/Road_Safety_AFRO_for_web_0.pdf, accessed on Mar. 3, 2025.
[24] Odusola, A.O., Jeong, D., Malolan, C., Kim, D., Venkatraman, C., Kola-Korolo, O., Idris, O., Olaomi, O.O., Nwariaku, F.E. (2023). Spatial and temporal analysis of road traffic crashes and ambulance responses in Lagos state. Nigeria. BMC Public Health, 23(1): 2273. https://doi.org/10.1186/s12889-023-16996-8
[25] Angelo, A.A., Sasai, K., Kaito, K. (2023). Safety integrated network level pavement maintenance decision support framework as a practical solution in developing countries: The case of Addis Ababa, Ethiopia. Sustainability, 15(11): 8884. https://doi.org/10.3390/su15118884
[26] Wang, Y., Xu, J., Liu, X., Zheng, Z., Zhang, H., Wang, C. (2022). Analysis on risk characteristics of traffic accidents in small-spacing expressway interchange. International Journal of Environmental Research and Public Health, 19(16): 9938. https://doi.org/10.3390/ijerph19169938
[27] Akinyemi, Y.C. (2022). Spatiotemporal pattern of road traffic fatalities in Africa: The effect of economic development. South African Geographical Journal, 104(4): 484-513.
[28] Weldeslassie, F.M., Tarekegn, T.K., Gaim, T.K., Mesfin, S.S., Ketsela, B.K., Dagnachew, S.E., Balcha, A.G., Yassin, M.A., Weldeslassie, F.M. (2022). Assessment of magnitude and associated factors of road traffic accidents among minibus taxi drivers in Megenagna, Torhailoch and Saris, Addis Ababa, Ethiopia. Journal of Health and Environmental Research, 8(3): 197-211. https://doi.org/10.11648/j.jher.20220803.14
[29] Cynthia, A.N., Kılıç, B., Nainkwi, F.C. (2023). Increasing rate of road traffic accidents in Sub Saharan Africa, an issue of negligence or carelessness? Case study, Cameroon. World Journal of Advanced Research and Reviews, 18(2): 1317-1326. https://doi.org/10.30574/wjarr.2023.18.2.0984
[30] Molla, A.S. (2024). Magnitude and determinants of road traffic accidents in North Gondar Zone; Amhara Region, Ethiopia. F1000Research, 12: 367. https://doi.org/10.12688/f1000research.123111.3
[31] Gudugbe, S., Yeboah, D.K., Konadu, P., Awoonor-Williams, R., Clegg-Lamptey, J.N.A., Rahman, G.A., Kokor, D.A. (2023). Approaches to the effective prevention of road traffic injuries in Sub-Saharan Africa: A systematic review. Open Journal of Social Sciences, 11(2): 323-344. https://doi.org/10.4236/jss.2023.112021
[32] Hareru, H.E., Negassa, B., Kassa Abebe, R., Ashenafi, E., Zenebe, G.A., Debela, B.G., Ashuro, Z., Eshete Soboksa, N. (2022). The epidemiology of road traffic accidents and associated factors among drivers in Dilla Town, Southern Ethiopia. Frontiers in Public Health, 10: 1007308. https://doi.org/10.3389/fpubh.2022.1007308
[33] Olugbara, C.T., Letseka, M., Olugbara, O.O. (2021). Multiple correspondence analysis of factors influencing student acceptance of massive open online courses. Sustainability, 13(23): 13451. https://doi.org/10.3390/su132313451
[34] Peter, R.E., Olugbara, O.O., Adeliyi, T.T. (2024). Multiple correspondence analysis of talent management in Higher Education Institutions. In International Conference on WorldS4. Singapore: Springer Nature Singapore. Springer, Singapore, pp. 503-514. https://doi.org/10.1007/978-981-97-9327-3_40
[35] Bedane, T.T., Assefa, B.G., Mohapatra, S.K. (2021). Preventing traffic accidents through machine learning predictive models. In 2021 International Conference on Information and Communication Technology for Development for Africa (ICT4DA), Bahir Dar, Ethiopia, pp. 36-41. https://doi.org/10.1109/ICT4DA53266.2021.9672249
[36] Pursan, G., Adeliyi, T., Joseph, S. (2023). Information technology technical support success factors in higher education: Principal component analysis. International Journal of Advanced Computer Science and Applications, 14(6): 270-282. https://doi.org/10.14569/IJACSA.2023.0140630
[37] Epizitone, A., Olugbara, O.O. (2020). Multiple correspondence analysis of critical success factors for enterprise resource planning system implementation. Journal of Management Information and Decision Sciences, 23(3): 175-186.
[38] Rahman, M.A., Hossain, M.M., Mitran, E., Sun, X. (2021). Understanding the contributing factors to young driver crashes: A comparison of crash profiles of three age groups. Transportation Engineering, 5: 100076. https://doi.org/10.1016/j.treng.2021.100076
[39] Mishra, S., Rajendran, P.K., Vecchietti, L.F., Har, D. (2023). Sensing accident-prone features in urban scenes for proactive driving and accident prevention. IEEE Transactions on Intelligent Transportation Systems, 24(9): 9401-9414. https://doi.org/10.1109/TITS.2023.3271395
[40] Jamaluddin, F., Saibani, N., Mohd Pisal, S.M., Wahab, D.A., Hishamuddin, H., Sajuri, Z., Khalid, R.M. (2022). End-of-life vehicle management systems in major automotive production bases in Southeast Asia: A review. Sustainability, 14(21): 14317. https://doi.org/10.3390/su142114317
[41] Elvik, R. (2023). What would a road safety policy fully consistent with safe system principles mean for road safety?. Accident Analysis & Prevention, 193: 107336. https://doi.org/10.1016/j.aap.2023.107336
[42] Aroba, O.J. (2024). The implementation of augmented reality in Internet of Things for virtual learning in higher education. International Journal of Computing Sciences Research, 8: 2536-2549. https://stepacademic.net/ijcsr/article/view/464.
[43] Khan, M.N., Das, S. (2024). Advancing traffic safety through the safe system approach: A systematic review. Accident Analysis & Prevention, 199: 107518. https://doi.org/10.1016/j.aap.2024.107518
[44] Adebayo, S., Aworinde, H.O., Olufemi, O.O., Osueke, C.O., Adeniyi, A.E. Aroba, O.J. (2025). Understanding mushroom farm environment using TinyML-based monitoring devices. Environmental Research Communications, 7(4): 045014. https://doi.org/10.1088/2515-7620/adc5cd
[45] Luca, C. (2024). Designing scalable software-agent systems for real-time traffic law enforcement. https://www.researchgate.net/profile/Charlie-Luca/publication/389069715_Designing_Scalable_Software-Agent_Systems_for_Real-_Time_Traffic_Law_Enforcement/links/67b3ffa34c479b26c9e54745/Designing-Scalable-Software-Agent-Systems-for-Real-Time-Traffic-Law-Enforcement.pdf.
[46] Masello, L., Sheehan, B., Castignani, G., Guillen, M., Murphy, F. (2025). Predictive modeling for driver insurance premium calculation using advanced driver assistance systems and contextual information. IEEE Transactions on Intelligent Transportation Systems.