Pawenary*![]() | Hari Purnomo
| Hari Purnomo![]() | Winda Nur Cahyo
| Winda Nur Cahyo![]()
OPEN ACCESS
The electricity industry is a sector with high workplace safety risks, particularly for PDKB (Live Working) operators. This study aims to develop a safety hazards prediction model for the electricity industry in Indonesia using the Human-Computer Interaction (HCI) approach. The research stages begin with field observations, literature reviews, and interviews, followed by a Focus Group Discussion (FGD) with five stakeholders from PT PLN. The results of the interviews and FGDs were analyzed thematically to design a conceptual model, which was then used as the basis for the development of a questionnaire. The questionnaire was distributed to 200 PDKB operators in the distribution unit of PT PLN. The collected data were analyzed using the SEM-PLS (Structural Equation Modeling - Partial Least Squares) method through SmartPLS 3 software. Based on the analysis results, a manual book for measuring Key Performance Indicators (KPIs) based on significant latent variables was developed. This manual was tested with 30 PDKB operators in the UPDL Semarang for one month, followed by validity and difference tests against the existing manual book. The results of the study show that the developed prediction model is capable of identifying significant factors influencing potential hazards and can be used as the basis for more targeted workplace safety interventions in Indonesia's electricity industry. While the model demonstrates strong predictive capability, the study is limited by its focus on a single state-owned enterprise and may not fully represent the diversity of working conditions across the industry. Future research should consider broader sampling across different regions and organizational types, as well as integrating real-time data and digital monitoring systems to enhance model adaptability and precision in dynamic field environments.
safety hazards in the electricity industry, development Human-Computer Interaction (HCI), SEM-PLS, workplace safety, prediction models
The electricity sector is one of the key sectors that supports Indonesia’s economic growth, which also brings many challenges, particularly regarding Occupational Health and Safety (OHS) in the electricity industry. The scope of the electricity industry includes the expansion of power plants, distribution, and electricity sales. The power plants in Indonesia consist of both PLN (State Electricity Company) plants and several non-PLN power plants. The electricity supply in Indonesia has seen a significant increase, from 62,202.94 MW in 2017 to 72,750.72 MW in 2020 [1]. The electricity industry serves as the backbone for providing critical energy to various sectors, yet the potential impacts on worker health and safety in this industry require serious attention.
Three main factors that impact accidents in the electricity industry are unsafe equipment, unsafe working environments, and hazardous operating procedures, according to the Occupational Safety and Health Administration (OSHA) scenario analysis [2]. The potential electrical hazards are quite complex and diverse, so dealing with these dangers is closely related to several factors, one of which is the skill and experience of the workers [3]. Work accidents related to electricity can have significant impacts on the productivity of the electricity industry and affect workers. According to OSHA data, 86% of losses in production, transmission, and distribution are caused by electricity, leading to a loss of 12,976 workdays per year [4]. Data from the National Institute for Occupational Safety and Health (NIOSH) shows 244 accidents consisting of five scenarios of electrical accident cases, including electrical network equipment (21%), contact with electrical networks (18%), damaged electrical network equipment (17%), and contact between conductive equipment and power lines (16%) [5].
Several previous studies have attempted to manage OHS risks in the electricity industry. Albert and Hallowell [6] evaluated OHS management using a cost and benefit approach in the construction industry in the United States. The results of this study showed that there were several effective strategies to reduce injuries from accidents caused by transmission and distribution maintenance, although these strategies had very high costs. Castillo-Rosa et al. [7] stated that in three types of activities—primary, secondary, and tertiary sectors in Spain—the impacts of electrical accidents, whether directly or indirectly, would result in differences. Electrical accidents can lead to a high proportion of severe and fatal accidents. Strategies that can be implemented include ensuring that the installation and equipment used comply with laws regarding protection against electrical contact. Wang et al. [8] developed a lightweight, accurate, and efficient safety hazard detection model based on MobileNet to detect safety hazards in critical resource locations. The data used in this model consists of 1,440 photo data points, including the conditions of power plants in normal operation and related facilities.
Furthermore, the study by Baby et al. [9] indicates a relationship between personal factors, safety climate, and workers' health conditions with work-related accidents in India. Some measures that need to be implemented to reduce personal issues in the workplace include awareness of safety participation, knowledge, and safety training. Workers with low educational backgrounds in India were found to have lower safety climate factor scores, highlighting the importance of technical qualifications for high-risk jobs like those in the electricity industry. The study by Sadeghi-Yarandi et al. [10] developed the Electrical Industry Safety Risk Index (EISRI) for the electricity distribution industry. Based on three components—personal, environmental, and organizational aspects—the personal aspect showed a significant impact of human factors in work activities. The results of the EISRI development can be used for risk control, especially in developing countries with lower risk management performance.
By understanding the unique context of the electricity industry in Indonesia, the development of a safety hazards model in the electricity industry is not only a necessity to comply with regulations but also a genuine effort to protect invaluable human resources and support the sustainable growth of the vital electricity sector, which is critical for the future of Indonesia’s economy. The developed safety hazard model for the electricity industry, particularly for distribution unit operators, can serve as a reference to create interventions that are suitable for the existing conditions in Indonesia’s electricity industry. This research focuses on developing a safety hazard prediction model for the electricity industry in Indonesia using human-computer interaction.
Specifically, this study contributes by designing a predictive model that integrates qualitative insights from field observations and stakeholder discussions with quantitative analysis using Structural Equation Modeling (SEM-PLS). The proposed model identifies key latent variables that influence hazard risk and enables the creation of a practical KPI-based safety manual. This manual can serve as a tool for real-time performance assessment and targeted safety interventions in PLN’s distribution units. Thus, the study not only adds to the academic discourse on safety management but also offers actionable strategies for improving occupational safety in Indonesia’s electricity sector.
2.1 Occupational Health and Safety (OHS)
Occupational Health and Safety (OHS) is a fundamental requirement for both Micro, Small, and Medium Enterprises (MSMEs) as well as large companies in conducting their business operations. The purpose of implementing Occupational Health and Safety is to maintain the health and safety of the work environment and to protect coworkers, employees' families, consumers, and others who may also be affected by the work environment. This is because OHS is closely related to the outcomes of production. Every industry must be able to reduce the risks of accidents and occupational diseases to prevent decreased production productivity [11].
Occupational Health and Safety (OHS) is crucial for moral, legal, and financial reasons. Every organization has the obligation to ensure that workers and others involved remain in a safe condition at all times. Occupational Health and Safety practices include prevention, sanctions, and compensation, as well as wound healing and care for workers, providing health care, and sick leave. Efforts for safety include conditions that can lead to death, illness, or stress, both in the workplace and at home. Health is related to the employee being free from physical or non-physical illnesses [12].
Work safety is the protection effort carried out by the company to prevent employees from experiencing work-related accidents while performing their tasks. This protection is provided for physical, mental, and social well-being, with preventive measures against health problems or disorders caused by work and environmental factors, as well as common diseases that could cause harm or loss in the workplace. Work safety is the state in which employees are safe and free from accidents while performing their duties. As a result, employees can complete their work as planned and improve their performance [13].
2.2 Safety hazards
Safety hazards (bahaya keselamatan) are potential risks posing threats to safety. Worker safety in the workplace, especially in industries that involve various high-risk activities, is crucial. These hazards can include physical accidents, exposure to hazardous chemicals, or even ergonomic factors that affect workers' long-term health. Safety hazards need to be well-managed to prevent injuries or accidents that could harm both the company and the workers. Therefore, proper identification of potential hazards is essential in creating a safer work environment [14].
Risk management is the primary approach used to identify and manage safety hazards in industries. As an initial step, companies need to conduct a thorough hazard identification, followed by risk analysis and the implementation of mitigation measures. Effective risk management not only reduces the potential hazards but also increases safety awareness among workers. With a deep understanding of the existing risks, preventive measures can be applied to avoid accidents that may occur [14].
Technology also plays an important role in managing safety hazards, especially with advancements in automation systems and data analysis. The use of Human-Machine Interface (HMI) systems, for example, allows operators to monitor operational conditions in real-time and detect potential hazards before they become major issues. Technologies such as automated sensors and data-based monitoring systems can detect risks early and provide quick responses, which in turn helps reduce accidents and improve operational efficiency. These technologies also enable stricter monitoring of high-risk processes [15].
Workplace safety culture also plays a critical role in managing safety hazards. In this regard, creating a strong safety culture encourages workers to be more concerned about their own safety as well as the safety of their colleagues. Organizations that instill safety values in their workplace culture are more likely to succeed in reducing accidents and improving compliance with safety procedures. With heightened awareness and responsibility, workers will be more proactive in attending safety training and following established procedures, thus creating a safer work environment [16].
2.3 Human Computer Interaction
Based on the Encyclopedia Britannica, Human-Computer Interaction (HCI) is an interdisciplinary field that studies how to design optimal interactions between users and computers, as well as developing interfaces that support these interactions. HCI encompasses the communication process between humans and computers in specific ways, using interaction languages to complete particular tasks [17].
As an interdisciplinary field, HCI involves various disciplines such as computer science, psychology, sociology, graphic design, and industrial design. Over time, HCI has transformed from manual activities to web-based interfaces and multimodal intelligent interaction systems. Current research in this field focuses on various aspects, including user personalization, embedded computing, augmented reality, social computing, knowledge-based interaction, emotion-based interaction, and brain-computer interfaces [3]. These developments have had a significant positive impact on the quality of human life.
Human-Computer Interaction (HCI) is a multidisciplinary field that continues to evolve, encompassing various disciplines such as computer science, industrial design, psychology, behavioral science, organizational behavior, and physiology. Since the concept of HCI was first applied to hazard recognition in the construction sector, many new research topics requiring a cross-disciplinary understanding have emerged. However, as the number of scientific publications in this field increases, manual analysis of the literature becomes impractical. The large volume of documents to be reviewed creates a substantial workload, often leading researchers to spend significant time and effort just to identify research focuses and classify the literature correctly. Moreover, the subjective classification process conducted by researchers is highly prone to human error, which can result in discrepancies between the findings in the literature review and the actual conditions [18].
Traditionally, hazard recognition relied on manual monitoring, traditional human resource management, and post-incident analysis. However, modern approaches focus more on risk prediction, accident prevention, deep learning, intuitive devices based on brain waves and eye movements, and multimodal data processing. Therefore, topics arising from the application of human-computer interaction are closely related to technologies such as virtual reality, augmented reality, computer vision, and computer simulation. After formulating the CHR-HCI (Construction Hazard Recognition–Human–Computer Interaction) framework, future research directions can be determined more systematically.
2.4 Safety management in Indonesia
The electricity sector in Indonesia poses significant safety challenges, prompting increased research on effective occupational safety and health (OSH) management strategies. Recent studies emphasize the adoption of formal safety management systems like SMK3 and ISO 45001 as crucial for enhancing workplace safety. Evidence from PT PLN Indonesia Power Barru shows that integrating these frameworks into routine practices helps reduce accidents and improve compliance [19]. The traditional hazard recognization can be seen as below in Figure 1.
Worker engagement and safety awareness are also pivotal. Research at PLTU Bolok Unit II highlights how employee attitudes and knowledge about safety directly affect adherence to safety protocols. This underscores the importance of ongoing training programs to foster a proactive safety culture within the workforce [20].
Risk management approaches have evolved to address both conventional electrical hazards and new challenges such as those emerging during the COVID-19 pandemic. Proactive risk identification and control measures tailored to power plant environments contribute to safer operations [21].
Technological innovation, particularly the use of Internet of Things (IoT) devices, is transforming safety practices by enabling real-time monitoring and quicker hazard response. These advancements align with Indonesia’s national OSH objectives, which aim to reduce workplace incidents through modernized safety solutions.
Analyses of workplace accidents reveal that multiple factors—such as insufficient training, weak safety culture, and inadequate hazard controls—continue to cause incidents. This calls for targeted, data-driven safety interventions specific to the electricity industry’s context [22].
Additionally, studies from related sectors like electronic manufacturing offer valuable safety management methods that can be adapted to electricity operations. PT PLN’s commitment to safety, demonstrated through programs like the Contractor Safety Management System and the goal of “Zero Accidents,” reflects an industry-wide push toward stronger safety governance.
Together, these studies suggest that a comprehensive approach—integrating system implementation, human factors, risk management, technology, and organizational commitment—is essential for improving safety performance and protecting workers in Indonesia’s electricity sector.
2.5 Partial Least Square-Structural Equation Modelling (PLS-SEM)
Partial Least Squares - Structural Equation Modeling (PLS-SEM) is one of the SEM methods frequently used for theory development in exploratory research. PLS-SEM emphasizes explaining variance. In PLS-SEM, constructs are represented by proxies in the form of weighted composites of indicator variables related to the construct. Therefore, PLS-SEM is a composite-based SEM approach, reducing the reliance on the strict assumptions of CB-SEM that all covariation between groups of indicators must be explained by a common factor [23].
PLS-SEM has become increasingly popular in various fields of study due to its ability to handle data that is not normally distributed and highly complex models. PLS-SEM offers several advantages, such as not requiring many assumptions, being suitable for various data scales, and being applicable to small sample sizes. The minimum sample size for PLS-SEM can be determined by two rules: ten times the largest number of indicators used to measure a variable, and ten times the number of independent variables pointing to a dependent variable [23].
PLS-SEM has two main models: the inner model (structural model), which describes the relationships between latent variables, and the outer model (measurement model), which depicts the relationship between manifest variables and latent variables. In the measurement model, PLS uses principal component analysis (PCA) on the variance extraction blocks to observe the relationship between indices and latent variables through total variance, including common variance, specific variance, and total variance. This method falls under confirmatory factor analysis (CFA). The stages of using PLS are as follows [23]:
The PLS analysis process can be performed using several software tools such as SmartPLS, VPLS, and PLSGUI. In this research, SmartPLS was used for data analysis, as this application allows users to apply measurement scales other than interval scales [23].
Workmap and design program
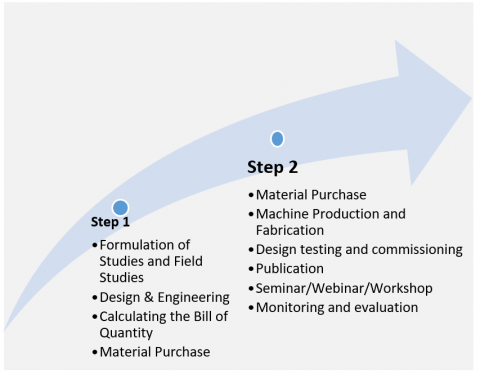
The object of this study is the distribution unit of PT PLN (Persero). The subject of this research is the operators of Work in Energized Conditions (PDKB) at the distribution unit. The criteria for the subjects of this study include PDKB operators in the distribution unit who have at least 3 years of work experience, are aged between 25 and 45 years, and are in good physical and mental health. The workmap in this reserach can be seen in Figure 2 as below:
Figure 2. Workmap
The research plan has been thoroughly implemented, starting from the formulation of the research questions, searching and reviewing literature, designing engineering processes, calculating the required costs, and completing the production process and the required outputs.
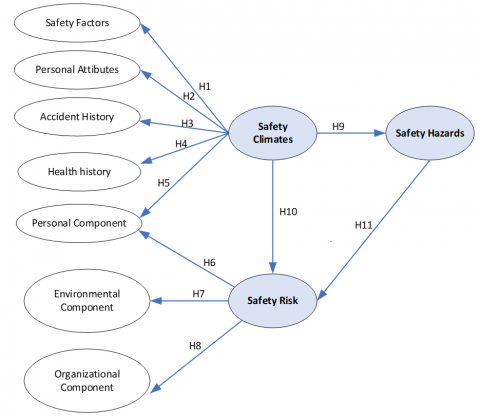
This study consists of 15 hypotheses based on a conceptual model. The hypotheses are categorized into causal hypotheses (direct effects) and mediation hypotheses (indirect effects). The details of the hypotheses are as follows:
a. Causal Hypotheses (Direct Effect)
H1: Safety Factors positively affect Safety Climates.
H2: Personal Attributes positively affect Safety Climates.
H3: Accident History positively affects Safety Climates.
H4: Health History positively affects Safety Climates.
H5: Personal Component positively affects Safety Climates.
H6: Personal Component positively affects Safety Risk.
H7: Environmental Component positively affects Safety Risk.
H8: Organizational Component positively affects Safety Risk.
H9: Safety Climates positively affect Safety Hazards.
H10: Safety Climates positively affect Safety Risk.
H11: Safety Hazards positively affect Safety Risk.
b. Mediation Hypotheses (Indirect Effect)
H12: Safety Climates mediate the relationship between Personal Component and Safety Risk.
H13: Safety Climates mediate the relationship between Accident History and Safety Risk.
H14: Safety Climates mediate the relationship between Health History and Safety Risk.
H15: Safety Hazards mediate the relationship between Safety Climates and Safety Risk.
c. Reverse Causal Hypothesis
H16: Safety Hazards affect Safety Climates.
The survey data obtained in this study, comprising 203 respondents, were processed and analyzed using the Structural Equation Modeling (SEM) method with a Partial Least Squares (PLS) approach. The initial stage in PLS-SEM involves the evaluation of the measurement model (outer model). The evaluation of the measurement model must meet several criteria, including convergent validity, reliability, and discriminant validity. The construct parameter for the questionnaire can be seen as Table 1 as below.
Table 1. Contruct parameter
|
No |
Variable |
Code |
Indicator |
Reference |
|
1 |
Safety Hazards |
SH 1 |
How often do you observe potential hazards such as malfunctioning tools or equipment that do not meet standards in the workplace during live-line electrical distribution maintenance? |
This Research |
|
SH 2 |
How often do you find work areas with poor lighting, inadequate ventilation, or other environmental conditions that may pose a risk of accidents? |
This Research |
||
|
SH 3 |
How often are employees at all levels encouraged to promptly report safety and health hazards as well as unsafe acts to their supervisors and/or safety contacts for follow-up action? |
Moore et al. [28] |
||
|
SH 4 |
How often are new equipment, tools, materials, and methods used in electrical network maintenance evaluated prior to purchase, implementation, and use to ensure they do not pose safety and health hazards during live-line maintenance? |
Moore et al. [28] |
||
|
SH 5 |
How often are safety inspections conducted regularly during live-line electrical network maintenance to identify unsafe acts, conditions, and hazards that may affect safety, and how are these hazards promptly eliminated or minimized? |
Moore et al. [28] |
||
|
2 |
Safety Climates |
SC 1 |
How often does management provide relevant information to ensure compliance with safety laws and regulations? |
Schüler and Matuszczyk [29] |
|
SC 2 |
How often does management listen to employees when conflicts arise related to safety regulations and workplace safety policies? |
Schüler and Matuszczyk [29] |
||
|
SC 3 |
How often does management ensure there are always opportunities to participate in physical training? |
Schüler and Matuszczyk [29] |
||
|
SC 4 |
How often do you feel that safety is an integral part of all training? |
Schüler and Matuszczyk [29] |
||
|
SC 5 |
How often do you believe that management has a good understanding of the safety regulations and policies governing live-line electrical network maintenance, as well as how these are applied during the work? |
Schüler and Matuszczyk [29] |
||
|
3 |
Safety Risk |
SR 1 |
How often do you find qualified personnel or live-line maintenance (PDKB) operators making mistakes in the workplace? |
Wang et al. [30] |
|
SR 2 |
How often do you find a lack of electrical knowledge or legal operation of electrical equipment among fellow PDKB operators during live-line maintenance of the electrical network at the workplace? |
Wang et al. [30] |
||
|
SR 3 |
How often do you feel that the electrical equipment used during live-line maintenance of the electrical network at the workplace is not routinely inspected? |
Wang et al. [30] |
||
|
SR 4 |
How often do you find illegal use of PDKB electrical equipment, resulting in circuit overloads and fires? |
Wang et al. [30] |
||
|
SR 5 |
How often do you find PDKB operators not wearing safety equipment when entering the worksite? |
Wang et al. [30] |
||
|
4 |
Safety Factors |
SF 1 |
How often do you make extra efforts to improve safety in the workplace? |
Arifin et al. [31] |
|
SF 2 |
How often do you know how to follow work procedures according to safety standards? |
Arifin et al. [31] |
||
|
SF 3 |
How often do you encourage your coworkers to work safely in the workplace? |
Arifin et al. [31] |
||
|
SF 4 |
How often do you always speak to company management if there are any issues related to workplace safety? |
Arifin et al. [31] |
||
|
SF 5 |
How often do you believe that occupational safety and health issues are important? |
Arifin et al. [31] |
||
|
5 |
Personal Attributes |
PA 1 |
How old are you? |
Baby et al. [9] |
|
PA 2 |
How long is your work experience? |
Baby et al. [9] |
||
|
PA 3 |
What is your highest level of education? |
Baby et al. [9] |
||
|
6 |
Accident History |
AH 1 |
How often have you experienced an accident in the past year? |
Baby et al. [9] |
|
AH 2 |
How often have you encountered major risks that caused accidents in the past year? |
This Research |
||
|
AH 3 |
How often have you encountered minor risks that caused accidents in the past year? |
This Research |
||
|
AH 4 |
How often have you nearly experienced a work-related accident in the past year? |
This Research |
||
|
7 |
Health History |
HH 1 |
How often have you suffered from an occupational disease in the past year? |
This Research |
|
HH 2 |
How often have you suffered from a non-work-related illness in the past year? |
This Research |
||
|
HH 3 |
How often have you experienced a minor illness in the past year? |
This Research |
||
|
HH 4 |
How often have you experienced a minor illness in the past two years? |
This Research |
||
|
8 |
Personal Component |
PC1 |
How often do you avoid rushing during your work shifts? |
Sadeghi-Yarandi et al. [10] |
|
PC2 |
How often are you aware of the skills and knowledge required to perform the duties of a PDKB operator? |
Sadeghi-Yarandi et al. [10] |
||
|
PC3 |
How often do you use personal and group protective equipment (PPE) in your work as a PDKB operator? |
Sadeghi-Yarandi et al. [10] |
||
|
PC4 |
How often are you aware that physical competence is required to perform the duties of a PDKB operator? |
Sadeghi-Yarandi et al. [10] |
||
|
9 |
Environmental Component |
EC 1 |
How often do you not encounter hazardous work situations in your role as a PDKB operator? |
Sadeghi-Yarandi et al. [10] |
|
EC 2 |
How often do you find old or worn-out equipment and work facilities in your role as a PDKB operator? |
Sadeghi-Yarandi et al. [10] |
||
|
EC 3 |
How often do you find personal and group protective equipment available in your role as a PDKB operator? |
Sadeghi-Yarandi et al. [10] |
||
|
EC 4 |
How often do you feel that the current working environment as a PDKB operator is beneficial to you? |
Sadeghi-Yarandi et al. [10] |
||
|
10 |
Organizational Component |
OC 1 |
How often do you not experience excessive time pressure while performing tasks as a PDKB operator? |
Sadeghi-Yarandi et al. [10] |
|
OC 2 |
How often do you find the necessary equipment, facilities, and knowledge for a PDKB operator available in the current workplace? |
Sadeghi-Yarandi et al. [10] |
||
|
OC 3 |
How often do you participate in risk identification and risk assessment programs at your current workplace? |
Sadeghi-Yarandi et al. [10] |
||
|
OC 4 |
How often do you feel that design, planning, organized responsibilities, and supervision from the company are present at this workplace? |
Sadeghi-Yarandi et al. [10] |
||
|
OC 5 |
How often do you perceive the company’s concern for safety and the tendencies of supervisors and the company regarding working hours and economic issues? |
Sadeghi-Yarandi et al. [10] |
||
|
OC 6 |
How often do you experience monitoring, inspections, and audits conducted by the company? |
Sadeghi-Yarandi et al. [10] |
A measurement model is said to meet the requirements for convergent validity when each indicator has an outer loading value above 0.50, and each construct has an Average Variance Extracted (AVE) value of 0.50 or more [23]. In addition, Cronbach’s Alpha and Composite Reliability (CR) are used to measure the internal consistency reliability of each construct. If the Composite Reliability (CR) and Cronbach’s Alpha values are greater than 0.70, the construct is considered to have met the reliability requirement [23].
Discriminant validity testing is then conducted based on the recommendation of Fornell and Larcker [24] by comparing the square root value of AVE with the correlation values between constructs. Another method used to test discriminant validity is the HTMT (Heterotrait-Monotrait ratio) approach. HTMT is calculated by taking the ratio between inter-construct correlations (heterotrait) and intra-construct correlatioF24(monotrait) estimated from the PLS model. The recommended HTMT value is below 0.90 [25]. If the HTMT value between two constructs is less than 0.90, the constructs are considered to have good convergent consistency and are distinguishable from each other.
The next step is to evaluate the structural model (inner model) to test the research hypotheses. A bootstrapping procedure was conducted with 5000 resampling using SmartPLS 4.0 software [26]. The quality of the structural model was assessed using coefficient of determination (R²), predictive relevance (Q²), and path coefficients [27].
The coefficient of determination (R²) is used to measure the predictive accuracy of the model. Meanwhile, predictive relevance (Q²) evaluates how well the observed values and the model-generated parameters align. A Q² value greater than 0 indicates that the model has good predictive relevance [26]. In addition, path coefficient testing was carried out to examine the research hypotheses.
This study tested 11 hypotheses using a one-tailed test with a significance level of 5%. If the hypothesis testing results in a p-value < 0.05, the hypothesis is accepted; otherwise, if the p-value ≥ 0.05, the hypothesis is rejected.
The research hypotheses in new model can be seen as Figure 3 below.
Figure 3. The research hypotheses of the new model
These hypotheses are designed to explore the relationships between various factors influencing safety in the workplace, particularly in the context of PT PLN's distribution unit. A literature review was then conducted on previous studies related to the safety hazards model. Subsequently, interviews and Focus Group Discussions (FGD) were conducted with 5 stakeholders at PT PLN, including representatives from K3L, and training centers in the transmission and distribution units. The results of the interviews and FGDs were analyzed using thematic analysis. Based on the literature review and FGD results, the next step was the design of a conceptual model for the development of the safety hazards model in the electricity industry.
The next stage involved designing a questionnaire for the development of the safety hazard model in the electricity industry based on the latent variables identified in the conceptual research model. After the questionnaire was designed, data collection was carried out with 200 PDKB operator respondents in the distribution units of PT PLN.
The data collected from the questionnaires were then processed using the SEM PLS method with SMART-PLS 3 software. After obtaining the results of the model development, a manual book was designed to measure the Key Performance Indicators (KPIs) based on the significant latent variables in the model. The process of designing the manual book will be tested to measure the KPIs of PDKB workers in the Unit Pelaksana Pendidikan dan Pelatihan (UPDL) in Semarang. The trial process for evaluating KPIs based on the manual book design will be conducted over a period of one month with 30 PDKB operators.
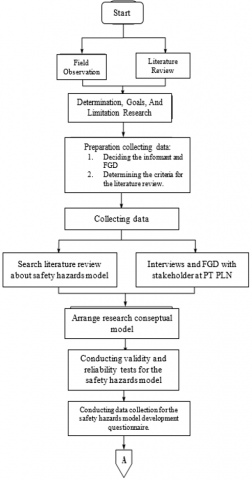
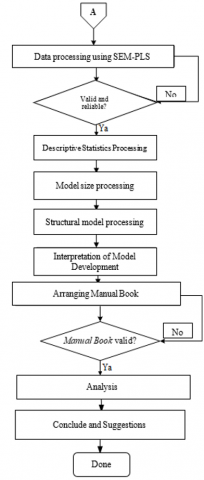
After the trial phase, validity tests will be performed on the KPI results with the designed manual book. Following that, a difference test will be conducted to test the significance of the results between the newly designed manual book and the existing manual book. The research flowchart and continuation of research flowchart can be seen as Figures 4 and 5 below.
Figure 4. Research flowchart
Figure 5. Research flowchart (continuation)
At the data collection stage of this study, several results were obtained from interviews, Focus Group Discussions (FGDs), and the collection of research questionnaire data.
4.1 Validity test
At the initial stage of questionnaire distribution, data were collected from 36 respondents, which were subsequently used for the validity and reliability testing of the questionnaire. These tests were conducted to ensure that the strength and clarity of the questionnaire items were well understood by the research respondents. The valiSdity test was performed using correlation analysis with a confidence level of 95%. The results of the questionnaire validity test in this study are presented in Table 2. Based on the validity test results, 42 questionnaire items were found to be valid, while 2 items—namely indicators PC1 and EC5—were found to be invalid. The invalid items were subsequently removed from the research questionnaire.
Table 2. Results of the validity test of the questionnaire
|
Factor |
Indicator |
r-count |
r-table |
Description |
|
Safety Hazards |
SH1 |
0.391 |
0.329 |
Valid |
|
SH2 |
0.444 |
0.329 |
Valid |
|
|
SH3 |
0.693 |
0.329 |
Valid |
|
|
SH4 |
0.741 |
0.329 |
Valid |
|
|
SH5 |
0.841 |
0.329 |
Valid |
|
|
Safety Climates |
SC1 |
0.830 |
0.329 |
Valid |
|
SC2 |
0.732 |
0.329 |
Valid |
|
|
SC3 |
0.796 |
0.329 |
Valid |
|
|
SC4 |
0.566 |
0.329 |
Valid |
|
|
SC5 |
0.846 |
0.329 |
Valid |
|
|
Safety Risk |
SR1 |
0.586 |
0.329 |
Valid |
|
SR2 |
0.732 |
0.329 |
Valid |
|
|
SR3 |
0.606 |
0.329 |
Valid |
|
|
SR4 |
0.580 |
0.329 |
Valid |
|
|
SR5 |
0.736 |
0.329 |
Valid |
|
|
Safety Factors |
SF1 |
0.723 |
0.329 |
Valid |
|
SF2 |
0.874 |
0.329 |
Valid |
|
|
SF3 |
0.879 |
0.329 |
Valid |
|
|
SF4 |
0.684 |
0.329 |
Valid |
|
|
SF5 |
0.775 |
0.329 |
Valid |
|
|
Accident History |
AH1 |
0.739 |
0.329 |
Valid |
|
AH2 |
0.918 |
0.329 |
Valid |
|
|
AH3 |
0.901 |
0.329 |
Valid |
|
|
AH4 |
0.604 |
0.329 |
Valid |
|
|
Health History |
HH1 |
0.543 |
0.329 |
Valid |
|
HH2 |
0.815 |
0.329 |
Valid |
|
|
HH3 |
0.903 |
0.329 |
Valid |
|
|
HH4 |
0.866 |
0.329 |
Valid |
|
|
Personal Component |
PC1 |
0.256 |
0.329 |
No Valid |
|
PC2 |
0.603 |
0.329 |
Valid |
|
|
PC3 |
0.660 |
0.329 |
Valid |
|
|
PC4 |
0.749 |
0.329 |
Valid |
|
|
PC5 |
0.712 |
0.329 |
Valid |
|
|
Environmental Component |
EC1 |
0.672 |
0.329 |
Valid |
|
EC2 |
0.658 |
0.329 |
Valid |
|
|
EC3 |
0.699 |
0.329 |
Valid |
|
|
EC4 |
0.749 |
0.329 |
Valid |
|
|
EC5 |
0.027 |
0.329 |
No Valid |
|
|
Organizational Component |
OC1 |
0.580 |
0.329 |
Valid |
|
OC2 |
0.745 |
0.329 |
Valid |
|
|
OC3 |
0.578 |
0.329 |
Valid |
|
|
OC4 |
0.719 |
0.329 |
Valid |
|
|
OC5 |
0.644 |
0.329 |
Valid |
|
|
OC6 |
0.573 |
0.329 |
Valid |
The validity test is conducted to examine whether the indicators of the statements in the measurement tool or questionnaire are valid or not, using the product-moment correlation. If the indicators are valid, they will be used for subsequent research, and if not, those indicators can be disregarded or removed from the questionnaire. The decision of whether the indicators are valid or not is based on the comparison between the calculated r-value (r-hitung) and the critical r-value (r-tabel), or the p-value. An indicator is considered valid if the correlation coefficient r-hitung > r-tabel or the p-value < 0.05. For N=36 (df=N-2=34), the r-tabel value is 0.329. The validity test results show that there are indicators that are invalid, namely PC1 and EC5 in Table 2.
4.2 Reliability test
The reliability test used in this research is the Cronbach's Alpha statistical test. Table 3 shows the results of the reliability test for all indicators in the variables used in this research, which are acceptable. This is in line with Ghozali's statement that a construct or variable is considered reliable if the Cronbach's Alpha value is greater than 0.60. The results indicate that all variables are reliable, as the Cronbach's Alpha values for each variable are greater than 0.60.
Table 3. Reliability test results of the questionnaire
|
Variable |
Cronbach's Alpha |
N of Items |
Descripton |
|
Safety Hazards |
0.622 |
5 |
Reliabel |
|
Safety Climates |
0.810 |
5 |
Reliabel |
|
Safety Risk |
0.611 |
5 |
Reliabel |
|
Safety Factors |
0.803 |
5 |
Reliabel |
|
Accident History |
0.801 |
4 |
Reliabel |
|
Health History |
0.805 |
4 |
Reliabel |
|
Personal Component |
0.641 |
4 |
Reliabel |
|
Environmental Component |
0.658 |
4 |
Reliabel |
|
Organizational Component |
0.705 |
6 |
Reliabel |
4.3 Structural Equation Modeling-Partial Least Square (SEM-PLS) data processing
The survey data collected in this study, consisting of 203 respondents, were processed and analyzed using the Structural Equation Modeling (SEM) method with a Partial Least Square (PLS) approach. According to Hair et al. [25, 32], PLS is an alternative SEM method used to address complex variable relationships and serves as a highly suitable analytical tool for theory development. In exploratory research such as this, the SEM-PLS method is particularly useful as it helps generate more insightful findings [25]. Furthermore, SEM-PLS is more appropriate in this context because it does not require specific assumptions regarding sample size or data distribution [33]. The software used for the analysis was SmartPLS 4.0.
4.4 Measurement model evaluation
The evaluation of the measurement model involves several requirements that must be met, including convergent validity, reliability, and discriminant validity. A measurement model is considered to meet the criteria for convergent validity when each indicator has an outer loading value above 0.50 and each construct has an Average Variance Extracted (AVE) value of 0.50 or higher [23]. The AVE value represents the average of the squared loadings of a set of indicators associated with a construct. In short, an AVE value of 0.50 indicates that the construct is able to explain more than half of the variance of its indicators [23].
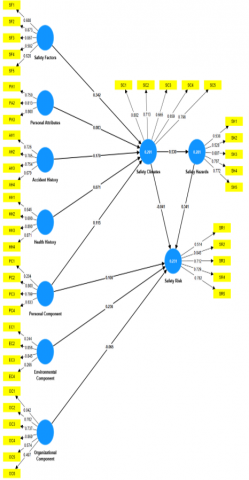
Figure 6 shows that some indicators have outer loading values below 0.50 and some constructs have AVE values less than 0.50, indicating that these constructs do not meet the requirements for convergent validity. In addition, there are constructs with Composite Reliability (CR) and Cronbach’s Alpha values below 0.7, meaning that these constructs do not yet meet the criteria for construct reliability. To fulfill the criteria for convergent validity and reliability, indicators that do not meet the required thresholds need to be removed from the model. The construct reability table can be seen in Tables 4 and 5 as below;
Figure 6. Start SEM-PLS
Table 4. Construct reliability and validity of the initial SEM-PLS model
|
Construct |
Indicotor |
Outer Loading |
AVE |
Cronbach's Alpha |
Composite Reliability |
|
Safety Hazards |
SH 1 |
0.538 |
0.424 |
0.654 |
0.782 |
|
SH 2 |
0.528 |
||||
|
SH 3 |
0.607 |
||||
|
SH 4 |
0.767 |
||||
|
SH 5 |
0.772 |
|
|
|
|
|
Safety Climates |
SC 1 |
0.802 |
0.533 |
0.781 |
0.850 |
|
SC 2 |
0.713 |
||||
|
SC 3 |
0.665 |
||||
|
SC 4 |
0.659 |
||||
|
SC 5 |
0.798 |
|
|
|
|
|
Safety Risk |
SR 1 |
0.514 |
0.525 |
0.772 |
0.844 |
|
SR 2 |
0.845 |
||||
|
SR 3 |
0.712 |
||||
|
SR 4 |
0.729 |
||||
|
SR 5 |
0.782 |
|
|
|
|
|
Safety Factors |
SF 1 |
0.688 |
0.544 |
0.783 |
0.853 |
|
SF 2 |
0.873 |
||||
|
SF 3 |
0.867 |
||||
|
SF 4 |
0.582 |
||||
|
SF 5 |
0.628 |
|
|
|
|
|
Personal Attributes |
PA 1 |
0.750 |
0.655 |
0.782 |
0.850 |
|
PA 2 |
0.813 |
||||
|
PA 3 |
0.860 |
|
|
|
|
|
Accident History |
AH 1 |
0.726 |
0.543 |
0.719 |
0.826 |
|
AH 2 |
0.785 |
||||
|
AH 3 |
0.754 |
||||
|
AH 4 |
0.679 |
|
|
|
|
|
Health History |
HH 1 |
0.646 |
0.612 |
0.782 |
0.861 |
|
HH 2 |
0.690 |
||||
|
HH 3 |
0.890 |
||||
|
HH 4 |
0.871 |
|
|
|
|
|
Personal Component |
PC1 |
0.204 |
0.504 |
0.640 |
0.778 |
|
PC2 |
0.800 |
||||
|
PC3 |
0.799 |
||||
|
PC4 |
0.833 |
|
|
|
Table 5. Construct reliability and validity of the initial SEM-PLS model (continued)
|
Construct |
Indicator |
Outer Loading |
AVE |
Cronbach's Alpha |
Composite Reliability |
|
Environmental Component |
EC 1 |
0.244 |
0.394 |
0.386 |
0.669 |
|
EC 2 |
0.856 |
||||
|
EC 3 |
0.845 |
||||
|
EC 4 |
0.266 |
||||
|
Organizational Component |
OC 1 |
0.042 |
0.395 |
0.698 |
0.763 |
|
OC 2 |
0.702 |
||||
|
OC 3 |
0.737 |
||||
|
OC 4 |
0.869 |
||||
|
OC 5 |
0.574 |
||||
|
OC 6 |
0.497 |
After conducting several measurement model evaluations, the final SEM-PLS model was obtained. The iteration process went through three stages to achieve a valid model. Table 6 shows that the outer loading values for each indicator range from 0.584 to 0.904, and the AVE values for each construct range from 0.534 to 0.782, indicating that the model meets the requirements for convergent validity. In addition, Cronbach’s Alpha and Composite Reliability (CR) were used to assess the internal consistency reliability of each construct. Based on Table IV.8, both the Composite Reliability (CR) and Cronbach’s Alpha values exceed 0.7, indicating that the constructs meet the criteria for reliability [23].
Table 6. Reliability and validity of constructs in the final SEM-PLS model
|
Construct |
Indicator |
Outer Loading |
AVE |
Cronbach's Alpha |
Composite Reliability |
|
Safety Hazards |
SH 3 |
0.703 |
0.633 |
0.709 |
0.837 |
|
SH 4 |
0.829 |
||||
|
SH 5 |
0.847 |
||||
|
Safety Climates |
SC 1 |
0.801 |
0.534 |
0.781 |
0.850 |
|
SC 2 |
0.720 |
||||
|
SC 3 |
0.672 |
||||
|
SC 4 |
0.652 |
||||
|
SC 5 |
0.795 |
||||
|
Safety Risk |
SR 2 |
0.826 |
0.602 |
0.779 |
0.858 |
|
SR 3 |
0.722 |
||||
|
SR 4 |
0.757 |
||||
|
SR 5 |
0.795 |
After conducting several measurement model evaluations, the final SEM-PLS model was obtained. The iteration process went through three stages to achieve a valid model. Table 6 shows that the outer loading values for each indicator range from 0.584 to 0.904, and the AVE values for each construct range from 0.534 to 0.782, indicating that the model meets the requirements for convergent validity. In addition, Cronbach’s Alpha and Composite Reliability (CR) were used to assess the internal consistency reliability of each construct. Based on Table IV.8, both the Composite Reliability (CR) and Cronbach’s Alpha values exceed 0.7, indicating that the constructs meet the criteria for reliability [23].
4.5 Discriminant validity testing
Discriminant validity testing was conducted based on the recommendation of Fornell and Larcker [24], which involves comparing the square root of AVE values with the correlations between constructs. Tables 6 and 7 show that the square root of each construct’s AVE is greater than its correlations with other constructs, indicating that the model satisfies the criteria for discriminant validity.
In addition, discriminant validity was also assessed using the HTMT (Heterotrich - Monetarist Ratio) method. The HTMT test calculates the ratio between the correlations across constructs (heterotrich) and the correlations within the same construct (monorail), as estimated from the PLS model. The recommended HTMT threshold is below 0.90 [25]. If the HTMT value between two constructs is less than 0.90, the constructs are considered to have good convergent consistency and can be distinguished from one another. The results in Table IV.10 show that the HTMT values between all construct pairs are below 0.90, leading to the conclusion that all constructs meet the requirements for discriminant validity.
4.6 Hypothesis testing
The structural model evaluation was carried out to test the research hypotheses. The bootstrapping procedure was conducted with 5,000 resamples using SmartPLS 4.0 software [26]. The quality of the structural model was assessed by testing the coefficient of determination (R²), predictive relevance (Q²), and path coefficients [23]. This study tested 11 directional hypotheses using a one-tailed test at a 5% significance level. The last SEM-PLS flowchart can be seen as Figure 7 below:
Figure 7. Last SEM-PLS
The results in Table 8 are summarized as follows:
Hypothesis H1 is accepted, indicating that safety factors have a positive influence on safety climate (β = 0.338, p = 0.000). This means that the better the safety factors, the higher the safety climate.
Hypothesis H2 is rejected, meaning that improvements in personal attributes do not significantly influence safety climate, as indicated by a p-value of 0.137, which is greater than 0.05.
Hypothesis H3 is accepted, showing that accident history has a positive influence on safety climate (β = 0.177, p = 0.004). Better accident history leads to improved safety climate.
Hypothesis H4 is rejected, suggesting that health history does not significantly affect safety climate (p = 0.110 > 0.05).
Hypothesis H5 is also rejected, indicating that personal component does not significantly affect safety climate (p = 0.074 > 0.05).
Hypothesis H6 is accepted, showing that personal component has a positive influence on safety risk (β = 0.179, p = 0.014). This means that stronger personal components are associated with higher safety risk.
Hypothesis H7 is accepted, indicating that environmental component positively affects safety risk (β = 0.277, p = 0.000). Better environmental components are linked to increased safety risk.
Hypothesis H8 is rejected, suggesting that organizational component does not significantly affect safety risk (p = 0.262 > 0.05).
Hypothesis H9 is accepted, indicating that safety climate positively influences safety hazards (β = 0.581, p = 0.000). A higher safety climate leads to an increase in safety hazards.
Hypothesis H10 is rejected, showing that safety climate does not significantly affect safety risk (p = 0.112 > 0.05).
Hypothesis H11 is also rejected, meaning that safety hazards do not significantly affect safety risk (p = 0.126 > 0.05).
Hypothesis H1 is accepted, indicating that safety factors have a positive influence on safety climate (β = 0.338, p = 0.000). This means that the better the safety factors—such as availability of safety equipment, training programs, clear safety procedures, effective supervision, and open communication—the higher the safety climate in the workplace. Safety factors measured by indicators SF1, SF2, SF3, SF4, and SF5 significantly contribute to creating a safer work environment by promoting employees’ perception of organizational commitment to safety and encouraging safe behavior.
From a theoretical perspective, this finding aligns with the Safety Culture Theory and Organizational Climate Theory, which emphasize that tangible safety measures and management’s visible commitment to safety are critical in shaping employees’ shared perceptions about workplace safety. When employees see that safety resources and protocols are adequately provided and consistently enforced, they develop trust and confidence in the organization’s safety priorities. This positive safety climate fosters collective responsibility and motivates individuals to adhere to safety standards, reducing workplace accidents and injuries.
Practically, this result highlights the importance of continuous improvement in safety infrastructure, training quality, and communication channels to sustain a positive safety climate. Organizations should invest in regular safety audits, refreshers, and employee engagement to ensure these safety factors are effectively maintained and perceived by all workers.
Hypothesis H2 is rejected, meaning that improvements in personal attributes do not significantly influence safety climate, as indicated by a p-value of 0.137, which is greater than the significance threshold of 0.05. Personal attributes measured by indicators such as age, work experience, and last education level do not have a significant effect on safety climate.
This suggests that safety climate is predominantly shaped by organizational factors and safety management practices rather than by individual employee characteristics. According to Social Cognitive Theory, safety climate is a collective perception influenced mainly by shared experiences, leadership behavior, and organizational policies rather than demographic differences among employees. Individual factors like age or education may affect personal behavior or risk perception but do not substantially alter the overall workplace safety climate.
The final SEM-PLS Flowchart can be seen in Figure 8 as below:
Table 7. Reliability and validity of constructs in the final SEM-PLS model (continued)
|
Construct |
Indicator |
Outer Loading |
AVE |
Cronbach's Alpha |
Composite Reliability |
|
Safety Factors |
SF 1 |
0.687 |
0.544 |
0.783 |
0.853 |
|
SF 2 |
0.873 |
|
|
|
|
|
SF 3 |
0.867 |
|
|
|
|
|
SF 4 |
0.584 |
|
|
|
|
|
SF 5 |
0.627 |
|
|
|
|
|
Personal Attributes |
PA 1 |
0.747 |
0.653 |
0.782 |
0.849 |
|
PA 2 |
0.811 |
||||
|
PA 3 |
0.863 |
||||
|
Accident History |
AH 1 |
0.727 |
0.543 |
0.719 |
0.826 |
|
AH 2 |
0.785 |
||||
|
AH 3 |
0.755 |
||||
|
AH 4 |
0.677 |
||||
|
Health History |
HH 1 |
0.646 |
0.612 |
0.782 |
0.861 |
|
HH 2 |
0.691 |
||||
|
HH 3 |
0.891 |
||||
|
HH 4 |
0.872 |
||||
|
Personal Component |
PC2 |
0.795 |
0.659 |
0.742 |
0.853 |
|
PC3 |
0.804 |
||||
|
PC4 |
0.836 |
||||
|
Environmental Component |
EC 2 |
0.904 |
0.782 |
0.723 |
0.878 |
|
EC 3 |
0.865 |
||||
|
Organizational Component |
OC 2 |
0.695 |
0.535 |
0.726 |
0.819 |
|
OC 3 |
0.727 |
||||
|
OC 4 |
0.877 |
||||
|
OC 5 |
0.599 |
Table 8. Hypothesis testing results
|
Paths |
β-value |
S. D |
t-value |
p-values |
Description |
|
|
H1 |
Safety Factors -> Safety Climates |
0.338 |
0.080 |
4.215 |
0.000** |
accepted |
|
H2 |
Personal Attributes -> Safety Climates |
0.083 |
0.076 |
1.096 |
0.137 |
denied |
|
H3 |
Accident History -> Safety Climates |
0.177 |
0.067 |
2.635 |
0.004** |
accepted |
|
H4 |
Health History -> Safety Climates |
0.071 |
0.058 |
1.229 |
0.110 |
denied |
|
H5 |
Personal Component -> Safety Climates |
0.118 |
0.081 |
1.450 |
0.074 |
denied |
|
H6 |
Personal Component -> Safety Risk |
0.179 |
0.081 |
2.198 |
0.014* |
accepted |
|
H7 |
Environmental_Component -> Safety Risk |
0.277 |
0.082 |
3.374 |
0.000** |
accepted |
|
H8 |
Organizational_Component -> Safety Risk |
-0.052 |
0.082 |
0.636 |
0.262 |
denied |
|
H9 |
Safety Climates -> Safety Hazards |
0.581 |
0.058 |
10.094 |
0.000** |
accepted |
|
H10 |
Safety Climates -> Safety Risk |
0.097 |
0.080 |
1.216 |
0.112 |
denied |
|
H11 |
Safety Hazards -> Safety Risk |
0.084 |
0.074 |
1.145 |
0.126 |
denied |
Figure 8. Final T-statistic values of SEM-PLS
From a practical standpoint, this finding underscores the need for organizations to focus their safety efforts on systemic interventions, such as improving management commitment, strengthening safety communication, and implementing consistent safety policies, instead of relying on employee demographics to predict or improve safety climate. By targeting organizational-level changes, companies can create an inclusive and effective safety environment that benefits all employees regardless of their individual backgrounds.
4.7 Predictive model
The level of variance in the endogenous variables that can be explained by the exogenous variables is overall explained by R². According to Cohen (1988), there are three criteria for R² values: weak (R² ranges from 0.02 to 0.13), moderate (R² ranges from 0.13 to 0.26), and substantial (R² greater than 0.26). Based on Table 9 the model explains 28.9% of the variance in safety climate, 33.8% of the variance in safety hazards, and 17.3% of the variance in safety risk, with the remainder explained by variables outside the model. The results of this study indicate that the safety climate and safety hazards models fall into the substantial category, while the safety risk model falls into the moderate category.
Next, using the blindfolding method to assess the predictive relevance (Q²), which measures how well the observed values are predicted by the model and its parameter estimates, Table 9 shows Q² values ranging from 0.076 to 0.308. A Q² value greater than 0 indicates that the model has good predictive relevance [26].
Table 9. Amount R2 and Q2
|
R2 |
Q² |
|
|
Safety Climates |
0.289 |
0.135 |
|
Safety Hazards |
0.338 |
0.206 |
|
Safety Risk |
0.173 |
0.083 |
The results of this study provide a comprehensive view of the critical factors that influence workplace safety in Indonesia’s electricity industry, particularly in distribution units. The structural equation modeling (SEM-PLS) analysis confirms the significant influence of personal competence (PC), safety climate (SC), equipment condition (EC), and management commitment (MC) on safety hazard risk.
These findings are consistent with the study by Baby et al. [9] which highlighted how personal and organizational factors—such as competence and safety awareness—directly correlate with the likelihood of workplace accidents. The current research reinforces this by demonstrating that personal competence and safety climate are among the strongest predictors of safety hazard levels. The model further reveals that management commitment mediates the influence of other variables, underscoring the importance of leadership in fostering a culture of safety.
The significance of equipment condition (EC) also aligns with findings by Castillo-Rosa et al. [7] who emphasized the role of technical compliance and regular maintenance in preventing high-severity accidents. However, in the Indonesian context, limited resources and uneven regulatory enforcement make consistent equipment maintenance a continuing challenge. Therefore, the study emphasizes the need for clear technical standards and centralized asset audits.
From a practical perspective, this model has been translated into a KPI-based safety manual that can be integrated into PLN’s distribution units. This manual is designed to assist field supervisors in monitoring, evaluating, and improving worker behavior and hazard mitigation in real-time. Unlike traditional static manuals, this KPI approach allows dynamic adjustment based on measurable performance indicators.
Enhance Technical and Behavioral Training: Based on the significance of personal competence, electricity companies should prioritize targeted training that includes both technical certification and behavioral safety simulations. and strengthen management engagement with leadership training should be expanded for managerial roles to foster a more proactive safety climate. This includes regular feedback sessions, site visits, and worker recognition programs.
5.1 Validity test
The decision on whether an indicator is valid or not is based on the comparison between the calculated r-value (r-count) and the critical r-value (r-table), or based on the probability value (p-value). An indicator is considered valid if the correlation coefficient r-count > r-table or if the p-value < 0.05. For N=36 (df=N–2=34), the r-table value is 0.329. The results of the validity test show that there are indicators that are not valid, namely PC1 and EC5.
5.2 Reliability test
The reliability test used in this study is the Cronbach's Alpha statistical test. Table 2 shows that the reliability test results for all indicators of the variables used in this study are acceptable. Furthermore, the overall level of measurement is also acceptable, in accordance with Ghozali, who stated that a construct or variable is considered reliable if the Cronbach’s Alpha value is greater than 0.60 [34]. The results indicate that all variables are reliable, as shown by Cronbach’s Alpha values > 0.60 for each variable.
Despite the rigorous validity and reliability testing, this study has several limitations. The relatively small sample size (N=36) may limit the generalizability of the findings to the broader population of PDKB operators. Additionally, the invalid indicators (PC1 and EC5) suggest potential issues with some questionnaire items that require refinement. Future research should consider larger and more diverse samples to enhance representativeness and statistical power. Moreover, qualitative methods could be incorporated to explore in-depth factors influencing safety performance that are not fully captured by the current model. Further development of the measurement instrument is also necessary to improve indicator validity. Finally, longitudinal studies are recommended to assess the predictive power of the model over time and evaluate the effectiveness of implemented safety interventions.
I sincerely thank Universitas Islam Indonesia for providing the necessary resources and to teammates for their valuable contributions, without which this work would not have been possible.
[1] Ministry of Energy and Mineral Resources of the Republic of Indonesia, Directorate General of Electricity. (2020). Electricity statistics report. Jakarta: Ministry of energy and mineral resources. https://gatrik.esdm.go.id/assets/uploads/download_index/files/ccf8b-8f7e7-20211110-statistik-2020-rev03.pdf.
[2] Hemati, M., Nenmatpour, M., Amini, J., Saborifard, M. (2017). Using failure modes and effects analysis (FMEA) to risk assessment pipelines of petroleum products. JIMS8M: The Journal of Indian Management & Strategy, 22(2): 4-9. http://doi.org/10.5958/0973-9343.2017.00009.6
[3] Qu, Z., Zhang, Z., Liu, S., Cao, J., Bo, X. (2022). Knowledge-driven recognition methodology for electricity safety hazard scenarios. Energy Reports, 8: 10006-10016.
[4] Cadick, J., Capelli-Schellpfeffer, M., Neitzel, D. (2006). Electrical Safety Handbook (Third). McGraw-Hill. https://installist.wordpress.com/wp-content/uploads/2009/12/electrical-safety-handbook.pdf.
[5] Ilbahar, E., Karaşan, A., Cebi, S., Kahraman, C. (2018). A novel approach to risk assessment for occupational health and safety using Pythagorean fuzzy AHP & fuzzy inference system. Safety Science, 103: 124-136. https://doi.org/10.1016/j.ssci.2017.10.02
[6] Albert, A., Hallowell, M.R. (2013). Safety risk management for electrical transmission and distribution line construction. Safety Science, 51(1): 118-126. https://doi.org/10.1016/j.ssci.2012.06.011
[7] Castillo-Rosa, J., Suárez-Cebador, M., Rubio-Romero, J.C., Aguado, J.A. (2017). Personal factors and consequences of electrical occupational accidents in the primary, secondary and tertiary sectors. Safety Science, 91: 286-297. https://doi.org/10.1016/j.ssci.2016.08.021
[8] Wang, H., Lu, F., Tong, X., Gao, X., Wang, L., Liao, Z. (2021). A model for detecting safety hazards in key electrical sites based on hybrid attention mechanisms and lightweight Mobilenet. Energy Reports, 7: 716-724. https://doi.org/10.1016/j.egyr.2021.09.20
[9] Baby, T., Madhu, G., Renjith, V.R. (2021). Occupational electrical accidents: Assessing the role of personal and safety climate factors. Safety Science, 139: 105229. https://doi.org/10.1016/j.ssci.2021.105229
[10] Sadeghi-Yarandi, M., Torabi-Gudarzi, S., Asadi, N., Golmohammadpour, H., Ahmadi-Moshiran, V., Taheri, M., Ghasemi-Koozekonan, A., Soltanzadeh, A., Alimohammadi, B. (2023). Development of a novel Electrical Industry Safety Risk Index (EISRI) in the electricity power distribution industry based on fuzzy analytic hierarchy process (FAHP). Heliyon, 9(2): e13155. https://doi.org/10.1016/j.heliyon.2023.e13155
[11] Notoatmodjo, S. (2009). Human Resource Development (revised, Vol. 4). Rineka Cipta. https://lib.ui.ac.id/detail.jsp?id=20129445.
[12] Husen, A. (2009). Andi, project management. https://scholar.google.com/scholar?oi=bibs&cluster=6368731225887869720&btnI=1&hl=en.
[13] Mangkunegara, A.P. (2013). Corporate Human Resource Management. PT Remaja Rosdakarya. https://books.google.co.id/books/about/Manajemen_sumber_daya_manusia_perusahaan.html?id=WpohOAAACAAJ&redir_esc=y.
[14] Subramaniam, C., Mohd Shamsudin, F., Mohd Zin, M.L., Sri Ramalu, S., Hassan, Z. (2016). The influence of safety management practices on safety behavior: A study among manufacturing SMES in Malaysia. International Journal of Supply Chain Management (IJSCM), 5(4): 148-160.
[15] Vincoli, J.W. (2006). Basic Guide to System Safety (2nd ed.). John Wiley & Sons Ltd.
[16] Basahel, A.M. (2021). Safety leadership, safety attitudes, safety knowledge and motivation toward safety-related behaviors in electrical substation construction projects. International Journal of Environmental Research and Public Health, 18(8): 4196. https://doi.org/10.3390/ijerph1808419
[17] Kim, D., Goyal, A., Newell, A., Lee, S., Deng, J., Kamat, V.R. (2019). Semantic relation detection between construction entities to support safe human-robot collaboration in construction. In ASCE International Conference on Computing in Civil Engineering 2019, Atlanta, GA, USA, pp. 265-272. https://ascelibrary.org/doi/10.1061/9780784482438.034.
[18] Wang, J., Cheng, R., Liu, M., Liao, P.C. (2021). Research trends of human–computer interaction studies in construction Hazard recognition: A bibliometric review. Sensors, 21(18): 6172. https://doi.org/10.3390/s21186172
[19] Muhammad, M., Marsuki, M. (2023). Implementation of an Occupational Safety and Health Management system (A study of the implementation of Occupational Safety and Health at PT PLN Indonesia power, Barrru). Jurnal Penelitian Pendidikan IPA, 9: 850-858. https://doi.org/10.29303/jppipa.v9iSpecialIssue.6155
[20] Lowu, E.U., Nabuasa, D.J., Berek, N.C., Junias, M.S. (2021). Workers' perceptions of occupational safety and health at PLTU Bolok unit II NTT. Journal of Health and Behavioral Science, 3(4): 426-439. https://doi.org/10.35508/jhbs.v3i4.4130
[21] Farera, J.N., Ambarwati, R., Sumartik, S., Dedy, D. (2024). The risk assessment and human risk control in Indonesian power plant. Binus Business Review, 15(1): 93–105. https://doi.org/10.21512/bbr.v15i1.9803
[22] Prastawa, H., Mahachandra, M., Waly, G.Z. (2023). Occupational safety and health risk assessment in an electronic manufacturing company in Indonesia. E3S Web of Conferences, 448: 01014. https://doi.org/10.1051/e3sconf/202344801014
[23] Hair, J., Black, W., Babin, B., Anderson, R. (2010). Multivariate Data Analysis. Multivariate Data Analysis. https://books.google.co.id/books/about/Multivariate_Data_Analysis.html?id=SLRPLgAACAAJ&redir_esc=y.
[24] Fornell, C., Larcker, D.F. (1981). Evaluating structural equation models with unobservable variables and measurement error. Journal of Marketing Research, 18(1): 39.
[25] Sarstedt, M., Ringle, C.M., Hair, J.F. (2021). Partial least squares structural equation modeling. In Handbook of Market Research, pp. 587-632. Cham: Springer International Publishing. https://doi.org/10.1007/978-3-319-57413-4_15
[26] Chin, W.W. (2010). How to write up and report PLS analyses. Handbook of partial least squares. Springer, pp. 655-690.
[27] Hair, J.F., Jr, M.L.M., Matthews, R.L., Sarstedt, M. (2017). PLS-SEM or CB-SEM: Updated guidelines on which method to use. International Journal of Multivariate Data Analysis, 1(2): 107-123.
[28] Moore, L.L., Wurzelbacher, S.J., Chen, I.C., Lampl, M.P., Naber, S.J. (2022). Reliability and validity of an employer-completed safety hazard and management assessment questionnaire. Journal of Safety Research, 81: 283-296. https://doi.org/10.1016/j.jsr.2022.03.005
[29] Schüler, M., Matuszczyk, J.V. (2022). A multi-domain instrument for safety Climate: Military safety climate questionnaire (MSCQ) and NOSACQ-50. Safety Science, 154: 105851. https://doi.org/10.1016/j.ssci.2022.105851
[30] Wang, D., Liu, Y., Fan, R., Liu, X. (2023). Risk assessment and measures to improve safety management of offshore platforms in marine engineering projects. International Journal of Transportation Engineering and Technology, 9(3): 45-49. https://doi.org/10.11648/j.ijtet.20230903.11
[31] Arifin, K., Ali, M.X.M., Abas, A., Ahmad, M.A., Ahamad, M.A., Sahimi, A.S. (2023). The influence of hazard control and prevention toward safety behaviors and safety outcomes in coal-fired power plants using PLS-SEM. Journal of Safety Research, 86: 376-389. https://doi.org/10.1016/j.jsr.2023.07.017
[32] Hair, J.F., Risher, J.J., Sarstedt, M., Ringle, C.M. (2019). When to use and how to report the results of PLS-SEM. European Business Review, 31(1): 2-24. https://doi.org/10.1108/EBR-11-2018-0203
[33] Richter, N.F., Sinkovics, R.R., Ringle, C.M., Schl€agel, C. (2016). A critical look at the use of SEM in international business research. International Marketing Review, 33(3): 376-404. https://doi.org/10.1108/IMR-04-2014-0148
[34] Ghozali, I. (2016). Aplikasi Analisis Multivariete Dengan Program IBM SPSS 23 (Edisi 8)., 8th ed. Semarang: Badan Penerbit Universitas Diponegoro.