OPEN ACCESS
This article investigates the performance of standalone solar Stirling dish system used to electrify rural houses. The yearly performance which depends on location is simulated using software developed by The National Renewable Energy Laboratory’s SAM (Solar Advisor Model). Direct normal insolation, ambient temperature, density of air (altitude), sun elevation angle, and the wind speed are included in the simulation model. The model analyzes the performance of the parabolic mirror, receiver, Stirling engine, and the parasitic power consumption to predict the net power produced. The proposed model is validated against experimental data and found in very good agreement. The effect of major parameters such as; heater head temperature, receiver geometry, and cooling pump speed on the maximum power output and the corresponding overall efficiency are investigated. Simulations results indicate that the net global system efficiency is around 21% and can be improved by 3% at optimized condition. The annual energy output can be increased by 19% at optimal design conditions. Levelized cost of energy is around 0.115 kW/h which can be lowered by 0.013 kW/h at optimal design conditions. The yearly average receiver thermal losses are found to be 13 % of the total solar radiation entering the receiver and increases at early morning and late afternoon.
standalone solar dish stirling, solar thermal power, performance, energy conversion efficiency, SAM, techno economic
Interest in generation energy from renewable resources is still growing to meet the large energy demand in near future and protect environment. Solar energy is considered the most attractive renewable energy sources due to their high availability in most regions. Solar powered Stirling engine generators are considered the most efficient system in converting solar energy among all other solar power systems [1]. The net solar -to- electric energy conversion efficiency of Stirling dish system reached 29.4 % in 1984 [2]. It is worth mentioning that the efficiency is defined as the net electrical power delivered subtracting the electrical power needed for parasitic, divided by the direct normal irradiation (DNI) incident on the area of the mirrors. Furthermore, in 1984, two 17m -diameter Stirling dish systems (capacity for each =50kWe(. were installed and operated in Riyadh in Saudi Arabia [3]. The systems have achieved a net electrical output of 53kW and with net conversion efficiency of 23% at an insolation of 1000 W/m2. Recently, large dish/Stirling plant is constructed in Arizona, United States consists of 60 dishes with a capacity of 25.0kWe each providing a total capacity of 1.5MWe [4].
Solar Dish Stirling engines have great potential in countries with huge amount of solar radiation. Furthermore, Stirling dish systems are anticipated to outperform parabolic troughs by producing power at more economical rates and higher efficiencies. However, Stirling dish systems have not received significant attention as other solar technologies. They are suitable for hybrid operation due to their ability to combine different heat sources in one application. Due to the fact that parabolic dish concentrates only the direct radiation, two-axes tracking are required to continuously orient the dish towards the Sun. High receiver temperatures obtained from operating high concentration ratios allows highly efficient solar to electric conversion system. However, solar-to-electric efficiency for practical systems is found to range between 16% and 30% [5].
Stand- alone dish Stirling engine can be used for electricity generation [5]. Research has focused on system reliability, performance, and cost [5-19]. Finite time thermodynamic and traditional equilibrium thermodynamics are the two main methods for analyzing dish - Stirling engine. Results obtained from finite time thermodynamic method have more realistic instructive significance for the optimal design of real solar-driven systems than those derived from traditional thermodynamic. The optimal efficiency of high temperature differential dish-Stirling engine can reach 34% [20]. High temperature Stirling engine require careful expensive material selection and high-cost solar collector due to high concentration ratio. Furthermore, due to the seasonal variations of solar radiation, it is not always possible to achieve high receiver temperature. In fact, solar radiation levels change dramatically during the day. The optimal parameters found for high temperature Stirling engine are not necessary optimal for wide range of operating temperature. The objective of this study is to investigate the location-dependent stand- alone dish Stirling engine performance. Parametric study is conducted to investigate the effect of key parameters (receiver aperture diameter, engine heater head operating temperature, and pump operating speed) on system performance. Location dependent parameters include the ambient temperature, density of air (altitude), direct normal insolation, wind speed, and the sun elevation angle. A case study for SDS under Jordan climatic conditions is considered. Hence, the present analysis provides a new theoretical guidance for designing dish collectors and operating the Stirling heat engine system.
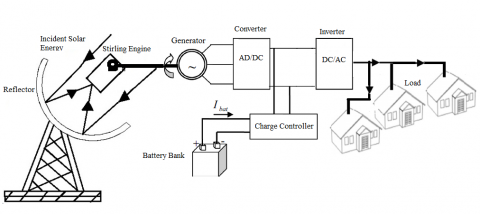
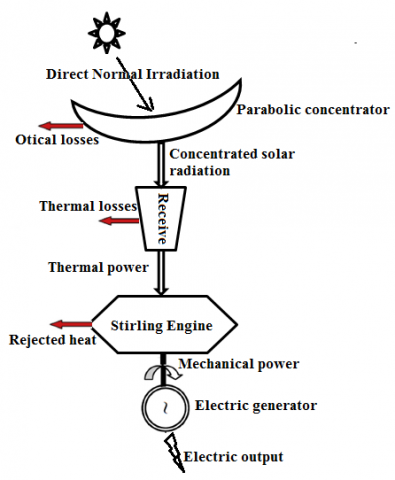
The Stirling dish system shown in Figure 1, produces electricity using concentrated solar thermal energy to drive a Stirling engine. The main components of system are a) dish collector, b) cavity receiver, c) Stirling engine, d) generator, e) converter, batteries bank, and inverter. The system utilizes a parabolic mirror equipped with dual-axis tracking to concentrate solar radiation onto a thermal receiver integrated in the Stirling engine. The function of the receiver is to transfer the absorbed solar energy to the working fluid in Stirling engine. The Stirling engine converts the absorbed thermal energy into a mechanical power by compressing the working fluid when it is cool and expanding it when it is hot. Through driving mechanism, this linear motion is converted to a rotary motion to turn a generator to produce electricity, as shown in Fig. 2. The size of the dish typically depends on the needed nominal power of the engine. The concentration of solar radiation is key parameters that affect the engine conversion efficiency.
Figure 1. Schematic diagram of the dish system
A Stirling receiver consists of an aperture and an absorber. The aperture in a Stirling receiver is located at the focal point of the parabolic concentrator to reduce radiation and convection losses. The intercept factor usually ranges between 94% and 99%. Direct-illumination receiver (DIR) is considered for Stirling absorbers in this study. Direct-illumination receiver has a bank of tubes to directly heat the working fluid in the Stirling engine using the solar radiation that is absorbed on the external surface of the tubes.
The Stirling cycle is a thermodynamic cycle in which thermal energy is transformed into mechanical energy. Detailed description of Stirling thermodynamic cycle can be found in [21]. A key component of Stirling engines is the regenerator, which stores and releases thermal energy periodically. The existence of regenerator raises the efficiency of the engine by maintaining heat within the system that otherwise would be exchanged with the environment. It reduces the heat flow from the high temperature reservoir to the low temperature reservoir without any additional gain of mechanical work.
Figure 2. Solar dish Stirling system energetic chain
This section presents theoretical background in all heat transfer mechanism occurring in solar dish Stirling engine. Furthermore, brief description of Stirling thermodynamic cycle is given. The overall efficiency of a dish - Stirling system, i.e. the solar-to-electric efficiency, depends on the following parameters; a) solar irradiance, b) concentration ratio, c) intercept factor, d) thermal receiver efficiency, e) engine efficiency, f) generator efficiency.
Three major thermal losses occur before energy reach Stirling engine namely; collector losses due to the mirror reflectivity, receiver intercept losses, and receiver thermal losses. It has been reported that between 25 % and 40% of solar energy is lost in collector and receiver before it reaches Stirling engine. The majority of thermal losses of Stirling dish system occur in receiver. Receiver thermal losses are conduction through the receiver housing, convection from the cavity, and radiation through the aperture opening to the ambient environment. The conduction losses are relatively small and can effectively minimize by applying proper insulation into receiver wall. Around 40% of the total receiver loses through natural convection and can be significantly reduced by placing a glass or quartz window over the aperture opening. However, cover will decrease radiation to the absorber. About 60% of losses through radiation which can be minimized by increasing the absorptance of the cavity, increasing the surface area of the cavity, adding an aperture cover, or by decreasing the aperture diameter. Receiver aperture diameter has major effect on the net system power taking into account the intercept factor and receiver losses.
There are several methods developed to analyze Stirling engine performance. Ideal and Adiabatic analyses are consider very ideal, where Quasi-Steady flow method is more realistic model of a Stirling engine. More practical models which have been validated against experimental data are developed. Although the Quasi steady flow model gives better predictions of Stirling engine performance than the ideal and adiabatic analysis, but still does not accurately account for all losses in the Stirling engine. Table 1 lists theoretical predictions of previously developed models for the GPU-3 engine. Among the models listed, Timoumi dynamic best model was able to predict the GPU-3 engine performance reasonably. The practical Stirling engine model should account for cycle irreversibility, non-isothermal in compression and expansion, pressure drop, imperfect regeneration, the thermal resistance in the heating head, and existence of dead volume. The practical analyses often involve performance correlations that have been shown to be accurate or making performance curve fits from experimental data.
Table 1. Theoretical analysis comparison for the GPU-3 engine (7.5 kW, 41.3 bar, Tc = 228K, Te = 977K [22].
|
Type of model
|
Indicated power output |
Thermal efficiency |
Error % |
|
|
Ideal Isothermal
|
7400 3958 8300 7109.3 7400 5886.1 |
70.5 |
12.9% |
4.2% |
|
Urieli and Berchowitz [22] adiabatic model |
8300 |
62.5 |
78.6% |
109.7% |
|
Timoumi dynamic model without losses [23] |
7109.3 |
54.96 |
57.0% |
79.6% |
|
Urieli and Berchowitz quasi-steady flow [22] |
7400 |
53.1 |
51.7% |
87.0% |
|
Timoumi dynamic with Internal and external conduction losses + Shuttle loss [23] |
5886.1 |
40.66 |
17% |
48.7% |
|
Timoumi dynamic best model [23] |
4273 |
38.49 |
10% |
8.0% |
|
Experiment [22] |
3958 |
35 |
- |
- |
Figure 3. Model methodology
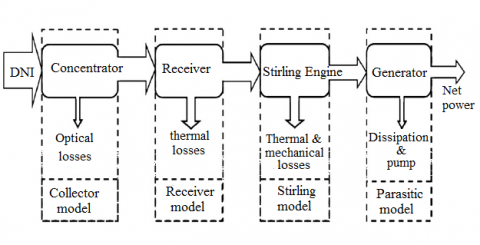
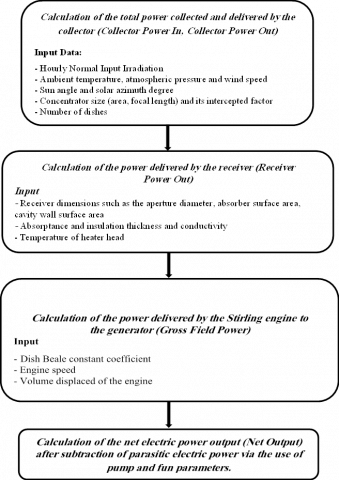
The National Renewable Energy Laboratory’s developed SAM software (Solar Advisor Model) [24]. SAM software has module for simulating dish-Stirling system which consists of a parabolic dish-shaped collector, receiver and Stirling engine. The engine in turn drives an electric generator. As shown in figure 3, SAM software subdivides the global model into four submodels, each of them representing a stage of the conversion cascade, solar-electricity (see figure 3). SAM software calculates the energy output of solar Stirling dish as shown in figure 4. Detailed description of various mathematical equations can be found in Ref. [25].
The simple approach for estimating Stirling engine power output is to use the Beale formula. This formula requires few design parameters and can be used for various configurations and sizes of Stirling engine. The power output according to Beale formula is [26]:
$P_{S E}=B e a l e \cdot P_{m e a n} \cdot V_{s w} \cdot f$ (1)
where PSE is the Stirling engine output power, Beale is the Beale number, Pmean is the mean engine pressure, Vsw is the swept volume of the engine, and f is the engine frequency. Walker [27] proposed a fixed value of 0.15 for Beale number for all types and sizes of Stirling engine.
SAM software uses practical model based on the Beale curve-fit equation with temperature correction. The model calculates the average hourly engine power output in Watts as a function of the Beale curve-fit equation, pressure curve-fit equation, the engine displacement and operating speed, and expansion space (heater head) temperatures. The Beale curve-fit equation calculates the engine's gross output power as a function of the input power calculated by the collector and receiver models. It has been shown that Beale number correlation appears to be the most accurate and precise model for predicting long term location dependent performance of Stirling dish systems [25].
Figure 4. Flowchart of SAM software calculation
4. Numerical results and discussion
Analyses of solar dish Stirling engine based on Beale curve fit are carried out using SAM to determine the yearly energy production under different meteorological conditions. The SAM model is also used to predict effect of aperture diameter, heater head temperature, and pump operating speed on overall system performance.
4.1 Site
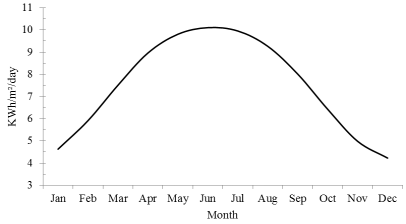
The considered site for this study is located in Maan area (latitude 30.15⁰N and longitude 35.75⁰E) located in the southern part of the country which receive on average above 2700 kWh/m2 [28]. Fig. 5 presents the measured direct normal irradiation (DNI) data at the considered site. It clearly shows that the level of monthly average values of the irradiation is high (>450 W/m2) over the whole year. The peak is reached in June, July and August. Hence, the country of Jordan has a high potential for CSP plants.
Figure 5. The amount of global horizontal solar radiation for each mo
4.2 Model validation
Table 2. Specifications and performance parameters for WGA systems [5]
|
Type No. of Facets |
Paraboloid 32 |
|
|
Glass Area (m2) |
42.9 |
|
|
Proj. Area (m2) |
41.2 |
|
|
Reflectivity |
0.94 |
|
|
Height (m) |
8.8 |
|
|
Width (m) |
8.8 |
|
|
Weight (kg) |
2864 |
|
|
Track Control |
Open/Closed Loop |
|
|
Focal Length (m) |
5.45 |
|
|
Intercept Factor |
0.99+ |
|
|
Peak C R (suns) |
>11,000 |
|
|
Power Conv. Unit |
WGA ADDS |
|
|
Aperture Dia. (cm) |
14 |
|
|
Engine Manf/Type |
SOLO 161 |
|
|
No. of Cylinders |
2 |
|
|
Displacement (cc) |
160 cc |
|
|
Op Speed (rpm) |
1800 |
|
|
Working Fluid |
hydrogen |
|
|
Power Control |
Variable Pressure |
|
|
Generator |
3 qi/480v/Induc |
|
|
No. Systems Built |
1 |
|
|
On-Sun Op (hrs) |
4000 |
|
|
Rated Output (kW) |
9.5 |
|
|
Peak Output (kW) |
11 |
|
|
Peak Efficiency Net |
24.5% |
|
|
Ann Efficiency Net |
18.9% |
|
|
Ann Energy (kWhrs) |
17,535 |
|
SAM software utilizes the model developed by Fraser (2008) and validated against three years of data from the Wilkinson, Goldberg, and Associates, Inc. (WGA) Mod 2-2 system [25]. Fraser compared between 11 models for predicting performance of Stirling dish systems. They developed model based on Beale curve fit for predicting Stirling engine power. Table 2 lists the geometrical and operating parameters of the WGA models used for validation. Their model uses theory from Stine and Harrigan [29] for the collector, Stine and McDonald [30] for natural convection from the receiver, Ma [31] for forced convection from the receiver, a performance curve fit using data for the Stirling engine by correcting the Beale number with a temperature correction term [32], and the parasitic power model uses performance theory from the fan laws and dimensionless pump performance correlations. The developed model predicted the net performance of the WGA Stirling dish system more accurately than existing Stirling dish system models when using one day of data to generate the performance curves. The standard deviation predicting the total energy over a three-year period of WGA data for the proposed model compared was 4.0 %. The average difference in power with the current model was 575 W. The Beale curve fit model generated from all of the WGA 10-minute averaged data is [25]:
Beale# $=0.103371+.0000184703 P_{\text {in}, S E}-3.07798 x^{-10} P_{\text {in}, S E}$ (2)
Detailed description for Stirling dish system performance prediction models can be found in [25].
Similar specifications for the solar dish Stirling engine system is considered in this study, to ensure accuracy of predictions (see table 3). The coefficients presented in Eq. (1) is used on our entire simulations. Table 3 lists the geometrical and operating parameters of the baseline case studied.
Figure 6 shows the system waterfall chart from solar energy to net power output. It shows the performance of each system component as power flows through the system. Each bars show a step of conversion while showing the optic, thermal and electric losses in the Dish Stirling system. The first bar shows the amount of solar radiation collected by the concentrators in the proposed site. Each consecutive bars show losses associated with the following sequential transfers of solar energy and heat into electrical power, such as shading errors in the concentrators, heat losses in the receivers, thermal and mechanical losses in Stirling engine. The last bar shows the parasitic power which is required to operate pumps and fan of the plant. Simulations results predicted that for baseline case, the net solar to electric efficiency is 21.5% in Maan area. Figure 7 shows the monthly variations for each energy chain of the Dish Stirling system. The results show the power generated from Stirling engine is above 3.4 MWh between Mars and October. The peak power generated reaches 5.85 MWh in July, while the lowest power is 1.68 MWh in December. Moreover, results show that the parasitic power almost negligible during winter time, i.e. less than 0.1 MWh.
Table 3 Geometrical and operating variables of the baseline case
|
Heater Head Set Temperature (K) |
993 |
|
|
Engine Operating Speed (rpm) |
1800 |
|
|
Displaced Engine Volume (m3) |
0.00038 |
|
|
Receiver Aperture Diameter |
0.14 |
|
|
Insulation Thickness (m) |
0.075 |
|
|
Insulation Thermal Conductivity (W/m-K) |
0.06 |
|
|
Absorber Absorptance |
0.9 |
|
|
Absorber Surface Area (m2) |
0.0942 |
|
|
Cavity Absorptance |
0.6 |
|
|
Cavity Surface Area (m2) |
0.4 |
|
|
Internal diameter of the Cavity Perp. to Aperture (m) |
0.26 |
|
|
Internal Depth of the Cavity Perpendicular to the Aperture (m) |
0.26 |
|
|
Working gas |
Hydrogen |
|
|
Tracking system power (W) |
150 |
|
|
Cooling fluid pump operating speed (rpm) |
1800 |
|
|
Collector Reflectance |
0.94 |
|
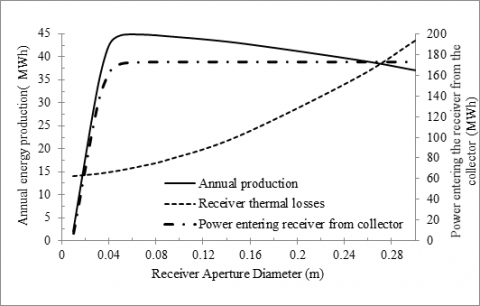
4.3 Receiver aperture diameter
The model was used to investigate the effect of varying the aperture diameter for the system. Simulations results are shown in figure 8. A simulation using for one year predicted that the system would produce 39.4 MWh with the current 0.186 m aperture diameter design and 44.7 MWh per year with an optimal aperture diameter of 0.06 m. These values indicate that the system could produce 15.2 % more energy by optimizing the aperture diameter. Results presented in figure 8 shows that the power enters the receiver from collector increases very rapidly with increase in aperture diameters and starts to level off at certain value. Furthermore, receiver thermal losses increase with increasing aperture diameter. This suggests that there is optimal value for aperture diameter where the annual energy production is maximum.
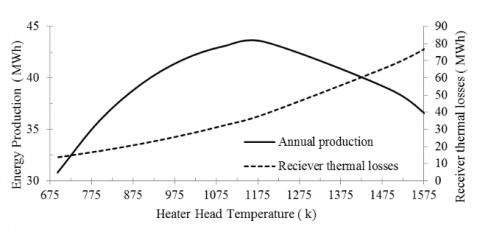
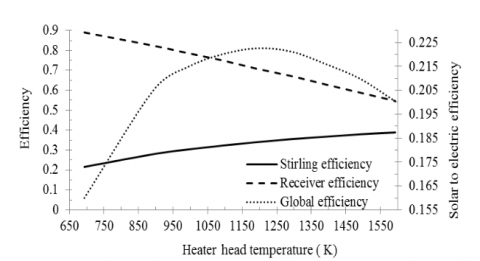
4.4 Varying the heater head temperature
Simulations are carried out to study the effect of heater head temperature. Figure 9 shows there is optimal heater temperature for the maximum energy production. For the selected site, simulations predict that optimal heater temperature is about 1100 K. Receiver losses and the engine efficiency depends on heater temperature. The maximum net efficiency is a function of the receiver losses and the engine efficiency as shown in Figure 10. As mentioned previously, receiver efficiency decreases with heater head temperature due to high thermal loses, while the engine efficiency increases with increasing heater temperature. Due to this opposite effect, it is expected to have optimum heater temperature where the net solar to electric efficiency is maximum. The maximum global system efficiency is 22.5%.
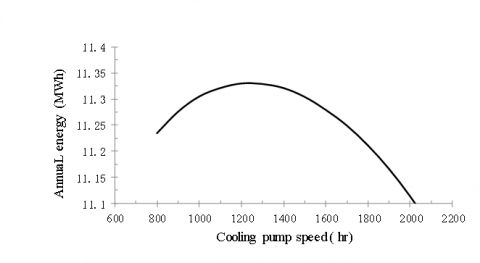
Figure 11 shows the effect of cooling pump speed on the annual energy production. The pump parasitic power is determined based on the flow rate of the pump and the properties of the cooling fluid used. The SAM model incorporates the dimensionless pump power laws, in addition to determining the compression space temperature based on the capacitance rate and properties of the cooling fluid, so the net effect on system energy production can be found by varying the pump operating speed. The optimal constant speed pump was found to be around 1200 rpm. Values presented in Figure 11 indicate that the system could produce 1% more energy by optimizing the cooling pump speed.
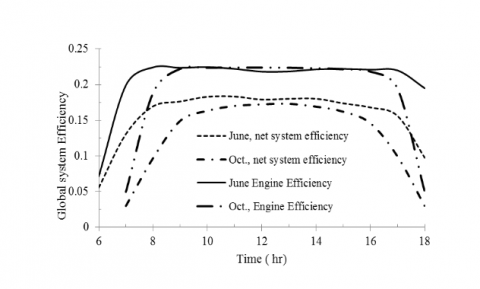
Figure 12 shows the hourly variation of monthly average system performance for base case scenario for June and October. Figure 12a shows that the net system efficiency remains almost constant during the day except early morning and late afternoon. The reason behind this is that the receiver losses are greater earlier and later in the day due to higher convection losses at lower solar elevation angles. It is apparent that convective losses represent a large fraction of the total Stirling dish system losses and the receiver losses, and are very dependent on aperture orientation. Convective losses are a function of cavity temperature and geometry, aperture orientation and diameter, wind velocity, and the effectiveness of the wind skirt. Convection losses are greatest in the morning and evening, and become less significant during the middle of the day with a dependence on the latitude of the systems. This dependence of convection losses with time of day results from the orientation of the receiver while tracking the sun. At noon, the receiver is pointed more vertically (with the receiver aperture facing down towards the ground) than during the early morning and late afternoon, in which orientation is more horizontal; thereby, creating a more stable convective situation. These losses are also dependent on the time of year and location since the angle between the sun and a horizontal surface changes with respect to these, and therefore affects the orientation of the receiver aperture. As shown in figure 12a, that the engine efficiency declines at 'early-day’ and 'late day' due to the receiver efficiency declining, i.e. the thermal input power to the engine is reduced.
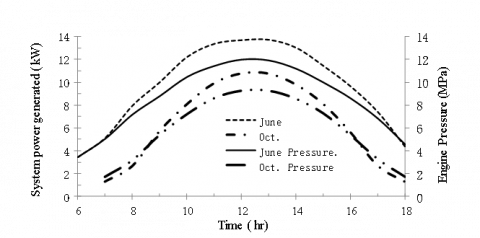
The engine pressure (working gas mass) is controlled to maintain a constant heater head temperature, so it will fluctuate constantly throughout the day. The engine pressure is dependent on the ambient temperature. The Stirling engine operates more efficiently at colder ambient temperatures. When the ambient temperature is lower, the engine pressure appears to be lower for a given input power. At higher input power to the engine, the pressure tends to be higher with colder ambient temperatures as shown in figure 12a and 12b. It is worth mentioning that the engine pressure is lower in the morning and evening which results in a lower working fluid density, a lower Reynolds number, and therefore a lower convective heat transfer coefficient between the absorber tubes and expansion space.
Table 4. Assumptions and data
|
Life time |
30 |
|
Electricity sale price ($/kWh) |
0.11 |
|
Fixed charge rate |
0.08 |
|
Annual electricity generated (MWh) |
11 |
|
Direct costs |
|
|
Collector cost ($/m2) |
350 |
|
Receiver cost($/kW) |
220 |
|
Stirling engine cost ($/kW) |
400 |
|
Contingency (% of direct costs) |
10 |
|
Indirect costs |
|
|
Engineering, Procurement and Construction (% of direct costs) |
16 |
|
Other costs (% of direct costs) |
3 |
|
Land purchase ($/m2) |
0 |
|
Total installed cost per capacity ($/kW) |
2425 |
|
Operation and maintenance costs |
|
|
Fixed ($/kW-year) |
40 |
|
Variable ($/kWh) |
0.06 |
The economical and financial aspects of electricity generation by solar dish Stirling engine are investigated through estimating the cost of electricity generation using the simulation tool SAM (System Advisor Model). The investment costs of the simulated system is shown in Table 4. The cost of the components is obtained from several sources. Figure 13 shows the variations of levelized cost of energy LCOE with heater head temperature. The LCOE drops significantly with heater temperature and starts rising again with further increase in heater temperature. Moreover, there is an optimum value of heater head temperature where LCOE is minimum.
Figure 6. Dish Stirling plant waterfall chart
Figure 7. Monthly variations of energy through system components
Figure 8. Effect of receiver aperture diameter on overall system performance.
Figure 9. Annual energy production as function of heater heat temperature
Figure 10. Variations of system components efficiency with heater heat temperature
Figure 11. Effect of cooling pump speed on the annual energy production
(a) Global and system efficiencies
(b) System power and engine power
(c) Reciever perfromance
Figure 12. Hourly variation of monthly average for base case scenario
Figure 13. Effect of heater head temperature on LCOE for the system
This paper presents performance analyses for solar Dish Stirling system to electrify rural houses. The yearly performance which depends on location is simulated using software SAM. Actual weather data are included in the simulation model. The thermal performance of the parabolic collector, receiver, Stirling engine, and the parasitic power consumption are analyzed. The proposed model is validated against actual data and found very accurate. The effect of major parameters such as; heater head temperature, receiver geometry, and cooling fluid pump speed on the maximum power output and the net solar to electric conversion efficiency are investigated. Simulations results indicate there are optimal values for heater head temperature, cooling pump speed and receiver aperture diameter for maximum power output. Simulations results show that receiver thermal losses are significant especially in the early morning and late afternoon due to high convection losses. Furthermore, the monthly average solar to electric conversion efficiency ranges between 19% in winter and 23% in summer. The system efficiency could be improved by more than 3% by optimizing the current design for the heater temperature, operating speeds of the pump, and the aperture diameter. The annual yearly energy production can be increased by 19% at optimal design. Simulation results predicts that the LCOE under optimal values are 0.10$/kWh. The present analysis provides a new theoretical guidance for designing dish collectors and operating the Stirling heat engine system.
[1] Jibran K., Mudassar A.H. (2016). Solar power technologies for sustainable electricity generation - A review, J. Renew. Sustain. Energy Rev., Vol. 55, pp. 414-425. DOI: 10.1016/j.rser.2015.10.135
[2] Charles E., et al. (1996). Solar heat pipe testing of the Stirling thermal motors 4-120 Stirling engine, IEEE Proceedings of the 31st Intersociety, Washington, DC, USA, pp. 1295-1300.
[3] Stine W.B. Diver R.B. (1994). Compendium of solar dish/stirling technology, Sandia National Laboratories, USA, No. SAND93-7026.
[4] National Renewable Energy Laboratories. Retrieved September 12, 2011 from http://www.nrel.gov/csp/solarpaces/by_technology.cfm
[5] Mancini T., Heller P. (2003). Dish-Stirling systems: An overview of development and status, J. Solar Energy Eng., Vol. 125, No. 2, pp. 135-151. DOI: 10.1115/1.1562634
[6] Barara M., Adiuku C., Beig A.R., Alhosani K.H., Al Sayari N., Akherraz M. (2016). Implementation of a DSPACE-based standalone renewable energy supply feeding an isolated load, Int. J. Energy Environ. Eng., Vol. 7, No. 2, pp. 125-35. DOI: 10.1007/s40095-016-0207-3
[7] Li H., Huang W., Huang F., Hub P., Chen Z. (2013). Optical analysis and optimization of parabolic dish solar concentrator with a cavity receiver, Sol Energy, Vol. 92, pp. 288-97. DOI: 10.1016/j.solener.2013.03.011
[8] Estera P., Mateusz S., Mariusz F. (2016). The numerical model of the high temperature receiver for concentrated solar radiation, Energy Convers. Manage., Vol. 125, pp. 97-106. DOI: 10.1016/j.enconman.2016.07.036
[9] Xiao G., et al. (2016). A model-based approach for optical performance assessment and optimization of a solar dish, Renew Energy, pp. 1-11. DOI: 10.1016/j.renene.2016.05.076
[10] Skouri S., Salah M.B., Bouadila S., Balghouthi M., Nasrallah S.B. (2013). Optical, geometric and thermal study for solar parabolic concentrator efficiency improvement under Tunisia environment: a case study. Energy Convers Manage, Vol. 75, pp. 366-73. DOI: 10.1016/j.renene.2016.05.076
[11] Hosseinzade H., Sayyaadi H. (2015). CAFS: The combined adiabatic-finite speed thermal model for simulation and optimization of Stirling engines, Energy Convers. Manage., Vol. 91, pp. 32-53. DOI: 10.1016/j.enconman.2014.11.049
[12] Boukelia T.E., Mecibah M.S., Kumar B.N., Reddy K.S. (2015). Optimization, selection and feasibility study of solar parabolic trough power plants for Algerian conditions, Energy Convers Manage, Vol. 101, pp. 450-459. DOI: 10.1016/j.enconman.2014.11.049
[13] Abbas M., Boumeddane B., Said N., Chikouche A. (2013). Techno economic study of the utilization of solar dish Stirling technology for electricity generation at the Algerian Sahara, Energy Sources, Part A: Recovery, Utilization, and Environmental Effects, Vol. 35, No. 15, pp. 1400-1409. DOI: 10.1016/j.enconman.2014.11.049
[14] Hijazi H., Mokhiamar O., Elsamni O. (2016). Mechanical design of a low cost parabolic solar dish concentrator, Alexandria Engineering Journal, Vol. 55, No. 1, pp. 1-11. DOI: 10.1016/j.aej.2016.01.028
[15] Kadri, Y., Abdallah, H.H. (2016).Performance evaluation of a stand-alone solar dish Stirling system for power generation suitable for off-grid rural electrification, Energy Conversion and Management, Vol. 129, pp. 140-156. DOI: 10.1016/j.enconman.2016.10.024
[16] Bakos G.C., Antoniades C. (2013). Techno-economic appraisal of a dish/Stirling solar power plant in Greece based on an innovative solar concentrator formed by elastic film, Renew Energy, Vol. 60, pp. 446-453. DOI: 10.1016/j.renene.2013.05.031
[17] Arora R., Kaushik S.C., Kumar R., Arora R. (2016). Multi-objective thermo-economic optimization of solar parabolic dish Stirling heat engine with regenerative losses using NSGA-II and decision making, International Journal of Electrical Power Energy Systems, Vol. 74, pp. 25-35. DOI: 10.1016/j.ijepes.2015.07.010
[18] Musmar S.A., Al-Kanhal T. (2014). Design optimization of thermal heat engines, International Journal of Heat and Technology, Vol. 32, No. 1, pp. 45-50.
[19] Cucumo M., Ferraro V., Kaliakatsos D., Mele M. (2015). Analysis of the performances of a dish-Stirling system equipped with hot chamber, International Journal of Heat and Technology, Vol. 33, No. 4, pp. 125-136. DOI: 10.18280/ijht.330416
[20] Li Y.Q., He Y.L., Weiwei W. (2011). Optimization of solar-powered Stirling heat engine with finite-time Thermodynamics, Renewable Energy, Vol. 36, pp. 421-427. DOI: 10.1016/j.renene.2010.06.037
[21] Bataineh K. (2015). Optimization analysis of solar-powered average temperature Stirling heat engine, Journal of Energy in Southern Africa, Vol. 26, pp. 55-66.
[22] Stirling Cycle Engine Analysis (1984). Adam Hilger Ltd, Bristol.
[23] Timoumi I., Tlili S., Nasrallah B. (2008). Design and performance optimization of GPU-3 Stirling engines, Energy, Vol. 33, No. 7, pp. 1100-1114. DOI: 10.1016/j.energy.2008.02.005
[24] National Renewable Energy Laboratory, http://www.nrel.gov/ analysis/sam, 2009.
[25] Fraser R. (2008). Stirling Dish system prediction model, M.S. thesis, University of Wisconsin, Madison, USA.
[26] Kongtragool B., Somchai W.S. (2005). Investigation on power output of the gamma-configuration low temperature differential Stirling engines, Renewable Energy, Vol. 30, pp. 465-476. DOI: 10.1016/j.renene.2004.06.003
[27] Walker G., Senft J.R. (1985) Introduction. in: free piston Stirling engines, Lecture Notes in Engineering, Vol. 12, Springer, Berlin, Heidelberg. DOI: 10.1007/978-3-642-82526-2_1
[28] Center G.A. (2005). Concentrating solar power for the Mediterranean Region, German Aerospace Center (DLR) Institute of Technical Thermodynamics, Section Systems Analysis and Technology Assessment, Stuttgart.
[29] Solar energy fundamentals and design with computer applications (1985). Wiley-Interscience, New York.
[30] Stine W.B. (1989). Cavity Receiver Convective Heat Loss, International Solar Energy Society, Solar World Congress, Kobe, Japan, pp. 4-8.
[31] Ma R.Y. (1993). Wind effects on convective heat loss from a cavity receiver for a parabolic concentrating solar collector, Vol. SAND92-7293, Sandia National Laboratory, US.
[32] McMahan A., Klein S.A., Reindl D.T. (2007). A finite-time thermodynamic framework for optimizing solar-thermal power plants, Journal of Solar Energy Engineering, Vol. 129, No. 4, pp. 355-362. DOI: 10.1115/1.2769689