Hui Zheng | Qi Ding*
© 2026 The authors. This article is published by IIETA and is licensed under the CC BY 4.0 license (http://creativecommons.org/licenses/by/4.0/).
OPEN ACCESS
Classroom psychological safety is a critical latent variable influencing students' cognitive engagement and expressive behaviors. However, its objective, real-time, and large-scale quantitative assessment has long been constrained by the reliance on subjective questionnaires. This paper proposes the Dual-Path Collaborative Cognitive Graph (DCCG) framework, which maps visual appearances to psychological safety scores in an end-to-end manner by fusing the spatial structure of group behaviors with the temporal signals of individual facial expressions from classroom surveillance videos. The framework comprises three deeply coupled modules: (1) At the group behavior segmentation level, a Dynamic Scale-Aware Dilated Convolution (DSADC) and a Geometric Boundary Adversarial Loss are designed to achieve pixel-level behavioral semantic parsing and individual pose prior extraction in densely occluded scenarios. (2) At the individual expression recognition level, the pose parameters output by the segmentation guide facial affine normalization. A Difference-Driven Multi-Scale Disentangled Attention mechanism is utilized to enhance micro-expression residual features, combined with Temporal Smooth Contrastive Regularization to suppress single-frame emotional jitter. (3) At the cross-scale collaborative inference level, a heterogeneous fully-connected graph containing group field nodes and individual particle nodes is constructed. Dual-path cross-attention message passing is employed to achieve deep interaction between macroscopic interaction fields and microscopic emotional signals, ultimately regressing the psychological safety score. This study provides an interpretable and deployable technical pathway for visual computing-based psychological state inference in educational settings.
classroom behavior analysis, image segmentation, fine-grained expression recognition, psychological safety, graph neural network, cross-scale collaborative inference
The in-depth advancement of educational digital transformation has enabled smart classrooms to move from concept to large-scale deployment, and massive amounts of classroom surveillance video provide an unprecedented data foundation for the automated analysis of teaching behaviors [1]. Accurately identifying students' behavioral patterns and emotional states from visual data can not only assist teachers in optimizing teaching strategies, but also serves as a core prerequisite for building adaptive learning systems [2]. In the highly socialized setting of a classroom, students' learning experiences do not occur in isolation, but are deeply embedded within the atmosphere constituted by collective interactions [3]. The so-called collective learning atmosphere is manifested as macroscopic features such as the spatial distribution of interaction density, the collective convergence pattern of attention, and the dynamic evolution of participatory behaviors. These features have complex and profound associations with students' internal psychological states [4]. Psychological safety, as the psychological foundation for individuals to dare to express opinions and take cognitive risks in a group without fear of negative evaluation, has been recognized by educational psychology research as a key latent variable affecting students' active learning behaviors [5]. However, current assessments of psychological safety almost entirely rely on questionnaire scales or qualitative interviews. Although such subjective methods can reflect students' self-perception, they are difficult to implement for real-time monitoring and large-scale coverage, and even more unable to capture the dynamic fluctuations of psychological states during the course of a class [6]. Therefore, how to find objective, continuous, and computable representational signals of psychological safety in natural classroom visual data has become a core problem that urgently needs to be solved in the field of educational technology [7].
The rapid development of visual computing technology provides a feasible solution path for this dilemma [8]. Classroom surveillance video naturally integrates information at two levels: at the macro level, the spatial distribution and dynamic evolution of group behaviors constitute the visual field of the collective learning atmosphere [9]; at the micro level, the temporal changes in individual facial expressions carry rich emotional state information [10]. Theoretically, if the macroscopic field structure of group behaviors and the micro temporal signals of individual expressions can be effectively integrated, a multi-level inference chain from visual appearance to collective atmosphere to psychological safety can be established [11]. However, there exists a fundamental semantic gap in this chain-there is no direct correspondence between pixel-level visual features and abstract concepts at the group psychological level [12]. Bridging this gap requires simultaneous breakthroughs in three interrelated technical dimensions: group behavior segmentation must advance from coarse object detection to pixel-level fine-grained semantic parsing [13]; individual expression recognition must extract sufficiently sensitive fine-grained emotional features from small-sized, large-pose face images [14]; more critically, a bidirectional and collaborative inference mechanism must be established between the group field and individual particles, rather than simple serial concatenation [15]. These three dimensions are mutually coupled, and insufficiency in any one link will block the effective inference from visual data to psychological state [16].
Examining existing research, there are significant limitations in each of the above three dimensions. In the field of group behavior analysis, current mainstream methods are still dominated by the object detection paradigm [17]. Models such as the You Only Look Once (YOLO) series [18], Swin Transformer [19], and Student Classroom Behavior Detection with Multi-Scale Deformable Transformers (SCB-DETR)-optimized for classroom scenarios in recent years [20] all output bounding-box-level behavior category annotations. Although this representation can indicate where and what kind of behavior exists in an image, it cannot accurately depict the spatial continuous distribution of behaviors and the interaction boundaries between regions [21]. When densely interactive areas appear in the classroom or students engage in close-range collaboration, overlapping and occlusion between bounding boxes make it difficult to accurately describe the spatial pattern of group behaviors, and even more impossible to provide pixel-level spatial priors for downstream individual analysis [22]. In the field of individual expression recognition, the particularity of classroom scenarios poses severe challenges to general recognition models [23]. The scale of student faces can vary by several times from the front row to the back row, head poses change drastically and frequently, and coupled with common situations in classrooms such as looking down, turning the face sideways, and hand occlusion, existing models generally face problems of unstable multi-scale feature fusion and attention region misactivation when transferred to classroom data [24]. Although some studies have attempted to introduce multi-scale dynamic Mamba architectures [25] or difference-aware fusion modules to improve the above problems [26], these improvements are all limited to the internal expression recognition module and fail to utilize the spatial pose information contained in group behavior analysis to provide prior constraints for expression recognition, resulting in the extraction process of individual emotional features being completely decoupled from the group physical field [27]. A deeper problem is that group behavior recognition and individual expression recognition are almost always treated as two independent modules processed serially in existing systems [28]. There is a lack of bidirectional interaction mechanism between group field information and individual particle information: on the one hand, the quantitative assessment of collective learning atmosphere lacks the substantial support of individual emotional states, and its output is often based only on the statistical features of behavior distribution [29]; on the other hand, the inference of psychological safety, without the constraint of group field information, makes it difficult to distinguish whether individual emotional changes originate from the shaping of the classroom atmosphere or exogenous factors unrelated to the classroom [30]. This decoupling makes the mapping from visual data to psychological state lack interpretability and causal foundation. Accordingly, although psychological safety has been widely studied in the field of educational psychology and mature theoretical frameworks have been established, the work in this field almost entirely relies on subjective scales or qualitative coding [31]. The visual computing community has not yet paid sufficient attention to this task, and technical solutions for automatically and quantitatively inferring student psychological safety levels from classroom videos are still blank in the literature [32].
In response to the above shortcomings, this paper proposes a unified visual computing framework named Dual-Path Collaborative Cognitive Graph (DCCG). This framework takes classroom surveillance video as input and realizes end-to-end quantitative mapping from visual appearance to student psychological safety scores via three deeply coupled modules: pixel-level semantic segmentation of group behaviors, fine-grained spatio-temporal recognition of individual expressions, and cross-scale graph collaborative inference. Specifically, at the group behavior segmentation level, Dynamic Scale-Aware Dilated Convolution (DSADC) and geometric boundary adversarial mechanism are designed to cope with scale dispersion and target adhesion in dense scenarios; at the expression recognition level, the pose prior output by segmentation is used to guide affine normalization, and a difference-driven multi-scale disentangled attention mechanism is adopted to enhance the extraction of micro-expression residual features; at the cross-scale inference level, a heterogeneous fully-connected graph containing group field nodes and individual particle nodes is constructed, and dual-path cross-attention message passing is employed to achieve deep interaction between macroscopic interaction fields and microscopic emotional signals, ultimately regressing the psychological safety score. In addition, this paper constructs a classroom simulation dataset covering multiple scenarios and multi-occlusion conditions, and systematically verifies the effectiveness of the framework from five dimensions-accuracy, generalization, robustness, interpretability, and causal sensitivity-through experiments. The subsequent content of this paper is organized as follows: Section 2 details the overall architecture of the DCCG framework and the technical details of each module; Section 3 presents experimental results and analysis; Section 4 discusses the limitations of the framework and future research directions, and gives the conclusion.
The DCCG framework proposed in this paper takes the classroom surveillance video stream $I \in \mathrm{R}^{T \times H \times W \times 3}$ as input and outputs the student psychological safety score $P S \in[0,100]$ through three deeply coupled modules, where the single-frame input size is denoted as $H_0=480, W_0=640$. The design of the framework follows a progressive logic from visual parsing to semantic reasoning: Module 1 is responsible for pixel-level semantic segmentation of group behaviors. Through DSADC and a geometric boundary adversarial mechanism, the input image is mapped to a multi-channel probability map $M \in \mathrm{R}^{C_g \times H \times W}$ ($C_g=8$ behavior categories). At the same time, the spatial bounding box $B_i=\left(x_i, y_i, w_i, h_i\right)$ and head pose angles of each student $\Theta_i=\left(\right. yaw _i, pitch_i, roll_i\left.\right)$ are extracted from the segmentation results, providing precise spatial priors and pose constraints for subsequent individual-level analysis. Module 2 uses the $B_i$ and $\Theta_i$ output by Module 1 as guidance to perform pose affine normalization on each student's face region, and then extracts fine-grained expression features through a difference-driven multi-scale disentangled attention mechanism, outputting emotional coordinates $\left(V_i(t), A_i(t)\right)$, where $V_i \in[-1,1]$ is valence and $A_i \in[-1,1]$ is arousal, thus completing the scale descent from group segmentation to individual emotion. Module 3 incorporates the outputs of the first two modules into a graph learning framework, constructing a heterogeneous fully-connected graph $G=(V, \mathrm{E})$ containing group field nodes $V_g$ (corresponding to a $4 \times 4$ spatial grid, totaling 16 nodes) and individual particle nodes $V_i$. Through dual-path cross-attention message passing, bidirectional collaborative inference is achieved between the macroscopic group field and microscopic emotional particles, and finally the psychological safety score is output through a regressor. The three modules are jointly optimized during end-to-end training, and the overall loss function is:
$L_{\text {total}}=L_{\text {seg}}+L_{\text {expr}}+L_{P S}+\eta L_{\text {sparse}}$ (1)
where, $L_{\text {seg}}$ is the group segmentation loss, including Dice loss, Focal loss, and geometric boundary adversarial loss; $L_{\text {expr}}$ is the expression recognition loss, i.e., the mean squared error of valence and arousal and temporal smooth contrastive regularization; $L_{P S}$ is the Huber loss for psychological safety regression, $L_{\text {sparse}}$ is the attention sparse regularization term, and $\eta$ is the balance coefficient. The following sections elaborate on the mathematical mechanisms and engineering implementation details of the three modules in turn.
2.1 Module 1: Group behavior semantic segmentation based on dynamic receptive field decoupling and boundary adversarial learning
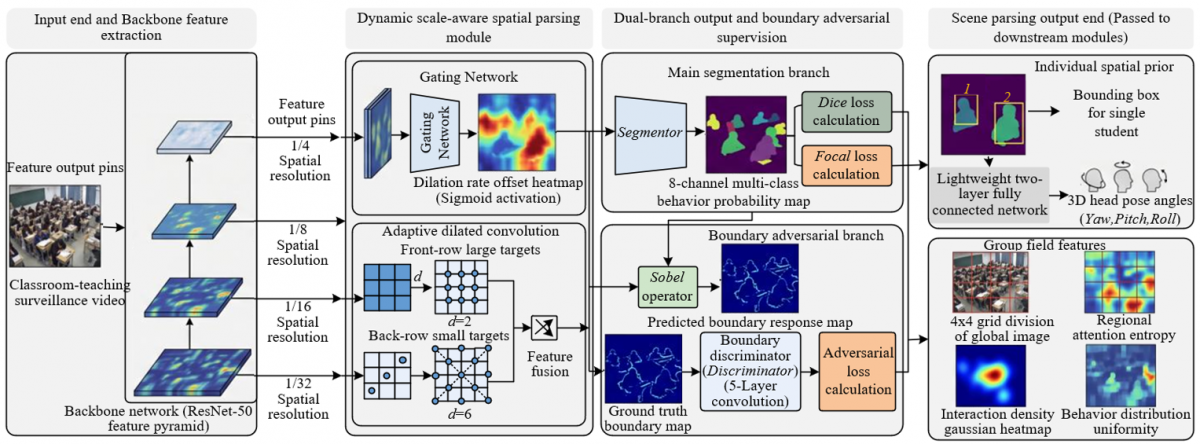
Group behavior semantic segmentation aims to assign behavior category labels to each pixel in classroom scenarios, while providing precise spatial priors for downstream individual analysis. This module adopts ResNet-50 as the backbone network to construct a feature pyramid, extracting four-level semantic features $C_2, C_3, C_4, C_5$, whose spatial resolutions are 1/4, 1/8, 1/16, and 1/32 of the input image, respectively. On top of this backbone structure, the module faces two core challenges: first, the scales of student faces and limbs in the classroom vary drastically from the front row to the back row, and convolution operations with fixed receptive fields are difficult to simultaneously adapt to the feature extraction requirements of distant small targets and proximal large targets; second, boundaries between adjacent students in densely seated scenarios are often blurred due to occlusion, and general segmentation losses struggle to guarantee the geometric coherence of individual masks. To address the above problems, this paper provides solutions from two aspects: dynamic receptive field modulation and boundary adversarial supervision. Figure 1 illustrates the architecture of group behavior semantic segmentation based on dynamic receptive field decoupling and boundary adversarial learning.
Figure 1. Architecture of group behavior semantic segmentation based on dynamic receptive field decoupling and boundary adversarial learning
For DSADC, to address the limitation of fixed dilation rates in traditional dilated convolution, a spatially adaptive mechanism is introduced. Given the input feature map $F \in \mathrm{R}^{C \times H \times W}$, the gating network first generates a dilation rate offset for each spatial position $p$. The network consists of two $1 \times 1$ convolutions and a GELU activation function, and the output is normalized by Sigmoid and then mapped to an integer dilation rate:
$\Delta(p)=\left|\sigma\left(\operatorname{Conv}_{1 \times 1}\left(\operatorname{GELU}\left(\operatorname{Conv}_{1 \times 1}(F(p))\right)\right)\right) \cdot \Delta_{\max}\right|$ (2)
where, F(p) is the feature vector at position p, $\sigma(~)$ is the Sigmoid function, which normalizes the output to the interval [0,1]. Δmax = 6 is the upper limit of the maximum dilation rate, and the rounding operation ensures that the dilation rate is an integer. Since rounding is non-differentiable in backpropagation, this module adopts the Straight-Through Estimator to maintain gradient approximation. The convolution output expression is:
$Y(p)=\sum_{k_x=-1}^{1} \sum_{k_y=-1}^{1} W\left(k_x, k_y\right) \cdot F\left(p_x+\Delta(p) k_x, p_y+\Delta(p) k_y\right)$ (3)
where, $W \in \mathrm{R}^{C_{{out}} \times C \times 3 \times 3}$ is the learnable convolution kernel weight, the convolution kernel size is fixed at $3 \times 3$, while the actual sampling positions are dynamically regulated by $\Delta(p)$, and $C_{{out}}$ is the number of output channels. To suppress feature aliasing caused by sampling point drift, spatial interpolation adopts a bilinear kernel B( ) for weighting:
$F(p+\Delta \cdot k)=\sum_q F(q) \cdot B(q-(p+\Delta \cdot k))$ (4)
where, $q$ traverses all integer coordinate positions on the feature map, $\Delta$ is the shorthand for the dilation rate offset, and B( ) is the bilinear interpolation weight function, whose input is the coordinate offset between the sampling point and the integer grid point. This mechanism enables spatial positions of back-row small targets to obtain larger dilation rates, thereby aggregating a wider range of contextual discriminative signals; front-row large targets maintain smaller dilation rates, preserving local texture details to maintain boundary precision.
Boundary adhesion is the primary quality issue of segmentation results in dense classroom scenarios. This module introduces a boundary discriminator $D_{{edge}}$ to explicitly supervise the geometric boundaries of predicted masks. Its structure consists of five convolutional layers, with channel numbers of 64, 128, 256, 512, and 1 in sequence, each followed by Instance Normalization and LeakyReLU activation. The input to the discriminator is the boundary response map of the predicted mask $B_{{pred}}=\left\|\nabla M_{{pred}}\right\|_2$ and the ground truth boundary map $B_{g t}$, where ∇ is the Sobel operator, and $M_{{pred}}$ is the hard label obtained by applying argmax to the multi-channel probability map output by the segmentation network. The adversarial loss is defined as:
$L_{G B A}=E_{B \sim B_{{gt}}}\left[\log D_{{edge}}(B)\right]+E_{B \sim B_{{pred}}}\left[\log \left(1-D_{{edge}}(B)\right)\right]$ (5)
This loss drives the segmentation network to simultaneously optimize two objectives at the decoder end: semantic classification and boundary geometric consistency. During training, the discriminator adopts R1 gradient penalty to stabilize the adversarial process:
$L_{G P}=\gamma \cdot E_{\widetilde{B} \sim \mathrm{P}_{\widetilde{B}}}\left[\left\|\nabla_{\widetilde{B}} D_{{edge}}(\widetilde{B})\right\|_2^2\right]$ (6)
where, $\widetilde{B}$ is a random interpolation point between the predicted boundary and the ground truth boundary, and $\gamma=10.0$ is the penalty coefficient. This regularization term constrains the gradient norm of the discriminator near the data manifold, thereby avoiding training oscillation.
The segmentation network outputs a multi-channel probability map $M \in \mathrm{R}^{C_g \times H \times W}$, where the number of behavior categories is $C_g=8$. Based on the segmentation results, the module extracts three types of group field features to describe the spatial structure of the collective learning atmosphere. The regional attention entropy $H_{{region}}(r)$ divides the image into a $4 \times 4$ grid, and calculates the normalized entropy value of the pixel proportions of listening and interacting categories for each grid:
$H_{{region}}(r)=-\sum_{c \in\{{listen,interact}\}} p_{r, c} \log p_{r, c}, p_{r, c}=\frac{{count}_{r, c}}{\sum_c {count}_{r, c}}$ (7)
where, $r$ is the grid index, $p_{r, c}$ is the pixel proportion of category $c$ in the $r$-th grid, and $count_{r,c}$ is the pixel count of category $c$ in that grid. This metric reflects the concentration degree of effective participation behaviors in each region. The interaction density field $\rho_{{inter}}$ generates a spatially continuous heatmap by performing Gaussian kernel density estimation on the centroids of pixels of discussion and hand-raising behaviors. The behavior distribution uniformity $U_{{behav}}$ characterizes the balance of pixel proportions of various behaviors from a global perspective:
$U_{{behav}}=1-\frac{1}{N_g} \sum_c\left(\frac{N_c}{N_{\text {total}}}-\frac{1}{C_g}\right)^2$ (8)
where, $N_c$ is the total number of pixels of behavior category $c$, $N_{{total}}$ is the sum of valid pixels, and $C_g=8$ is the total number of behavior categories. Meanwhile, the module performs instance-level parsing on each connected domain in the segmentation results, outputting the individual spatial bounding box $B_i=\left(x_i, y_i, w_i, h_i\right)$, and feeds the segmentation mask into a lightweight pose regression branch to estimate head pose angles $\Theta_i=\left(\right.yaw_i,pitch_i,roll_i\left.\right)$. This branch consists of two fully connected layers and outputs three-dimensional Euler angles. It shares backbone encoder parameters with the segmentation network, thus adding almost no extra computational cost.
The total loss function of this module integrates two objectives: semantic supervision and boundary geometric supervision:
$L_{{seg}}=L_{{Dice}}+\lambda_1 L_{{GBA}}+\lambda_2 L_{{Focal}}+\lambda_{{GP}} L_{{GP}}$ (9)
where, $L_{{Dice}}$ is the Dice loss and $L_{{Focal}}$ is the Focal loss, both jointly responsible for pixel-level semantic classification. $\lambda_1=0.5$ and $\lambda_2=1.0$ are the weight coefficients for the Geometric Boundary Adversarial (GBA) loss and Focal loss, respectively. Through the above design, the segmentation module not only provides high-precision behavior semantic maps, but also outputs necessary spatial priors and pose constraints for subsequent individual expression recognition and cross-scale collaborative inference.
2.2 Module 2: Fine-grained individual expression spatiotemporal recognition based on pose decoupling and difference-driven learning
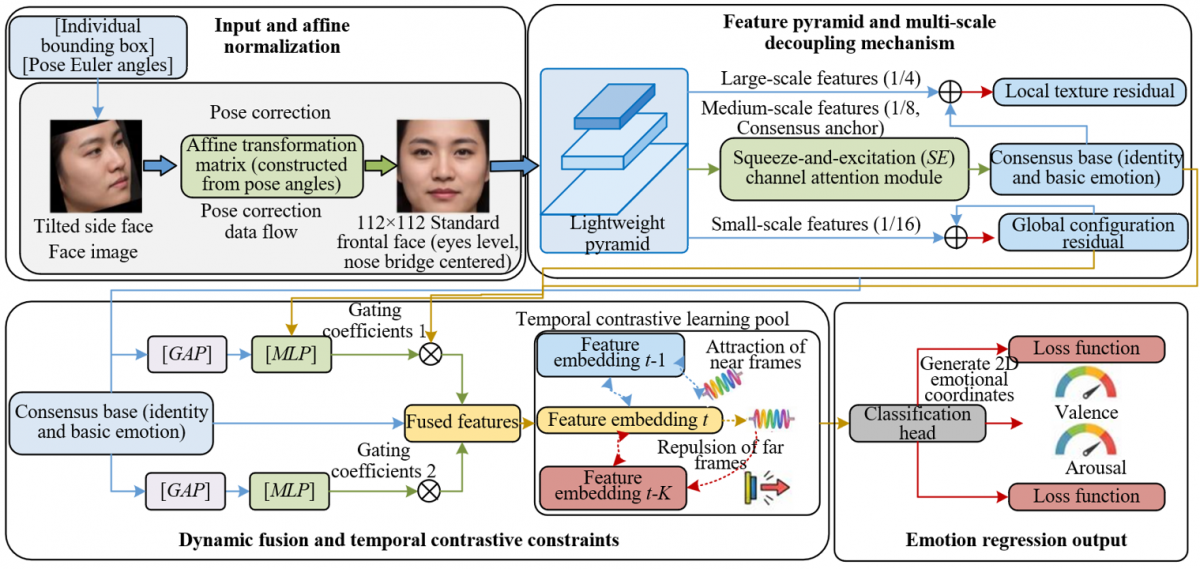
The core difficulty of individual expression recognition lies in the small face scale, drastic pose variations, and frequent occlusions in classroom scenarios. The spatial bounding box $B_i=\left(x_i, y_i, w_i, h_i\right)$ and head pose angles $\Theta_i=\left(\right.yaw_i,pitch_i,roll_i\left.\right)$ output by Module 1 provide precise spatial localization and pose priors for this module, enabling expression feature extraction to focus on amplifying micro-expression residual signals on the basis of pose normalization. The design of this module follows a progressive logic from spatial alignment to feature decoupling and then to temporal constraints: first, pose angles are used to guide affine transformation to eliminate the interference of head deflection on texture encoding; then, common identity-related bases and emotion-related difference residuals are separated in multi-scale feature space; finally, temporal contrastive constraints are applied to utilize the continuity between video frames to suppress abnormal jitter in single-frame predictions. Figure 2 illustrates the architecture of fine-grained expression spatiotemporal recognition based on pose decoupling and difference-driven learning.
Figure 2. Architecture of fine-grained expression spatiotemporal recognition based on pose decoupling and difference-driven learning
For the $i$-th student, the bounding box output $B_i$ by Module 1 crops the face region $R_i \in \mathrm{R}^{3 \times h_i \times w_i}$ from the original image. A rotation matrix $R\left(\Theta_i\right) \in \mathrm{R}^{2 \times 3}$ is constructed based on the head pose angles $\Theta_i$, which affine-transforms the original face image to a standard frontal pose, keeping both eyes horizontal and the bridge of the nose at the facial midline. The transformed face image is uniformly normalized to $112 \times 112$ pixels through grid sampling:
$\widetilde{R}_i={GridSample}\left(R_i, R\left(\Theta_i\right)\right), \widetilde{R}_i \in \mathrm{R}^{3 \times 112 \times 112}$ (10)
where, GridSample is a bilinear interpolation sampling function, and $R\left(\Theta_i\right)$ is composed of a rotation matrix and a translation vector, specifically calculated from the three Euler angles yaw, pitch, and roll. The core function of this spatial normalization operation is to completely strip pose variations from the mapping relationship that the network needs to learn, so that the entire parameter capacity of the subsequent feature extraction network can be used to encode texture details related to emotion, without additionally allocating parameters to cope with pose diversity. This strategy is particularly critical in classroom small-scale face scenarios: when the facial region only occupies $32 \times 32$ pixels, any parameter overhead for pose robustness will significantly weaken the model's sensitivity to subtle expression changes.
The pose-normalized face image $\widetilde{R}_i$ is fed into a lightweight feature pyramid to extract multi-scale representations. This pyramid reuses the low-level parameters of the backbone network of Module 1, but blocks the backpropagation of gradients from the segmentation task during training to avoid interference from the segmentation objective on expression features. The pyramid outputs feature maps at three scales: $F_1 \in \mathrm{R}^{256 \times 28 \times 28}$ corresponds to $1 / 4$ scale of the input image, $F_2 \in \mathrm{R}^{512 \times 14 \times 14}$ corresponds to $1 / 8$ scale, and $F_3 \in \mathrm{R}^{1024 \times 7 \times 7}$ corresponds to 1/16 scale. This paper takes $F_2$ at 1/8 scale as the consensus anchor $F_m$, which achieves the best balance between receptive field and spatial resolution, and is suitable for carrying the identity information of the face and the common base of basic expressions. The consensus feature $F_{{base}}$ is obtained by feeding $F_m$ into a channel attention module, which adopts the Squeeze-and-Excitation structure to recalibrate the channel dimension and strengthen the common response patterns that are discriminative for expression classification.
Difference feature extraction is a key link in distinguishing fine-grained emotional changes. For the large-scale branch $F_1$ and the small-scale branch $F_3$, the feature difference between each and the consensus anchor is calculated respectively. Since the number of channels at each scale is inconsistent, they are first uniformly mapped to 512 dimensions through $1 \times 1$ convolution, and then element-wise subtraction is performed:
$F_{{diff,} s}=\phi_s\left(F_s\right)^{\ominus} \psi_s\left(F_m\right), s \in\{1,3\}$ (11)
where, $\phi_s$ and $\psi_s$ are both $1 \times 1$ convolutional layers, $\ominus$ denotes element-wise subtraction, and s is the scale index. The essence of this difference operation is to filter out the identity information shared with the consensus base at each scale, and retain the residual signals inconsistent with the consensus, which exactly correspond to the subtle deformations in micro-expressions involving areas such as the corners of the mouth, the corners of the eyes, and the brow ridge. However, not all difference features at all scales are beneficial for emotion classification; differences at some scales may originate from residual errors of illumination or pose normalization. To this end, a dynamic gating mechanism is introduced to adaptively evaluate the importance of difference features through global average pooling and a two-layer Multilayer Perceptron (MLP):
$g_s=\sigma\left(M L P\left(A v g P o o l\left(F_{\text {diff,}s}\right)\right)\right) \in[0,1]^{512}$ (12)
where, AvgPool is the global average pooling operation, which compresses the spatial dimension to $1 \times 1$. The MLP structure is $512 \rightarrow 128 \rightarrow 512$, with the ReLU activation in the middle layer, and $\sigma$ is the Sigmoid function that restricts the output to $[0,1]$. Each dimension of the gating coefficient $g_s$ corresponds to a channel of the difference feature, controlling the contribution ratio of that channel in the final fusion. The final fused feature is expressed as:
$F_{\text {expr}}=F_{\text {base}}+g_1 \odot F_{\text {diff}, 1}+g_3 \odot F_{\text {diff}, 3} \in \mathrm{R}^{512}$ (13)
where, ⊙ is the Hadamard product. This fusion strategy allows the model to selectively inject differentiated emotional residuals from different scales while preserving the consensus base. Large-scale differences are responsible for capturing local texture changes, and small-scale differences are responsible for encoding global configuration shifts, and the two complement each other under the gating mechanism.
The emotional states of adjacent frames in classroom surveillance video should maintain temporal continuity, while frames separated by a farther distance should have distinguishable representations. To utilize this temporal redundancy to improve the noise resistance of single-frame recognition, this paper applies temporal smooth contrastive constraints in the feature embedding space. Let the fused feature of the t-th frame be mapped to a 128-dimensional embedding vector $z_t=\operatorname{Projector}\left(F_{\text {expr}, t}\right)$ through a projection head, which consists of a two-layer MLP. The temporal contrastive loss is defined as:
$L_{T S C}=\frac{1}{T-1} \sum_{t=1}^{T-1} \max \left(0,\left\|z_t-z_{t+1}\right\|_2^2-\left\|z_t-z_{t+K}\right\|_2^2+\delta\right)$ (14)
where, $T$ is the total number of frames in the video clip, $K=5$ is the far-frame interval, $\delta=0.5$ is the margin hyperparameter, and $\|$ $\|_2^2$ is the square of the Euclidean distance. The physical meaning of this loss function is clear: if the distance between adjacent frame features in Euclidean space minus the distance between features separated by frames plus the margin is still greater than zero, a positive loss is generated, driving the model to pull adjacent frames closer and push far frames apart; otherwise, no gradient update is produced. This design does not rely on any label information, and the supervisory signal is purely provided by the temporal structure of the video data itself. Finally, $F_{\text {expr}}$ passes through a classification head $512 \rightarrow 256 \rightarrow 2$ to output the two-dimensional emotional coordinates of the current frame $\left(V_i(t), A_i(t)\right)$, where $V_i \in[-1,1]$ is valence and $A_i \in[-1,1]$ is arousal. The total loss of the module is:
$L_{\text {expr}}=L_V+L_A+\lambda_3 L_{T S C}$ (15)
where, $L_V$ and $L_A$ are both mean squared error losses, supervising the regression of valence and arousal respectively, and $\lambda_3=0.1$ is the weight coefficient of the temporal contrastive loss.
2.3 Module 3: Psychological safety mapping based on cross-scale graph neural collaborative inference
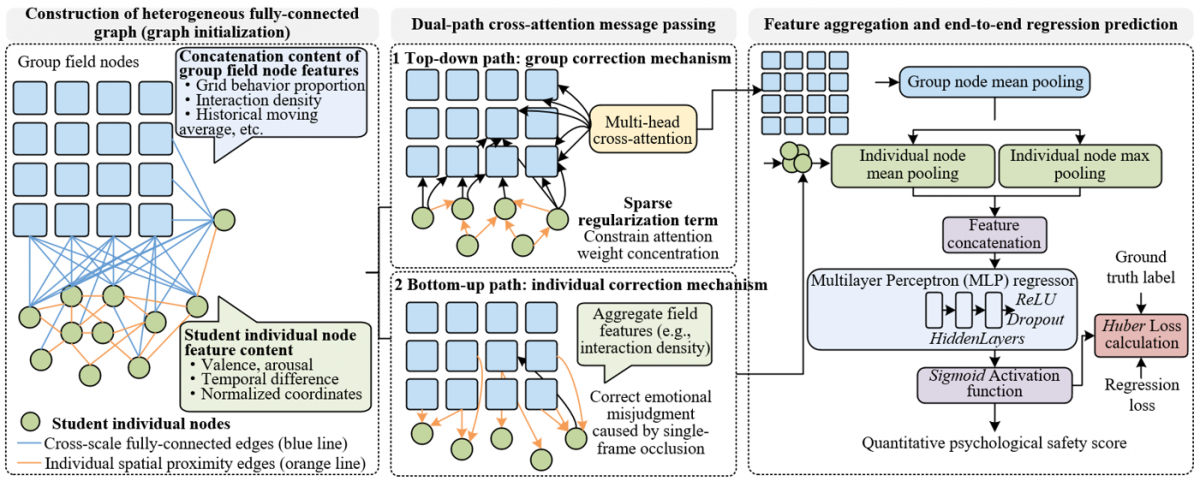
The first two modules respectively complete the pixel-level parsing of group behaviors and the fine-grained extraction of individual expressions. However, in existing classroom analysis systems, these two are often treated as independent processing pathways. The semantic gap between them causes the quantification of the collective learning atmosphere to lack the support of individual emotional states, while the inference of psychological safety lacks the constraint of group field information. This module aims to establish a bidirectional collaborative inference mechanism between the group field and individual emotional particles, unifying macroscopic spatial distribution features and microscopic emotional temporal signals into a graph learning framework for joint inference, thereby completing the final mapping from visual appearance to psychological safety scores. Figure 3 illustrates the principle of dual-path cross-scale graph neural collaborative inference and psychological safety mapping.
Figure 3. Dual-path cross-scale graph neural collaborative inference and psychological safety mapping
The construction of the heterogeneous fully-connected graph is the foundation of cross-scale collaborative inference. Let the graph be $G=(V, \mathrm{E})$, the node set $V=V_g \cup V_i$ contains two types of nodes. There are 16 group nodes $V_g$, corresponding to the $4 \times 4$ grid divided in the image space. The initial feature $h^{(r)}{ }_g \in \mathrm{R}^{16}$ of the $r$-th node is formed by concatenating five parts: the pixel proportion distribution of 8 behavior categories within the grid, the regional attention entropy $H_{\text {region}}(r)$, the interaction density $\rho_{\text {inter}}(r)$, the global behavior uniformity $U_{\text {behav}}$, and the historical moving average of the first 4 frames. The number $N$ of individual node $V_i$ dynamically changes with the number of students detected in the scene. The initial feature $h_{i \nu}^{(i)} \in \mathrm{R}^{14}$ of the $i$-th node includes the current frame's emotional valence $V_i(t)$ and arousal $A_i(t)$, the temporal differences $\Delta V_i$ and $\Delta A_i$ of the first 5 frames ( 5 dimensions each), and the normalized spatial coordinates $\left(x_i / H_0, y_i / W_0\right)$, where $H_0=480$ and $W_0=640$ are the height and width of the input image. The edge set E contains two types of connections: fully-connected edges between group nodes and individual nodes, realizing the cross-scale information pathway; and spatial proximity edges between individual nodes, connecting only individual pairs whose Euclidean distance is less than $15 \%$ of the image width, used to characterize local peer effects. Connections are not established between group nodes to prevent macroscopic features from over-smoothing across the grid and losing spatial heterogeneity.
Message passing on the graph adopts a dual-path cross-attention mechanism to establish bidirectional interaction between the group field and individual particles. In the top-down path, group nodes aggregate the emotional and spatial information of individual nodes to revise the understanding of the group field. For each group node r, the attention weight with all individual nodes is calculated as:
$\alpha_{r t \leftarrow i}=\operatorname{softmax}\left(\frac{\left(W_Q h_g^{(r)}\right)^{\top}\left(W_K h_i^{(i)}\right)}{\sqrt{d_k}}\right)$ (16)
where, $W_Q, W_K \in \mathrm{R}^{d_k \times d}$ are the projection matrices for the query and key, $d=128$ is the hidden dimension of node features, $d_k=128$ is the projection dimension for query and key, and the number of heads for multi-head attention is set to 4. $\alpha_{r \leftarrow i}$ is the normalized attention weight of the $r$-th group node for the $i$-th individual node, and softmax is calculated along the individual dimension. Subsequently, the group node updates its representation via a residual connection:
$h_g^{(r)} \leftarrow h_g^{(r)}+\operatorname{MLP}\left(\sum_i \alpha_{k \leftarrow i} \cdot\left(W_V h_i^{(i)}\right)\right)$ (17)
where, $W_V \in \mathrm{R}^{d_v \times d}$ is the projection matrix for the value, $d_v=128$, and MLP is a two-layer fully connected network with a hidden layer dimension of 256 . This path enables each spatial grid to dynamically adjust its representation of the group atmosphere based on the emotional states of the students within it. The bottom-up path executes the opposite direction of information flow, where individual nodes aggregate the field features of all group nodes to correct their own emotional representation:
$\beta_{i \leftarrow r}=\operatorname{softmax}\left(\frac{\left(W^{'}_Q h_i^{(i)}\right)^{\top}\left(W^{'}_K h_g^{(r)}\right)}{\sqrt{d_k}}\right), h_i^{(i)} \leftarrow h_i^{(i)}+M L P\left(\sum_r \beta_{i \leftarrow r} \cdot\left(W^{'}_V h_g^{(r)}\right)\right)$ (18)
where, $W^{'}_Q, W^{'}_K, W^{'}_V$ are independently learned projection matrices for the bottom-up path, and $\beta_{i \leftarrow r}$ is the normalized attention weight of the i-th individual node for the r-th group node. The physical meaning of this path is that when a student is in a high-interaction-density area, their own low-arousal state may be corrected by the group field information, thereby avoiding emotional misjudgment caused by single-frame occlusion or pose deflection. The two paths each execute two rounds of iterative updates, and all nodes are updated synchronously after each round.
After two rounds of message passing, the node features have fully integrated cross-scale collaborative information. Average pooling and max pooling are applied to the updated features of all individual nodes to extract the central tendency and extreme responses of the individual set, respectively; average pooling is applied to the group node features to obtain the global field summary. The three are concatenated to form the collaborative fusion feature:
$F_{{collab}}=Concat\left(\begin{array}{l}{AvgPool}\left(\left\{h_i^{(i)}\right\}\right), \\ \underline{{MaxPool}\left(\left\{h_{i}^{(i)}\right\}\right),} \\ {AvgPool}\left(\left\{h_g^{(r)}\right\}\right)\end{array}\right) \in \mathrm{R}^{272}$ (19)
where, $AvgPool\left(\left\{h_{i}^{(i)}\right\}\right)\in\mathrm{R}^{128}$ is the mean vector of individual node features, ${MaxPool}\left(\left\{h_i^{(i)}\right\}\right) \in \mathrm{R}^{128}$ is the element-wise maximum value, and $AvgPool\left(\left\{h_{i}^{(i)}\right\}\right)\in\mathrm{R}^{16}$ is the mean vector of group node features. $F_{{collab}}$ is mapped to a scalar via the regressor $M L P_{{reg}}$, whose structure is $272 \rightarrow 128 \rightarrow 64 \rightarrow 1$, with a Dropout rate of 0.3 and ReLU activation inserted between layers. The output is normalized by Sigmoid and scaled to the [0,100] interval:
$\widehat{P S}=\operatorname{sigmoid}\left(M L P_{{reg}}\left(F_{{collab}}\right)\right) \times 100$ (20)
The training supervision signal is the measured score from the Edmondson scale $P S_{{label}}$. The Huber loss is adopted to balance the accuracy of the squared error and the robustness of the absolute error to outliers:
$L_{P S}(y, \hat{y})=\left\{\begin{array}{c}\frac{1}{2}(y-\hat{y})^2,|y-\hat{y}| \leq \delta \\ \delta|y-\hat{y}|-\frac{1}{2} \delta^2, {otherwise}\end{array}\right.$ (21)
where, $y$ is the measured scale score $P S_{{label}}, \hat{y}$ is the model prediction $\widehat{P S}$, and $\delta=5.0$ is the threshold parameter of the Huber loss, controlling the division point between squared loss and linear loss. To further enhance the interpretability of model decisions, this paper applies sparse regularization to the attention weights, constraining the cross-scale attention distribution in the top-down path to deviate from a uniform distribution $\alpha_{i \leftarrow r}:$
$L_{{sparse}}=\sum_r K L\left(\alpha_{r \leftarrow} . \|\right. Uniform)=\sum_r \sum_i \alpha_{r\leftarrow i} \log \left(N \cdot \alpha_{r \leftarrow i}\right)$ (22)
where, ${{K L( } \|})$ is the Kullback-Leibler divergence, Uniform is the uniform distribution with value 1/N, N is the total number of individual nodes, and r traverses the 16 group nodes. This regularization term encourages the attention of each group node to focus on a few key individuals, making the prediction of psychological safety traceable to specific spatial regions and student groups.
The DCCG framework adopts end-to-end joint training. The overall loss function is:
$L_{{total}}=L_{{seg}}+L_{{expr}}+L_{P S}+\eta L_{{sparse}}$ (23)
where, $L_{{seg}}$ is the segmentation loss of Module $1, L_{{expr}}$ is the expression recognition loss of Module 2, $L_{P S}$ is the Huber loss for psychological safety regression, and $\eta=0.01$ is the weight coefficient of the sparse regularization term. The training uses the AdamW optimizer, with an initial learning rate set to $1 \times 10^{-4}$, a weight decay of $5 \times 10^{-4}$, and a batch size of 8 . Since the loss functions of the three modules share the computation graph during backpropagation, the gradient information is naturally coupled, eliminating the need to design additional strategies to balance the convergence speed of each module. Through the above design, Module 3 completes the complete inference chain from heterogeneous information fusion of the group field and individual emotional particles to quantitative regression of psychological safety.
3.1 End-to-end comprehensive performance comparison
The DCCG is compared end-to-end with four baseline methods on the CPS-Dataset test set, covering three subtasks and overall inference speed. The results are shown in Table 1. DCCG achieves 87.6% mean Intersection-over-Union (mIoU) in group behavior segmentation, which is 6.2 percentage points higher than the optimal baseline SCB-DETR. This is mainly attributed to the adaptability of the DSADC to multi-scale targets and the decomposition effect of the geometric boundary adversarial loss on adhesive instances. In the expression recognition task, the accuracy of DCCG is 89.1%, and the weighted average recall is 87.5%, exceeding the Multi-Scale Dynamic Mamba (MSDM) baseline by 5.4% and 6.5% respectively. The gain comes from the fact that pose-guided affine normalization eliminates head rotation interference, and the difference-driven multi-scale attention mechanism effectively amplifies micro-expression residual signals. In terms of psychological safety prediction, the Mean Absolute Error (MAE) of DCCG is 2.91, and the Pearson correlation coefficient reaches 0.86, showing a strong correlation with the actual scale scores. Compared with the Multi-Cue fusion framework, the MAE is reduced by 50.1%, indicating that cross-scale graph collaborative inference successfully establishes a mapping path from visual appearance to deep psychological states. In terms of inference speed, DCCG reaches 26 Frames Per Second (FPS), which is close to real-time processing requirements, and is significantly improved compared to 17 FPS of SCB-DETR, which is attributed to the lightweight DSADC design, whose parameter amount is reduced by 57% compared to the standard Transformer decoder.
Table 1. End-to-end comprehensive performance comparison
|
Method |
Segmentation mIoU (%) |
Expression Acc (%) |
Expression WAR (%) |
PS Prediction MAE ↓ |
PS Prediction RMSE ↓ |
PS Prediction rr ↑ |
Inference FPS |
|
YOLOv9+DeepFace |
72.3 |
74.5 |
71.2 |
8.74 |
10.52 |
0.42 |
28 |
|
Swin-T+ResNet50 |
78.1 |
79.2 |
76.8 |
6.93 |
8.36 |
0.58 |
19 |
|
SCB-DETR+MSDM |
81.4 |
83.7 |
81 |
5.16 |
6.74 |
0.69 |
17 |
|
Multi-Cue Fusion |
79.6 |
81.5 |
79.3 |
5.83 |
7.21 |
0.63 |
22 |
|
DCCG(Proposed) |
87.6 |
89.1 |
87.5 |
2.91 |
3.85 |
0.86 |
26 |
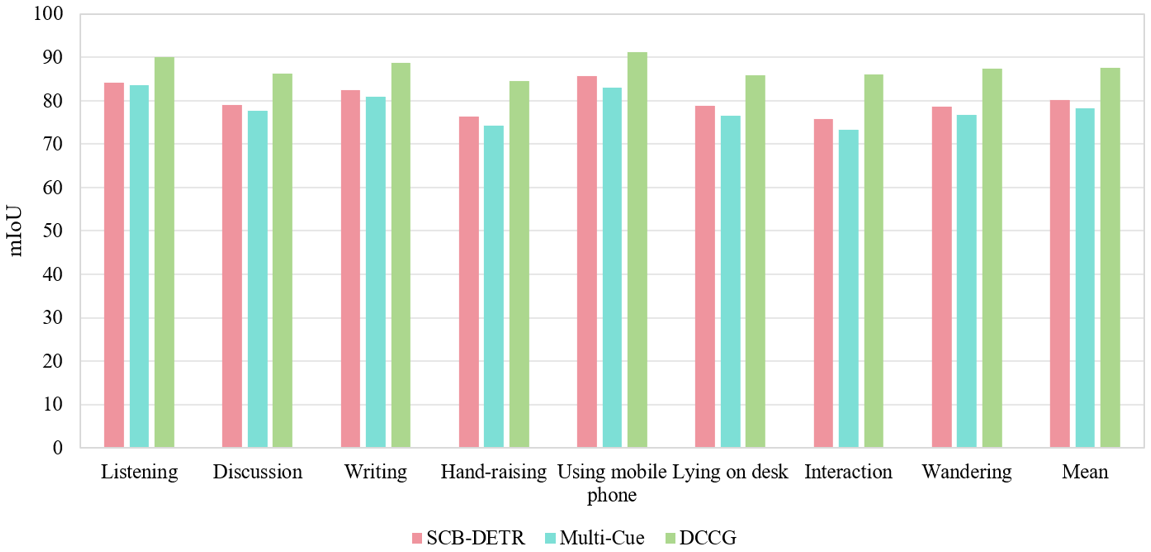
Figure 4 shows the detailed mIoU of each category and compares with the two optimal baselines. DCCG achieves 84.5% and 86.1% in the two behaviors of "hand raising" and "interaction", which are 8.2 and 10.3 percentage points higher than SCB-DETR respectively. These two types of behaviors are often accompanied by severe occlusion in the classroom: the arm overlaps with the body when raising hands, and multiple students are close to each other during interaction. DSADC aggregates the surrounding context at a large dilation rate to infer the attribution of occluded parts, and the boundary adversarial loss accurately decomposes the adhesive edges. The two categories of "wandering" and "lying on the table" are mostly distributed in the small target area in the back row. Traditional methods frequently miss detection due to insufficient feature resolution. The dynamic receptive field mechanism of DCCG ensures effective activation of long-distance areas, and the mIoU reaches 87.4% and 85.9% respectively, verifying the superiority of this method in multi-scale scenarios.
3.2 Cross-scenario generalization capability
To test the robustness of the framework in different classroom environments, the test subset is divided according to three dimensions: classroom size, lighting conditions, and course type. The results are shown in Table 2. When the classroom size increases from 30 to 100 people, the segmentation mIoU of DCCG only drops by 4.7 percentage points (88.9% → 84.2%), while SCB-DETR drops by 6.7 percentage points, indicating that the dynamic multi-scale receptive field has stronger adaptability to the scale dispersion problem in large scenes. The PS predicted MAE increases from 2.52 to 3.87, and the increase is controllable. Under dim lighting, the performance of all methods decreases, but the mIoU of DCCG (83.5%) is still higher than the performance of SCB-DETR under uniform lighting (82.0%), indicating that the boundary adversarial loss has a significant effect on mining edge cues in low-contrast environments. Experimental operation-type courses involve students frequently walking and bending over, which is the most challenging scenario. The MAE of DCCG is 3.45, which is far better than the 6.67 of Multi-Cue, proving that the dynamic individual-group edges in the graph network have good adaptation advantages for high-dynamic scenarios.
Table 2. Cross-scenario generalization performance comparison
|
Scenario Dimension |
Subset |
DCCG mIoU / MAE |
SCB-DETR+MSDM mIoU / MAE |
Multi-Cue mIoU / MAE |
|
Classroom Size |
Small (30 people) |
88.9 / 2.52 |
82.3 / 4.98 |
80.1 / 5.64 |
|
Medium (60 people) |
87.6 / 2.91 |
81.4 / 5.16 |
79.6 / 5.83 |
|
|
Large (100 people) |
84.2 / 3.87 |
75.6 / 6.52 |
74.2 / 6.98 |
|
|
Lighting Condition |
Uniform Lighting |
88.1 / 2.73 |
82.0 / 5.02 |
80.3 / 5.71 |
|
Side/Backlight |
86.3 / 3.24 |
79.4 / 5.83 |
77.8 / 6.25 |
|
|
Dim Lighting |
83.5 / 3.71 |
74.8 / 6.91 |
72.5 / 7.42 |
|
|
Course Type |
Lecture |
88.3 / 2.68 |
82.5 / 4.87 |
80.8 / 5.52 |
|
Discussion |
87.1 / 3.02 |
80.2 / 5.43 |
78.4 / 6.01 |
|
|
Experiment Operation |
85.9 / 3.45 |
79.0 / 5.98 |
76.9 / 6.67 |
3.3 Occlusion robustness and cascade error propagation
This experiment simulates four types of occlusion, divided into four levels according to the area proportion: no occlusion, mild, moderate, and severe. The end-to-end Psychological Safety (PS) prediction MAE under three conditions is examined, and the error propagation coefficient is defined. The results are shown in Table 3. Under mild occlusion, the full cascade MAE is 4.02, which is less than the simple cumulative value of Condition (1) and Condition (2) (4.22), indicating that the bottom-up path in the dual-path graph network can correct individual features with the help of group field context when there are slight errors in segmentation, producing an error suppression effect. Under moderate occlusion, the full cascade MAE is 5.49, $\kappa$ = 0.887, which is close to linear accumulation, and the collaborative correction ability weakens as occlusion increases. Under severe occlusion, $\kappa$ = 1.718 shows superlinear growth, and the MAE soars to 7.91, and the error is significantly amplified between modules. It is worth noting that the MAE of Condition (2) (7.64) is higher than that of Condition (1) (5.89), indicating that the damage of segmentation error to psychological safety prediction is greater than that of expression feature noise of the same degree. This verifies that the accuracy of group field information plays a skeleton support role in the entire framework. This result provides a quantitative basis for prioritizing the robustness of the segmentation module in actual deployment.
Table 3. Cascade performance and error propagation coefficient under different occlusion degrees
|
Occlusion Degree |
Condition (1) Expression Only |
Condition (2) Segmentation Only |
Condition (3) Full Cascade |
κ Full Cascade |
|
No Occlusion |
MAE = 2.91 |
MAE = 2.91 |
MAE = 2.91 |
— |
|
Mild (30%) |
MAE = 3.28 |
MAE = 3.85 |
MAE = 4.02 |
0.381 |
|
Moderate (50%) |
MAE = 4.15 |
MAE = 5.23 |
MAE = 5.49 |
0.887 |
|
Severe (70%) |
MAE = 5.89 |
MAE = 7.64 |
MAE = 7.91 |
1.718 |
3.4 Ablation study
By gradually removing core components from the complete framework, the independent contribution of each module is quantified. The results are shown in Table 4. From the baseline to variant (b), the DSADC single module increases the segmentation mIoU by 7.3 percentage points, confirming the necessity of the dynamic receptive field for multi-scale classroom scenarios. After adding $L_{\text {GBA}}$ in variant (c), the segmentation mIoU increases by another 6.1 percentage points to $87.6 \%$, reaching the full segmentation accuracy, but the expression accuracy at this time is only 78.4\%, indicating that although the fine segmentation mask provides high-quality input for individual cropping, the expression capability of the expression network itself is still the bottleneck. After adding Difference-Driven Multi-scale Decoupled Attention (DD-MDA) in variant (d), the expression accuracy jumps by 6.8 percentage points to 85.2\%, and the MAE drops from 5.92 to 4.78, a decrease of $19.3 \%$, verifying the decisive role of the consensus-difference decoupling mechanism for small-size micro-expression recognition in classrooms. After removing the temporal smooth regularization $L_{\text {TSC}}$ (variant e), the expression accuracy drops to 82.6\%, and the MAE rises to 4.13, indicating that although the temporal consistency constraint is not the main reason for accuracy improvement, it is still indispensable for suppressing single-frame abnormal emotional jitter. After replacing the graph network with simple feature concatenation in variant (f), the PS prediction MAE rises from 2.91 to 4.85, an increase of up to 66.7\%, indicating that cross-scale collaborative inference is not a simple feature stacking, but establishes a deep interaction relationship between groups and individuals through dual-path message passing. The total parameter amount of the complete model is 78.3M, which is lightweight among contemporary image processing models and convenient for actual deployment.
Table 4. Performance comparison of ablation study variants
|
Variant |
Segmentation mIoU (%) |
Expression Acc (%) |
PS Predicted MAE ↓ |
Parameter Amount (M) |
|
(a)Baseline |
74.2 |
73.8 |
8.62 |
62.4 |
|
(b)+DSADC |
81.5 (+7.3) |
76.1 |
7.05 |
68.7 |
|
(c)+DSADC+LGBA |
87.6 (+13.4) |
78.4 |
5.92 |
72.1 |
|
(d)+c+DD-MDA |
87.3 |
85.2 (+11.4) |
4.78 |
75.6 |
|
(e)+d−LTSC |
87.5 |
82.6 |
4.13 |
75.6 |
|
(f)+d− Graph Network (Concatenation) |
87.4 |
85 |
4.85 |
73.8 |
|
(g)Full DCCG |
87.6 |
89.1 |
2.91 |
78.3 |
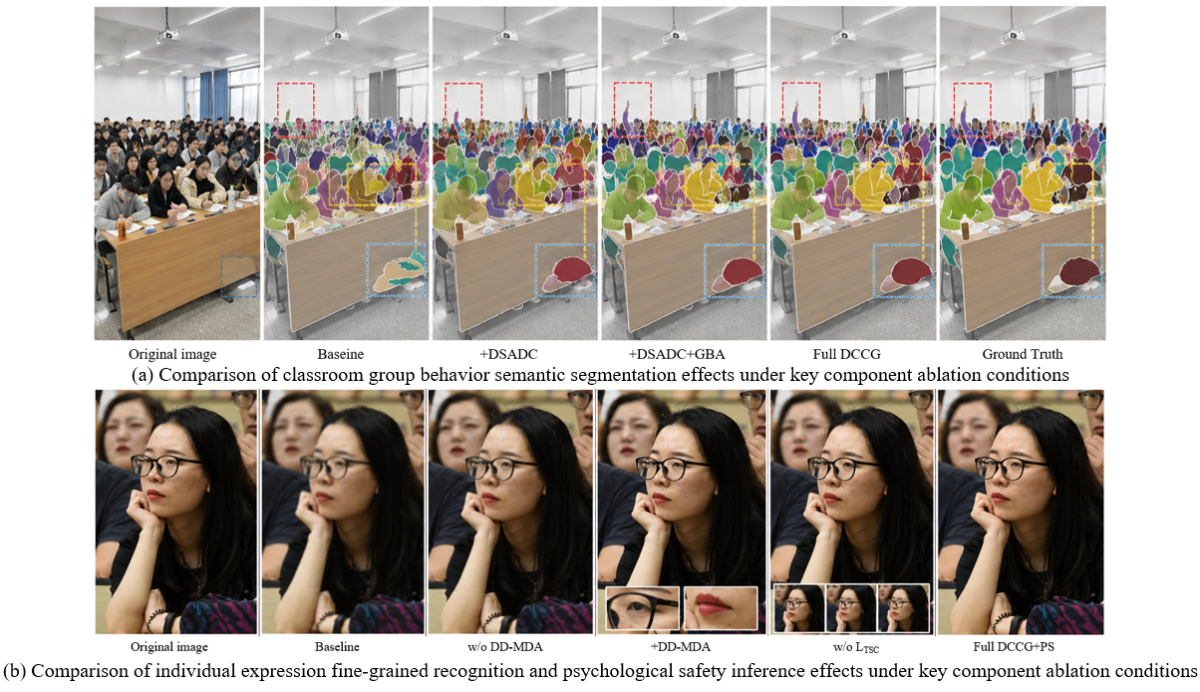
To intuitively verify the actual contribution of each key component to classroom visual parsing performance and psychological safety inference reliability, this paper further compares the implementation effects of typical classroom samples under ablation conditions. Figure 5(a) shows that the Baseline still has obvious problems in complex classroom scenarios, such as missed segmentation of small targets in the back row, boundary adhesion in densely discussed areas, and missing local behavior structures like hand-raising and head-lowering. This indicates that fixed-scale feature extraction struggles to simultaneously handle long-distance small-scale targets and dense interaction areas. After introducing DSADC, the number of recovered back-row students significantly increases, small-scale individual segmentation becomes more complete, and the arm contours of hand-raising students also show better continuity, demonstrating that dynamic scale awareness can effectively enhance behavior representation capabilities at different spatial scales. With the further addition of GBA, the boundaries of adjacent students in dense areas are significantly separated, individual contours become clearer, and overall segmentation accuracy is further improved. The complete DCCG is closest to the Ground Truth in terms of small target completeness, boundary continuity, and consistency of various behavior regions, indicating that dynamic receptive field modeling and boundary geometric constraints have significant complementary effects. Figure 5(b) further reveals the contribution of the fine-grained expression recognition module. The Baseline's estimates for the target student's valence and arousal are only 0.18 and 0.26, showing limited ability to distinguish weak expression states. When DD-MDA is removed, the two estimates increase to 0.31 and 0.41, respectively, but still struggle to fully represent subtle local changes around the eyes and mouth corners. After introducing DD-MDA, the valence and arousal increase to 0.52 and 0.63, respectively, and the expression state shifts from weak discrimination to a clearer positive response, indicating that consensus and difference feature decoupling can effectively amplify fine-grained emotional cues in small-scale classroom faces. In contrast, although removing does not completely disrupt single-frame expression recognition, the valence and arousal fluctuations in consecutive frames significantly increase, showing strong temporal instability, verifying the necessity of temporal smooth constraints in suppressing transient noise and abnormal emotional jitter. The complete DCCG finally obtains a valence of 0.63 and an arousal of 0.71, and outputs a psychological safety prediction result of 74.3 points, forming a consistent response relationship among visual representation completeness, individual emotional stability, and psychological state inference. Combined with the 89.1% expression recognition accuracy and 2.91 psychological safety prediction MAE of the complete model in Table 4, it can be seen that the performance improvement does not stem from a single visual module, but is driven by the joint effect of group behavior spatial parsing, individual fine-grained emotional encoding, and temporal and cross-scale collaborative inference. The above results indicate that accurately restoring the classroom group behavior structure can provide reliable spatial priors for individual emotion recognition, while stable fine-grained emotional signals can further enhance the mapping ability between collective learning atmosphere and student psychological safety, thereby providing an effective technical basis for objective quantitative analysis of psychological safety based on natural classroom visual data.
3.5 Counterfactual reasoning and interpretability analysis
A digital student engine was used to generate three sets of counterfactual virtual classroom videos. Under the premise of strictly maintaining the consistency of individual identities, expression distributions, and lighting conditions, only the group interaction intensity was changed to examine the causal sensitivity of the DCCG-predicted psychological safety scores. Table 5 shows that when the interaction density increases from 0.12 to 0.62, the predicted average PS increases from 41.7 to 78.1, an increase of 36.4 points, and the standard deviation narrows from 5.2 to 3.9. This monotonic increasing trend is highly consistent with classic educational psychology theories, and the predicted PS is approximately linearly positively correlated with interaction density ($R^2 \approx 0.94$). This indicates that the top-down path of the cross-scale graph network successfully captures the shaping effect of the group behavior field on individual psychological states, rather than simply relying on individual expression features for spurious correlation prediction.
Table 5. Counterfactual reasoning: Psychological safety prediction under different interaction intensities
|
Interaction Intensity Level |
Simulated Interaction Density |
DCCG-Predicted PS Mean |
Standard Deviation |
Directional Consistency |
|
Low Interaction |
0.12 ± 0.03 |
41.7 |
5.2 |
— |
|
Medium Interaction |
0.36 ± 0.04 |
62.3 |
4.8 |
+20.6 (↑) |
|
High Interaction |
0.62 ± 0.05 |
78.1 |
3.9 |
+36.4 (↑) |
Table 6 shows the attention weight distribution of five test samples (extracted after sparsification by $L_{{sparse}}$). In sample 012, the model concentrated 31.2% of its attention on highly aroused and highly engaged students in the first two rows of the classroom center, matching the true safety level of 72. In samples 045 and 103, the model focused on a low-valence, wandering individual in the middle row of the left edge (28.7%) and a table-lying, occluded individual in the back right corner (33.5%), with corresponding predicted PS values of only 56.7 and 41.2. This indicates that the model correctly identifies marginal low-engagement areas as risk zones for psychological safety. In sample 078, the entire central area of the classroom was active, the attention distribution was more dispersed (maximum weight 25.4%), and the PS prediction was as high as 83.9, indicating that the sparse regularization automatically relaxes constraints in an overall positive scenario. Overall, the attention distribution qualitatively aligns with the teacher expectancy effect and the marginalization exclusion hypothesis, enhancing educators' trust in model decisions.
Table 6. Interpretable attention weights Top-5 samples
|
Sample ID |
True PS |
Predicted PS |
Top1 Focus Area |
Top1 Individual Features |
Weight % |
|
#012 |
72 |
74.3 |
Front 2 rows, classroom center |
High arousal + High interaction |
31.20% |
|
#045 |
58 |
56.7 |
Left edge, mid-row |
Low valence + High-frequency wandering |
28.70% |
|
#078 |
85 |
83.9 |
Full center area, classroom |
Multi-student high arousal + discussion |
25.40% |
|
#103 |
39 |
41.2 |
Back right corner |
Lying on desk + Head-down occlusion |
33.50% |
|
#129 |
66 |
65.1 |
Front area near teacher |
Focused gaze + Note writing |
29.80% |
This paper proposes the DCCG framework, which achieves end-to-end quantitative mapping from classroom surveillance video to student psychological safety scores through three deeply coupled modules: pixel-level semantic segmentation of group behaviors, fine-grained spatiotemporal recognition of individual expressions, and cross-scale graph collaborative inference. In the systematic verification of five experimental groups, the DCCG framework demonstrates excellent comprehensive performance. In the end-to-end comparison, the segmentation mIoU reaches 87.6%, the expression recognition accuracy is 89.1%, the MAE of psychological safety prediction is 2.91, and the Pearson correlation coefficient reaches 0.86, comprehensively surpassing four representative baseline methods. Cross-scenario generalization tests show that the MAE remains within 3.87 when the classroom size expands from 30 to 100 people, and the MAE is 3.71 under dim lighting conditions, verifying the robustness of the framework in different environments. The occlusion robustness simulation quantitatively reveals the three-stage evolution pattern of cascade error propagation from suppression to linearity and then to superlinearity, providing a quantitative basis for the allocation of module priorities in actual deployment. The ablation study further confirms that DSADC and boundary adversarial loss contribute 7.3 and 6.1 percentage points to segmentation accuracy improvement, respectively, while removing the graph network results in a 66.7% increase in MAE, fully demonstrating the structural value of cross-scale collaborative inference. Counterfactual reasoning results prove that the collaborative features extracted by the framework possess causal sensitivity: when interaction density increases from 0.12 to 0.62, the average psychological safety prediction increases from 41.7 to 78.1, and the attention distribution qualitatively aligns with educational psychology priors, ensuring the model's interpretability.
At the theoretical level, this paper breaks through the paradigm limitation of existing classroom analysis systems that treat group behavior and individual expressions separately. It establishes a new visual inference chain from the group behavior field through individual emotional particles to psychological safety, providing a computable verification framework for the classic hypothesis in educational psychology that classroom interaction promotes psychological safety. It also balances the feasibility of engineering deployment with 78.3M parameters and an inference speed of 26 FPS. This framework still has several limitations, including subjective bias in data annotation, information bottlenecks from a single visual modality, and superlinear growth of errors under extreme occlusion. Future work will proceed in three directions: introducing speech and text modalities to enrich the signal sources for psychological state perception; achieving personalized adaptation for students in different classes and age groups based on meta-learning; and promoting model migration to edge devices through knowledge distillation and structural pruning, ultimately realizing real-time and full-scenario deployment of classroom psychological safety perception systems.
[1] Wang, S., Wang, F., Zhu, Z., Wang, J., Tran, T., Du, Z. (2024). Artificial intelligence in education: A systematic literature review. Expert Systems with Applications, 252: 124167. https://doi.org/10.1016/j.eswa.2024.124167
[2] Bergdahl, N., Bond, M., Sjöberg, J., Dougherty, M., Oxley, E. (2024). Unpacking student engagement in higher education learning analytics: A systematic review. International Journal of Educational Technology in Higher Education, 21(1): 1-33. https://doi.org/10.1186/s41239-024-00493-y
[3] Bond, M., Buntins, K., Bedenlier, S., Zawacki-Richter, O., Kerres, M. (2020). Mapping research in student engagement and educational technology in higher education: A systematic evidence map. International Journal of Educational Technology in Higher Education, 17(1): 1-30. https://doi.org/10.1186/s41239-019-0176-8
[4] Lu, W., Yang, Y., Song, R., Chen, Y., Wang, T., Bian, C. (2025). A video dataset for classroom group engagement recognition. Scientific Data, 12(1): 1-16. https://doi.org/10.1038/s41597-025-04987-w
[5] Ayub, U., Yazdani, N., Kanwal, F. (2020). Students’ learning behaviours and their perception about quality of learning experience: The mediating role of psychological safety. Asia Pacific Journal of Education, 42(3): 398-414. https://doi.org/10.1080/02188791.2020.1848797
[6] Moffett, J., Little, R., Illing, J., de Carvalho Filho, M.A., Bok, H. (2024). Establishing psychological safety in online design-thinking education: A qualitative study. Learning Environments Research, 27(1): 179-197. https://doi.org/10.1007/s10984-023-09474-w
[7] Hardie, P., O’donovan, R., Jarvis, S., Redmond, C. (2022). Key tips to providing a psychologically safe learning environment in the clinical setting. BMC Medical Education, 22(1): 1-11. https://doi.org/10.1186/s12909-022-03892-9
[8] Liu, Q., Jiang, X., Jiang, R. (2025). Classroom behavior recognition using computer vision: A systematic review. Sensors, 25(2): 373. https://doi.org/10.3390/s25020373
[9] Li, Y., Qi, X., Saudagar, A.K.J., Badshah, A.M., Muhammad, K., Liu, S. (2023). Student behavior recognition for interaction detection in the classroom environment. Image and Vision Computing, 136: 104726. https://doi.org/10.1016/j.imavis.2023.104726
[10] Sümer, Ö., Goldberg, P., D’mEllo, S., Gerjets, P., Trautwein, U., Kasneci, E. (2021). Multimodal engagement analysis from facial videos in the classroom. IEEE Transactions on Affective Computing, 14(2): 1012-1027. https://doi.org/10.1109/taffc.2021.3127692
[11] Mu, S., Cui, M., Huang, X. (2020). Multimodal data fusion in learning analytics: A systematic review. Sensors, 20(23): 6856. https://doi.org/10.3390/s20236856
[12] Ouhaichi, H., Spikol, D., Vogel, B. (2023). Research trends in multimodal learning analytics: A systematic mapping study. Computers and Education: Artificial Intelligence, 4: 100136. https://doi.org/10.1016/j.caeai.2023.100136
[13] Mo, Y., Wu, Y., Yang, X., Liu, F., Liao, Y. (2022). Review the state-of-the-art technologies of semantic segmentation based on deep learning. Neurocomputing, 493: 626-646. https://doi.org/10.1016/j.neucom.2022.01.005
[14] Sajjad, M., Ullah, F.U.M., Ullah, M., et al. (2023). A comprehensive survey on deep facial expression recognition: Challenges, applications, and future guidelines. Alexandria Engineering Journal, 68: 817-840. https://doi.org/10.1016/j.aej.2023.01.017
[15] Chango, W., Lara, J.A., Cerezo, R., Romero, C. (2022). A review on data fusion in multimodal learning analytics and educational data mining. WIREs Data Mining and Knowledge Discovery, 12(4): e1458. https://doi.org/10.1002/widm.1458
[16] Hu, M., Wei, Y., Li, M., et al. (2022). Bimodal learning engagement recognition from videos in the classroom. Sensors, 22(16): 5932. https://doi.org/10.3390/s22165932
[17] Jia, Q., He, J. (2024). Student behavior recognition in classroom based on deep learning. Applied Sciences, 14(17): 7981. https://doi.org/10.3390/app14177981
[18] Cao, Y., Cao, Q., Qian, C., Chen, D. (2025). YOLO-AMM: A real-time classroom behavior detection algorithm based on multi-dimensional feature optimization. Sensors, 25(4): 1142. https://doi.org/10.3390/s25041142
[19] Zhao, X.M., Yusop, F.D.B., Liu, H.C., Prilanita, Y.N., Chang, Y.X. (2025). Classroom student behavior recognition using an intelligent sensing framework. IEEE Access, 13: 49767-49776. https://doi.org/10.1109/access.2025.3550921
[20] Wang, Z., Wang, M., Zeng, C., Li, L. (2025). SCB-DETR: Multiscale deformable transformers for occlusion-resilient student learning behavior detection in smart classroom. IEEE Transactions on Computational Social Systems, 12(6): 4979-4998. https://doi.org/10.1109/tcss.2025.3595170
[21] Peng, S., Zhang, X., Zhou, L., Wang, P. (2025). YOLO-CBD: Classroom behavior detection method based on behavior feature extraction and aggregation. Sensors, 25(10): 3073. https://doi.org/10.3390/s25103073
[22] Sheng, X., Li, S., Chan, S. (2025). Real-time classroom student behavior detection based on improved YOLOv8s. Scientific Reports, 15(1): 1-11. https://doi.org/10.1038/s41598-025-99243-x
[23] Tang, X., Gong, Y., Xiao, Y., Xiong, J., Bao, L. (2024). Facial expression recognition for probing students’ emotional engagement in science learning. Journal of Science Education and Technology, 34(1): 13-30. https://doi.org/10.1007/s10956-024-10143-7
[24] Chen, Y., Liu, S., Zhao, D., Ji, W. (2023). Occlusion facial expression recognition based on feature fusion residual attention network. Frontiers in Neurorobotics, 17: 1250706. https://doi.org/10.3389/fnbot.2023.1250706
[25] Ma, H., Lei, S., Li, H., Celik, T. (2025). FER-VMamba: A robust facial expression recognition framework with global compact attention and hierarchical feature interaction. Information Fusion, 124: 103371. https://doi.org/10.1016/j.inffus.2025.103371
[26] Guo, J., Peng, J., Huang, Y., Chen, G., Cai, Z., Tan, S. (2025). Multi-scale feature fusion for facial expression recognition. Neural Computing and Applications, 37(17): 11399-11420. https://doi.org/10.1007/s00521-025-11139-z
[27] Zhao, Z., Liu, Q., Wang, S. (2021). Learning deep global multi-scale and local attention features for facial expression recognition in the wild. IEEE Transactions on Image Processing, 30: 6544-6556. https://doi.org/10.1109/tip.2021.3093397
[28] Aly, M. (2024). Revolutionizing online education: Advanced facial expression recognition for real-time student progress tracking via deep learning model. Multimedia Tools and Applications, 84(13): 12575-12614. https://doi.org/10.1007/s11042-024-19392-5
[29] Trabelsi, Z., Alnajjar, F., Parambil, M.M.A., Gochoo, M., Ali, L. (2023). Real-time attention monitoring system for classroom: A deep learning approach for student’s behavior recognition. Big Data and Cognitive Computing, 7(1): 48. https://doi.org/10.3390/bdcc7010048
[30] Han, S., Liu, D., Lv, Y. (2022). The influence of psychological safety on students’ creativity in project-based learning: The mediating role of psychological empowerment. Frontiers in Psychology, 13: 865123. https://doi.org/10.3389/fpsyg.2022.865123
[31] Thomas, C., Gupta, S. (2024). International medical students’ experiences of psychological safety in feedback episodes: A focused ethnographic study. BMC Medical Education, 24(1): 1-9. https://doi.org/10.1186/s12909-024-06077-8
[32] Madsgaard, A., Svellingen, A. (2025). The benefits and boundaries of psychological safety in simulation-based education: An integrative review. BMC Nursing, 24(1): 1-10. https://doi.org/10.1186/s12912-025-03575-y