Dhamayandhi Nagarajan* | Kannan Samickannu
© 2026 The authors. This article is published by IIETA and is licensed under the CC BY 4.0 license (http://creativecommons.org/licenses/by/4.0/).
OPEN ACCESS
Diabetes mellitus is a significant health problem worldwide, and the identification of high-risk people before clinical complications occur allows intervention and individual prevention. In this study, the definition of early diabetes prediction was to detect diabetes risk, based on standard physiological and lifestyle factors, prior to the onset of advanced disease complications. Early detection and prediction can effectively diminish and prevent critical complications. The rapid progression of the Internet of Things (IoT) with a vision toward intelligent as well as smart healthcare devices has provided an opportunity for wearable devices and various smart health sensors to continuously record vital and physiological signs, which can contribute toward developing methods of early identification of diabetes and supporting real-time monitoring. This article introduces an IoT Signal Analytics based Feature-Aware Transformer (ISA-FT) framework for early diabetes prediction. The proposed ISA-FT method aims to identify individuals at risk of diabetes using healthcare attributes associated with diabetes progression. The presented technique employs the Boruta algorithm to eliminate irrelevant features, followed by SHapley Additive exPlanations (SHAP) to rank and interpret the most influential features affecting diabetes prediction. Furthermore, the selected features are classified using a Feature Tokenizer Transformer (FT-Transformer) with a Multi-Layer Perceptron (MLP) classification head to distinguish diabetic and non-diabetic individuals accurately. By integrating feature-aware signal analytics with transformer-based learning, the proposed ISA-FT method effectively captures the significance of diabetes-related features and their complex interactions, thereby improving early diabetes prediction performance. To improve the learning capability of the proposed ISA-FT framework, parameter optimization is carried out using the AdamW optimizer. The experimental evaluation of the proposed technique is conducted using the diabetes prediction in India dataset, and the obtained results demonstrate the superiority of the proposed method over existing diabetes prediction approaches.
diabetes prediction, Internet of Things, signal analytics, feature selection, Feature Tokenizer Transformer, model optimization, wearable sensors
Diabetes mellitus (DM) has emerged as a threatening global public health concern due to increased mortality and morbidity among a large global population, posing a great pressure to healthcare infrastructure due to various diabetic complications, such as heart diseases, thus affecting people's quality of life and health spending due to the chronicity of the disease [1]. Early diagnosis of diabetes can prevent progressive damage by enabling early interventions. However, the traditional screening approach based on blood biochemical parameters is highly sensitive, expensive, and not a desirable approach for population-level screening and continuous screening [2]. Traditional screening tests typically rely on laboratory infrastructure and well-trained healthcare providers and repeated clinical visits; hence, they offer limited practicality and accessibility, particularly in a low-resource setup where the required diagnostic facility is out of reach for rural residents [3]. Such limitations were clearly addressed in remote areas, remote mobile health camps, community-based screening programs, and primary health centers, etc., where lab infrastructure and services may not be readily accessible, and in such settings, a centralized pathology report remains an initial analysis for initial assessment and risk identification in some areas [4]. Therefore, a non-invasive, inexpensive, safe, convenient, and readily accessible diagnostic screening strategy that is suitable for a decentralized approach is urgently required [5]. In this regard, engineering-based sensing technology has drawn significant attention due to its application in monitoring diabetes risk through portable and Internet of Things (IoT) devices. Portable and IoT-enabled sensing devices promise enormous potential for on-demand and remote risk monitoring to ensure people's engagement and improve people care at their premises [6].
Recent developments in wearable technologies, non-invasive biosensing, and artificial intelligence (AI) have allowed novel strategies for risk assessment and diabetes monitoring. The usage of Machine Learning (ML) algorithms for predicting and diagnosing diabetes from actual patient information has been broadly exploited [7]. Although certain techniques have attained the best predictive outcomes in forecasting diabetes with higher precision, the interpretability of this system has rarely been estimated [8]. Hence, a deep learning (DL) approach is valuable for both understanding the causes of diabetes and developing treatment options [9]. DL tools take a look at a wealth of genetic, lifestyle, and clinical data and apply a learning model, or structure, to the data similar to that found in the human brain. They are able to uncover obscure and complex correlations in the data in order to make smarter personalized treatment recommendations and to anticipate an impending diagnosis [10]. The DL model pulls information from a patient’s genetic makeup, his or her medical background, and his or her behavioral choices to predict an increased likelihood of future diagnosis and to allow for personalized care recommendations [11]. Although ML and DL have shown remarkable results in health data prediction, there exist challenges such as a lack of interpretability, high feature redundancy, and the difficulty of integration with IoT-related health data. Hence, there is a necessity to develop an efficient and interpretable method for the prediction of diabetes in the early stages. In this paper, the IoT Signal Analytics based Feature-Aware Transformer (ISA-FT) model is presented for IoT- enabled health monitoring for high accuracy with advanced DL, and by providing better insight into health features related to risks. The major contributions of this study are as follows:
•Proposes an ISA-FT approach for early diabetes prediction by integrating IoT-enabled healthcare data with advanced DL techniques.
•Applies the Boruta feature selection method along with SHapley Additive exPlanations (SHAP) analysis to identify and interpret the most relevant diabetes-related risk factors, enhancing both model performance and explainability.
•Utilizes a Feature Tokenizer Transformer (FT-Transformer) with a Multi-Layer Perceptron (MLP) classification head to efficiently learn complex relationships among selected healthcare attributes for accurate diabetes prediction.
•Employs the AdamW optimizer to improve model training efficiency and enhance generalization performance.
•Evaluates the proposed ISA-FT model on the Diabetes Prediction in India dataset and demonstrates its efficiency compared to existing methods.
This section presents a preview of the current works on diabetes prediction and discusses the research gaps noticed. Hong et al. [12] developed a new diabetes forecasting architecture, SLAF-ResNet, which incorporates a self-learning activation function (SLALU) with an improved Residual Network. During training, the adaptive activation system adaptively adjusted neuron responses, removing the requirement for manual selection and improving the method’s capability to extract risk patterns in clinical information. Isabelmonika et al. [13] designed a convolutional neural network (CNN)-GRU framework that integrates the superior characteristics of both networks for predicting the possibility of diabetes on the basis of medical patient data that can be obtained. Demographic data and symptom-based variables were gathered from persons through investigations. Jain and Singhal [14] proposed a novel system that utilizes a Lattice Homomorphism-based Deep Neural Network (LH-DNN) to forecast gestational diabetes mellitus (GDM) in a timely and deliver personalized diet recommendations. The process starts with organizing and cleaning the information to guarantee it is balanced and reliable. Afterward, Long Short-Term Memory (LSTM) models are utilized to detect patterns in a person’s clinical records. If an analysis is validated, the LH-DNN delivers a diet that suggests traditional clinical criteria.
Devi et al. [15] examined an intelligent diabetes prediction technique that exploits both hybrid and individual system methods to enhance consistency and diagnostic performance. Various strategies, such as a CNN, a random forest (RF), an LSTM, a graph neural network (GNN), Naive Bayes, and logistic regression, were assessed by employing measures. The input information comprised physiological sensor readings, namely body temperature, pulse rate, and glucose levels, gathered from devices including wearable thermometers, pulse sensors, and glucose meters. Attipoe et al. [16] investigated improving the accuracy of forecasting diabetes mellitus by applying the stacking system. This particular system technique was preferred simply because of a potential mix made of prediction models. Karunarathna and Liang [17] introduced a new technique that removes manual data entry by collecting the multi-modal passively, automatically recorded sensor data from wearable non-invasive sensors, thus enabling practical and real-time glucose prediction.
Table 1. Comparative analysis of existing diabetes prediction approaches, highlighting key limitations and research gaps
|
Existing Approach |
Limitation |
Gaps Identified |
|
Traditional Machine Learning (ML) approaches (SVM, Logistic Regression, Random Forest) |
Limited ability to capture nonlinear and complex feature interactions |
Lack of deep representation learning for diabetes prediction |
|
Deep Learning models (ANN, CNN, LSTM) |
Require large data and often ignore feature interpretability |
Poor explainability and redundant feature usage |
|
Transformer-based models |
Strong learning capability, but not tailored for tabular healthcare data |
Lack of feature-aware selection mechanisms |
|
IoT-based healthcare systems |
Focus mainly on data collection and monitoring |
Limited integration with advanced predictive intelligence for early disease diagnosis |
|
Feature selection methods (basic filter/wrapper methods) |
Do not consider feature importance interpretation jointly |
Lack of combined selection and explainability (absence of SHAP-based interpretability integration) |
|
Existing diabetes prediction systems |
Mostly static models without optimization tuning |
Lack of adaptive optimization strategies like AdamW for better generalization and convergence stability |
Note: Internet of Things (IoT), Long Short-Term Memory (LSTM), convolutional neural network (CNN); SHAP = SHapley Additive exPlanations.
Table 1 proves that feature interpretability, nonlinearity learning, and IoT-based health systems are the weaknesses of current approaches, motivating the development of an intelligent and feature-informed predictive method. To address these shortcomings, the proposed ISA-FT model integrates feature selection, interpretability, and transformer-based learning for improved diabetes prediction. While many feature selection methods have been proposed in the literature, traditional filter methods tend to assess the value of the variables separately and do not consider interdependencies between features. The wrapper approaches yield improved prediction accuracy, but they are very costly in terms of computation, and they may result in different subsets of features from one learning algorithm to another. Embedded methods are more efficient for calculations, but typically offer few insights into which features were selected. The proposed Boruta-SHAP is, however, a framework that integrates strong feature relevance estimation with model explainability. While Boruta determines all the features that are relevant to the overall prediction, SHAP provides a numerical value to each feature that has been kept in the prediction model.
Figure 1 presents the architecture overview of the proposed ISA-FT model. Healthcare data have been first collected and preprocessed through steps like cleaning, encoding, outlier detection, and normalization. Second, a feature selection approach such as Boruta is adopted for filtering out beneficial features of the dataset. Following this step, the selected feature set can be further visualized through SHAP to evaluate the features' importance for classification. Ultimately, the filtered feature dataset is sent as the input to the FT-Transformer to capture the intricate interdependencies between features via self-attention. Binary classification is performed to classify between non-diabetic and diabetic patients by employing an MLP classification head. The optimization algorithm AdamW has been utilized during the training stage to efficiently guide the learning process and enhance the model's generalization capabilities.

Figure 1. Overall architecture of the IoT Signal Analytics based Feature-Aware Transformer (ISA-FT) model
3.1 Dataset description
For implementing the proposed approach, we utilized the diabetes prediction in India Dataset available at Kaggle [18].
The diabetes prediction in India dataset was chosen for this study due to its extensive database of demographic, lifestyle, physiological, and clinical information, which closely mimics the diverse data produced in IoT-powered healthcare settings. In contrast, the selected dataset has more samples (5,292 instances) and more healthcare variables, which facilitate learning feature interactions more effectively with the proposed FT-Transformer architecture than conventional datasets like the PIMA Indian Diabetes Data Set. Moreover, the presence of several health-related attributes allows meaningful feature selection using Boruta and model interpretability analysis by SHAP. This dataset contains a total of 5,292 observations with 27 original features related to lifestyle, physical, and clinical conditions. Among them, 18 key features have been identified after feature selection to develop the model. The 27 original attributes of healthcare data were examined, with nine that proved less informative or redundant dropped and 18 identified as being highly relevant by Boruta. The feature subset was then used to perform SHAP analysis and quantify the contribution of each feature to the prediction output. Instead of a second feature elimination step, SHAP's results are validated by ranking the features based on their global importance and giving explanations for each prediction at the local level. The extracted SHAP ranking was similar to the Boruta-based feature subset, which confirmed that the importance of the features was not significantly influenced by the proposed prediction system. It is a marginally balanced dataset with 2,588 observations representing the non-diabetic individuals and 2,704 observations representing the diabetic individuals, as illustrated in Table 2.
Table 2. Dataset description and class distribution of the diabetes prediction in India dataset
|
Class Labels |
Class Count |
|
Non-Diabetic |
2588 |
|
Diabetic |
2704 |
|
Total |
5292 |
A marginally balanced distribution helps to alleviate the sampling-based biases in model learning, as well as improve the stability and uniformity of the classification performance. For adapting the study in the realm of the IoT-enabled healthcare ecosystem, each feature has been envisioned corresponding to some relevant wearable or biosensing device for generating real time physiological signals, as depicted in Table 3.
Table 3. Mapping of dataset attributes to corresponding IoT-based wearable and biosensing devices
|
Attribute Name |
Used Sensor |
|
BMI |
HX711 Load Cell Sensor |
|
Physical_Activity |
MPU6050 Accelerometer |
|
Heart_Rate |
MAX30102 PPG Sensor |
|
Stress_Level |
Grove GSR Sensor |
|
Hypertension |
MPX5050DP Blood Pressure Sensor |
|
Fasting_Blood_Sugar |
Dexcom G6 CGM Sensor |
|
Postprandial_Blood_Sugar |
Dexcom G6 CGM Sensor |
|
Glucose_Tolerance_Test_Result |
Dexcom G6 CGM Sensor |
|
Waist_Hip_Ratio |
Stretch Sensor |
In real world IoT healthcare settings, physiological sensor readings can be subject to motion artefact, communication delay, environmental noise, and sometimes signal loss. The use of an offline benchmark dataset does not make the present study less applicable to real-world data; the proposed preprocessing stage (outlier removal and normalization) does offer some robustness against noisy measurements.
3.2 Preprocessing
The preprocessing stage is performed to improve data quality and enhance the effectiveness of the diabetes prediction model [19]. Initially, the dataset will be encoded, outliers will be removed & discarded, and MinMax normalization will be applied to all features before applying feature selection and classification.
•Encoding: The dataset consists of numerical and categorical features, such as 'Physical activity', 'stress level', and 'hypertension', which is a categorical feature, so we transform it to a numerical value using the appropriate encoding technique so that the FT-Transformer model is capable of handling this heterogeneity.
•Outlier detection and removal: Outliers can adversely impact model performance because outliers introduce new and extreme features into the dataset, which makes the prediction process less accurate. Hence, outlier detection and elimination are required in order to clear away these extreme values for a good diabetes prediction dataset.
•Min-max normalization: After outlier removal, the feature values are normalized using Min-Max normalization to scale all attributes within a common range. The Min-Max normalization is computed as:
$X_{\text {norm }}=\frac{X-X_{\text {min }}}{X_{\text {max }}-X_{\text {min }}}$ (1)
where, $X_{\text {norm}}$ is the normalized feature value, $X$ represents the original feature value, $X_{\text {min}}$ indicates the minimum value of the feature, and $X_{\text {max}}$ is the feature's maximum value Encoding, outlier detection and removal, and Min-Max scaling process the dataset to produce a unified representation, setting up the Boruta-SHAP feature selection and FT-Transformer diabetes prediction tasks for enhanced outcomes.
3.3 Boruta-SHapley Additive exPlanations feature selection
This section explains the feature selection process used for identifying the most relevant features and improving model interpretability.
3.3.1 Boruta
The intent behind this work is to figure out which are the important features to determine for early predicting diabetes using the Boruta algorithm [20]. The Boruta algorithm is the feature selection algorithms that use RF. Boruta identifies a feature by comparing attributes against features with the permutation of the features of those features known as "shadow features". They make shadow features by permuting the current feature set of the features, creating a new feature set, and running the model with both datasets to get a measure of the features' importance. Boruta tries to measure the relative importance of current features against shadow features using the Z-score, such that they determine whether actual features are more significant for making predictions and help them to find the more significant features. The Boruta algorithm generates shadow features by randomly shuffling the original feature values and trains an RF model using both original and shadow features. Feature importance scores are then computed and compared using Z-scores, where features that consistently achieve higher importance than their shadow counterparts are retained as relevant, while less significant features are discarded.
$Z_i=\frac{I_i-\mu_{\text {shadow }}}{\sigma_{\text {shadow }}}$ (2)
where, $I_i=$ Importance score of the $i^{t h}$ feature, $\mu_{\text {shadow}}=$ Mean importance score of the shadow features, and $\sigma_{\text {shadow}}=$ Standard deviation of the shadow feature importance scores. The Boruta algorithm has a unique advantage when it comes to selecting optimal features since it includes all pertinent features, even those features that have interactions with other features. The method aims to keep important predictive features to prevent overfitting and maintain the generalization performance of the system. In this present study, the Boruta algorithm is used to discard non-relevant information provided by IoT-based sensors to make a decision for predicting the outcome of diseases that influence diabetes patients.
3.3.2 SHapley Additive exPlanations
While Boruta excels in selecting a portion of informative features from the original feature set by comparing the original with generated shadow features (for noise and redundancy reduction), the approach itself acts like a feature filter. To serve this purpose and to further enrich post-hoc explanation for features, we then apply SHAP for the selection and ranking of those important IoT features. The two combined, i.e., Boruta first for selection of the IoT features, followed by SHAP for ordering and interpretation, offer a two-tier solution where important features are screened by the latter, and the interpretability aspect for the prediction of diabetes based on this feature set is analyzed by the FT-Transformer.
By providing an explanation, SHAP reports the influence of each feature in a prediction while averaging over all possible combinations. It works by evaluating the marginal contribution of every feature against all other combinations to provide model-wise or local explanations without ignoring interactions. SHAP overcomes some of the limitations in traditional model interpretation methods, for example, by providing model-agnostic interpretation and allocating contributions fairly according to cooperative game theory. Thus, this algorithm makes SHAP an applicable method in healthcare domains. The SHAP value is calculated as:
$\phi_i=\sum_{S \subseteq F \backslash\{i\}} \frac{|S|!(|F|-|S|-1)!}{|F|!}[f(S \cup\{i\})-f(S)]$ (3)
Here, $\phi_{\mathrm{i}}$ represents the contribution of feature $i$ to the prediction, and the remaining terms define the feature subsets and model outputs involved in SHAP-based importance estimation.
3.4 Feature Tokenizer Transformer with Multi-Layer Perceptron classification head
This section presents the FT-Transformer model with an MLP classification head used for diabetes prediction. The FT-Transformer model with an MLP classification head is designed to address the drawbacks noticed in standard ML approaches when performing on a combined diabetes dataset [21]. However, the FT-Transformer successfully conducts feature interactions by multi-head self-attention (MHSA) and token embeddings; its ability to convert the learnable representations into precise prediction outcomes needs a better classification mechanism. Hence, an MLP classification head is incorporated, and then the transformer encoder is utilized to increase the discrimination ability. This framework allows for gaining global contextual dependencies using attention, while executing efficient non-linear classification via dense transformations. The FT-Transformer architecture obtains the feature-selected and preprocessed input matrix $X_{\text {train}}$. The feature tokenizer can be utilized to combine all the feature columns as a learnable vector representation. Considered an input vector $x \in \mathbb{R}^d$, the tokenizer maps to every feature $x_j$ and token embedding as given below:
$t_j=E_j x_j+b_j$ (4)
Here, the parameter $t_j$ characterizes a $j^{\text {th}}$ token embedding, and the mathematical form of $E_j \in \mathbb{R}^{d_{\text {model}}}$ represents the feature-related projection matrix. Later, during tokenization, the positional encodings have been integrated into the token sequences and entered into the transformer encoder module. In the encoder, MHSA calculates contextual correlations between the embedded features:
$\operatorname{Attention}(Q, K, V)=\operatorname{softmax}\left(\frac{Q K^T}{\sqrt{d_k}}\right) V$ (5)
In this mathematical form, $d_k$ points to the dimension of the key vectors, $K$ indicates the key matrix, $V$ denotes the value matrix, and the term $Q$ indicates the query matrix.
This method allows the model to dynamically obtain feature interactions between IoT sensor-based features, namely fasting blood sugar, physical activity, stress level, BMI, postprandial blood sugar, and hypertension, thus gaining intricate dependencies related to diabetes risk. Additionally, the outcome of every self-attention layer is handled by residual connections, layer normalization (LN), and a feed-forward transformer module to produce the higher-level contextual representation represented by $H_{F T}$.
Later, the produced transformer representation is entered into an MLP classification head that contains fully connected (FC) layers with non-linear activation functions. The MLP is calculated by:
$\begin{aligned} & Z^{(1)}=\sigma\left(W_1 H_{F T}+b_1\right) \\ & Z^{(2)}=\sigma\left(W_2 Z^{(1)}+b_2\right)\end{aligned}$ (6)
Here, the term $b_1$ and $b_2$ represent bias vectors, the parameter $W_1$ and $W_2$ indicate trainable weight matrices, and the symbol $\sigma(\cdot)$ points out the nonlinear activation function like GELU.
The MLP classification head improves the discriminative ability of the transformer representation through learning intricate nonlinear decision boundaries related to diabetes prediction. The final prediction representation can be determined by,
$u=z^{(2)}$ (7)
A final classification layer encompassing a sigmoid activation function and dropout is utilized to produce the probability of diabetes occurrences. The model has been trained by applying Binary Cross-Entropy (BCE) loss described as:
$L=-[y \log (\hat{y})+(1-y) \log (1-\hat{y})]$ (8)
Now, the parameter $\hat{y}$ points to the predicted probability, and $y$ indicates the true class label. This architecture effectively performs feature interactions and non-linear patterns of decision-making with the help of embedding FT-Transformer and MLP as classification layers, thus improving the accuracy of timely diabetic diagnosis by employing features obtained from an IoT sensor network. Figure 2 represents the architecture of the FT-Transformer with an MLP classification head.

Figure 2. Structure of the Feature Tokenizer Transformer (FT-Transformer)-Multi-Layer Perceptron (MLP) classification model
3.5 AdamW optimization
This section describes the AdamW optimization method used to improve model training and enhance generalization performance. AdamW is an enhanced form of the Adam optimizer that improves model training by avoiding overfitting and increasing generalization [22]. It uses L2 regularization instead of standard Adam, decouples weight decay and gradient update with L2 regularization so as to update weights more effectively. Weight decay can be effectively applied in the FT-Transformer early diabetes prediction model, which guarantees consistent convergence and better performance in classification accuracy. The weight update rule is derived from Eq. (9):
$\theta_t=\theta_{t-1}-\eta\left(\frac{m_t}{\sqrt{v_t}+\epsilon}+\lambda \theta_{t-1}\right)$ (9)
The AdamW optimizer improves training efficiency and model generalization by effectively handling weight decay, resulting in enhanced classification performance for early diabetes prediction.
This section describes the experimental configuration, experimental procedures, and analysis of the results. The proposed ISA-FT model was developed with a Python (Keras / TensorFlow) based DL framework. This experiment has been conducted on a personal computer (PC) with an operating system (OS) on Windows, with an Intel(R) Core (TM) i5-based CPU, 16 GB of memory, and a graphics processing unit (GPU) on the RTX series.
4.1 Performance analysis
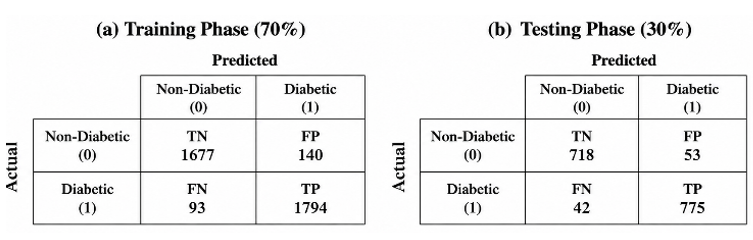
Figure 3 shows the confusion matrices of the 80:20 training phase (TRAP) and testing phase (TESP). The higher values along the diagonal indicate that most Diabetes mellitus samples were properly categorized, comprising non-diabetic and diabetic instances. In contrast, a few records were misclassified amongst the types. These outcomes indicate that ISA-FT functions well in classification tasks.
Figure 3. Classifier outcome of (a), (b) 70% and 30% confusion matrices
Table 4 represents the ISA-FT of the proposed system under a 70:30 train-test split. The results show that the ISA-FT approach effectively distinguishes between the two types. The proposed ISA-FT technique attains an average value of $accur_y$ of 93.71% in TRAP and $accur_y$ of 94.02 in TESP, where the MCC Score of 87.44 and 88.03 for both the TRAP-TESP split values, emphasizing the stronger predictive performance and robustness in the Diabetes Mellitus classification.
Table 4. Diabetes mellitus classification of the IoT Signal Analytics based Feature-Aware Transformer (ISA-FT) approach with a 70:30 split
|
Training Phase (TRAP) (70%) |
|||||
|
Class Labels |
Accuracy ($Accur_y$) |
Precision ($Preci_n$) |
Recall ($Recal_l$) |
F1-score ($F 1_{{Score}}$) |
MCC |
|
Non-Diabetic |
93.71 |
94.75 |
92.29 |
93.5 |
87.44 |
|
Diabetic |
93.71 |
92.76 |
95.07 |
93.9 |
87.44 |
|
Average |
93.71 |
93.75 |
93.68 |
93.7 |
87.44 |
|
Testing Phase (TESP) (30%) |
|||||
|
Non-Diabetic |
94.02 |
94.47 |
93.13 |
93.79 |
88.03 |
|
Diabetic |
94.02 |
93.6 |
94.86 |
94.22 |
88.03 |
|
Average |
94.02 |
94.04 |
93.99 |
94.01 |
88.03 |
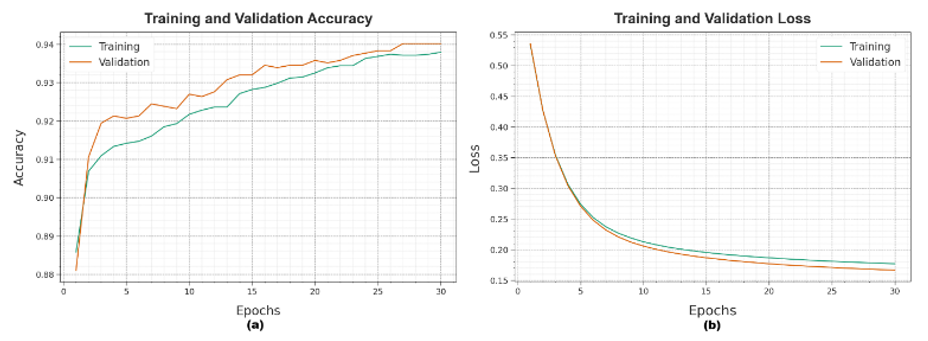
Figure 4. Accuracy and loss curve of the IoT Signal Analytics based Feature-Aware Transformer (ISA-FT) method
Figure 4 depicts the training (TRAING) and validation (VALIDN) accuracy and loss curves of the ISA-FT algorithm. Figure 4(a) exhibits an accuracy curve that increases steadily and reaches a higher level, demonstrating effective learning and convergence. Figure 4(b) shows the loss curve reduces sharply in initial epochs, and then progressively alleviates as training progresses, signifying the efficiency of the proposed methodology in learning discriminative features for Diabetes Mellitus classification.
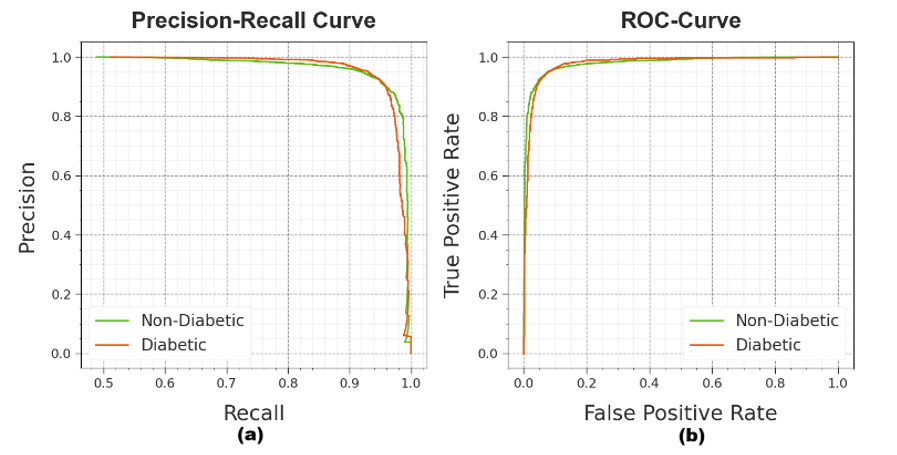
Figure 5. Precision-Recall (PR) and Receiver Operating Characteristic (ROC) curves of the IoT Signal Analytics based Feature-Aware Transformer (ISA-FT) method
Figure 5 reveals the Precision-Recall (PR) and Receiver Operating Characteristic (ROC) curves of the ISA-FT method. Figure 5(a) shows that the PR analysis of the ISA-FT approach reaches a maximum precision solution and achieves a minimal recall value through dual categorization. In addition, Figure 5(b) exhibits the ROC inspection of the ISA-FT method, suggesting growing ROC values, obviously revealing that the ISA-FT technique achieves superior performance for both classes.
4.2 Comparison analysis
Table 5 portrays the comparison results of the ISA-FT system with other methodologies using evaluation metrics [23, 24]. The results indicated that the RF, XGBoost Classifier, and TCN strategies have performed with lower values $a c c u r_y$ of 70.80%, 75.00%, and 75.00%, respectively. In the meantime, the LSTM, InceptionNet, TIPNet Deep Model, and ANN approaches have attained closer performance. On the other hand, the ISA-FT system has achieved greater outcomes with $accur_y$ of 94.02%, $F 1_{{Score}}$ of 94.01%, $recal_l$ of 93.55%, and $preci_n$ of 94.04% compared to the traditional methods.
Table 5. Comparative outcomes of the IoT Signal Analytics based Feature-Aware Transformer (ISA-FT) system with existing models
|
Model |
$Accur_y$ |
$F 1_{{Score}}$ |
$Recal_l$ |
$Preci_n$ |
|
RF |
70.80 |
71.54 |
60.00 |
68.82 |
|
XGBoost Classifier |
75.00 |
74.12 |
90.90 |
76.12 |
|
ANN |
91.67 |
90.11 |
91.67 |
92.43 |
|
TCN |
75.00 |
76.00 |
80.00 |
73.00 |
|
LSTM |
85.00 |
84.00 |
80.00 |
89.00 |
|
InceptionNet |
85.00 |
86.00 |
88.00 |
83.00 |
|
TIPNet Deep Model |
88.00 |
89.00 |
89.00 |
89.00 |
|
ISA-FT |
94.02 |
94.01 |
93.99 |
94.04 |
Note: Long Short-Term Memory (LSTM), random forest (RF).
Paired statistical significance analysis was conducted at a 95% confidence level to ensure the observed performance increase has statistical significance. The proposed ISA-FT model showed statistically significant differences with the other models (p < 0.05), so it is assumed that the improvement in performance is not due to chance.
Table 6. Ablation study of IoT Signal Analytics based Feature-Aware Transformer (ISA-FT) model with existing methods
|
Methods |
Accuracy |
F1-Score |
Recall |
Precision |
|
FT-Transformer + MLP (Without Boruta-SHAP & AdamW) |
91.84 |
91.79 |
91.66 |
91.74 |
|
Preprocessing + FT-Transformer + MLP (Without Boruta-SHAP) |
92.53 |
92.48 |
92.34 |
92.41 |
|
Preprocessing + Boruta-SHAP + MLP (Without FT-Transformer) |
92.97 |
92.93 |
92.78 |
92.85 |
|
Preprocessing + Boruta-SHAP + FT-Transformer (Without AdamW) |
93.56 |
93.51 |
93.39 |
93.47 |
|
ISA-FT (Preprocessing + Boruta-SHAP + FT-Transformer + AdamW) |
94.02 |
94.01 |
93.99 |
94.04 |
Note: Feature Tokenizer Transformer (FT-Transformer), Multi-Layer Perceptron (MLP).
An ablation study measures the importance of specific elements by systematically eliminating or altering them. It supports classifying the most significant elements and their effect on the model performance. Table 6 signifies the ablation study of the ISA-FT technique. The results suggest that the FT-Transformer + MLP (Without Boruta-SHAP & AdamW), Preprocessing + FT-Transformer + MLP (Without Boruta-SHAP), Preprocessing + Boruta-SHAP + MLP (Without FT-Transformer), and Preprocessing + Boruta-SHAP + FT-Transformer (Without AdamW) strategies have obtained lower performances under various measures. For the meantime, the proposed ISA-FT (Preprocessing + Boruta-SHAP + FT-Transformer + AdamW) approach has achieved higher performances with $accur_y$ of 94.02%, $F1_{\text {Score}}$ of 94.01%, $recal_l$ of 93.55%, and $preci_n$ of 94.04%. These results demonstrate the efficiency of integrating all proposed elements into an integrated framework.
4.3 Feature importance analysis
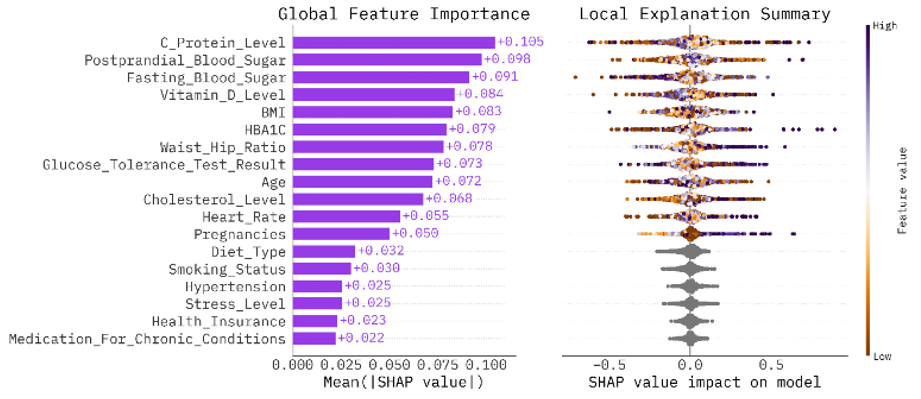
Figure 6 exhibits the SHAP-based feature importance analysis of the chosen features. The outcomes implied that C_Protein_Level, Postprandial_Blood_Sugar, Fasting_Blood_Sugar, Vitamin_D_Level, and BMI are the most powerful factors influencing diabetes prediction. This enhances the efficacy of the Boruta-SHAP feature selection method in classifying significant diabetes-related features.
Figure 6. SHapley Additive exPlanations (SHAP)-based global feature importance and local explanation
4.4 Discussion
The empirical outcomes clearly point out that the proposed ISA-FT model performed well compared to the existing ML and DL methods with respect to predicting the risk of developing diabetes. This improvement must be associated with the integrated influence of feature selection, transformer-based learning, and an optimized training approach. The usage of Boruta ensures that only the most relevant features are retained, decreasing noise and increasing the stability of the model. The SHAP analysis supports interpreting the reasons for predicting risk factors, thus making it consistent from the medical perspective. The FT-Transformer efficiently gains intricate correlation among selected features, surpassing conventional classifiers that struggle with non-linear dependencies. Generally, the outcomes highlighted that the ISA-FT technique steadily surpassed other benchmark techniques based on metrics such as accuracy, precision, recall, and F1-score; it demonstrates that the integration of feature-driven learning and a transformer model is an effective technique for early detection of diabetes risk.
In practice, the proposed ISA-FT framework is also computationally efficient as it achieves dimensionality reduction in input data before applying transformer learning through feature selection. FT-Transformer only considers the selected features, which helps to decrease the number of unnecessary computations without compromising the prediction accuracy.
In this work, the ISA-FT approach has been presented to predict diabetes using health-associated features. The main objective was to build a simple yet effective approach that can support early risk identification using data that can be gathered from IoT-enabled devices and health monitoring systems. The study shows that combining proper feature selection with a transformer-based model can improve prediction performance. With the help of Boruta and SHAP, the model determines factors most contributing to the result, and selected features learn the interdependencies in an effective manner by FT-Transformer. Therefore, the proposed method provides more reliable results compared to traditional approaches. Although the results are encouraging, the model is evaluated on a single dataset, which may limit its generalization. The proposed ISA-FT framework will be further tested and validated in the future on multi-center healthcare datasets, k-fold cross validation, external benchmark datasets, and real-time IoT sensor streams to check the robustness and generalization capability.
The data that support the findings of this study are openly available in the Kaggle repository at https://www.kaggle.com/datasets/ankushpanday1/diabetes-prediction-in-india-dataset, reference number [18].
[1] Shaheen, I., Javaid, N., Ali, Z., Ahmed, I., Khan, F.A., Pamucar, D. (2026). A trustworthy and patient privacy-conscious framework for early diabetes prediction using Deep Residual Networks and proximity-based data. Biomedical Signal Processing and Control, 112: 108361. https://doi.org/10.1016/j.bspc.2025.108361
[2] Gogiladevi, K., Fiaz, L.S., Sowmiya, T., Surya, G. (2026). Predicting diabetic retinopathy: An analysis of electroretinogram (ERG) signal patterns. AIP Conference Proceedings, 3345(1): 020152. https://doi.org/10.1063/5.0299788
[3] Abraham, S.E., Kovoor, B.C. (2026). MHSA-enhanced CNNs with TOPSIS-driven ensemble learning for automated diabetic retinopathy grading. Biomedical Signal Processing and Control, 112: 108614. https://doi.org/10.1016/j.bspc.2025.108614
[4] Shetty, R., Paul, A., Praveen Kumar, A., Rai, S. (2026). Early prediction of diabetes using a reduced and interpretable feature set with a scalable machine learning framework. Discover Artificial Intelligence, 6: 400. https://doi.org/10.1007/s44163-026-01152-z
[5] Nogay, H.S., Nogay, N.H., Adeli, H. (2026). Detection of hyperglycemia and hypoglycemia using deep learning from facial images obtained with an AI image generator. Biomedical Signal Processing and Control, 111: 108351. https://doi.org/10.1016/j.bspc.2025.108351
[6] Hariharan, M., Sibi, A., Paul, R.J.M., Mathu, T. (2026). Diabetes prediction using machine learning. AIP Conference Proceedings, 3345(1): 020060. https://doi.org/10.1063/5.0298858
[7] Valilou, M., Valilou, S., Gharehchopogh, F.S. (2026). An enhanced diabetes prediction using an improved hybrid deep learning algorithm with mountain gazelle optimizer. Journal of Diabetes & Metabolic Disorders, 25(1): 46. https://doi.org/10.1007/s40200-025-01844-w
[8] Thilagavathi, G., Karthikeyan, N.K. (2026). Efficient feature selection with attention based deep CAT convolutional stacked sparse autoencoder for diabetes prediction. Computer Methods in Biomechanics and Biomedical Engineering, 1-30. https://doi.org/10.1080/10255842.2026.2613708
[9] Rebecca, A.K., Brintha, N.C. (2026). A novel deep learning-based prediction of DME in eye diseases. Biomedical Signal Processing and Control, 113: 108946. https://doi.org/10.1016/j.bspc.2025.108946
[10] Hasan, E., Paul, D., Rahaman, M. (2026). A portable intelligent system for lung disease prediction using machine learning models. In 2026 7th International Conference on Mobile Computing and Sustainable Informatics (ICMCSI), Goathgaun, Nepal, pp. 154-159. https://doi.org/10.1109/icmcsi67283.2026.11412889
[11] Ha, H.H., Kim, H., Yu, Y.H., Sim, H. (2025). Diabetes early prediction using machine learning and ensemble methods. International Journal on Advanced Science, Engineering & Information Technology, 15(2): 363-375. https://doi.org/10.18517/ijaseit.15.2.20947
[12] Hong, C.Y., Wang, C., Chen, F.L. (2026). SLAF-ResNet: A self-learning activation based ResNet for enhanced diabetes prediction. Biomedical Signal Processing and Control, 119: 109889. https://doi.org/10.1016/j.bspc.2026.109889
[13] Isabelmonika, N., Meenambigai, R., Devi, N.S., Sairam, A., Suresh, G., Srivel, R. (2026). Hybrid CNN-GRU framework for diabetes mellitus prediction in clinical patient records. In 2026 12th International Conference on Communication and Signal Processing (ICCSP), Melmaruvathur, India, pp. 601-606. https://doi.org/10.1109/iccsp68173.2026.11539696
[14] Jain, A., Singhal, A. (2026). Gestational diabetes prediction and diet recommendation using lattice homomorphism-based deep neural network. Biomedical Signal Processing and Control, 123: 110398. https://doi.org/10.1016/j.bspc.2026.110398
[15] Devi, V.K., Umamaheswari, E., Utkarsh, M., Gao, X.Z., Bhat, M. (2026). Sensor-driven artificial intelligence for early diabetes prediction using machine learning models. In Adaptive AI in Sensor Informatics, Elsevier, 181-202. https://doi.org/10.1016/b978-0-443-36412-9.00008-x
[16] Attipoe, E.K., Yussiff, A.S., Asante-Mensah, M.G., Tetteh, E.D., Turkson, R.E. (2025). An ensemble learning approach for diabetes prediction using the stacking method. Computer Science and Information Technologies, 6(2): 102-111. https://doi.org/10.11591/csit.v6i2.pp102-111
[17] Karunarathna, T.S., Liang, Z.L. (2025). Development of non-invasive continuous glucose prediction models using multi-modal wearable sensors in free-living conditions. Sensors, 25(10): 3207. https://doi.org/10.3390/s25103207
[18] https://www.kaggle.com/datasets/ankushpanday1/diabetes-prediction-in-india-dataset, accessed on Feb. 18, 2026.
[19] Mu, W., Cardelli, R., Ferrari, S. (2026). Data preprocessing techniques for machine learning towards improving building energy performance: A systematic review. Energies, 19(6): 1561. https://doi.org/10.3390/en19061561
[20] Gao, H.C., Liu, Y.J., He, Z., Sun, Y.S., Wang, X.F., Hu, C. (2026). Explainable cotton mapping in northern and southern Xinjiang using Boruta feature selection and SHAP analysis. European Journal of Remote Sensing, 59(1): 2642998. https://doi.org/10.1080/22797254.2026.2642998
[21] Revathi, T.K., Sathiyabhama, B., Kaliraj, S., Lydia, M.D., Sivakumar, V. (2026). Hybrid FT-transformer with residual MLP for transferable cardiovascular risk prediction across cohorts. Discover Applied Sciences, 8: 806. https://doi.org/10.1007/s42452-026-08905-6
[22] Mekala, R. (2024). Efficient cloud based transformer model for continuous time series monitoring of blood pressure and oxygen saturation using AdamW optimizer. Indo-Americal Journal of Life Sciences and Biotechnology, 21(3): 1-17. https://www.researchgate.net/publication/392760011_Efficient_Cloud_Based_Transformer_Model_for_Continuous_Time_Series_Monitoring_of_Blood_Pressure_and_Oxygen_Saturation_Using_AdamW_Optimizer.
[23] Alagumariappan, P., Sathyamoorthy, M., Dhanaraj, R.K., et al. (2025). Optimized hybrid machine learning framework for early diabetes prediction using electrogastrograms. Scientific Reports, 15(1): 8875. https://doi.org/10.1038/s41598-025-93495-3
[24] Zafar, M.M., Khan, Z.A., Javaid, N., Aslam, M., Alrajeh, N. (2025). From data to diagnosis: A novel deep learning model for early and accurate diabetes prediction. Healthcare, 13(17): 2138. https://doi.org/10.3390/healthcare13172138