Sasi Preetha Dakshinamoorthyr* | Sreedhar Murugesan
© 2026 The authors. This article is published by IIETA and is licensed under the CC BY 4.0 license (http://creativecommons.org/licenses/by/4.0/).
OPEN ACCESS
Image security is important to protect images from unauthorized access and hackers during the image transmission and storage process. In this research article, the medical and non-medical images are encrypted (secured) using the proposed VisualNet deep learning (DL) model and Dual Order Compression-Encryption (DOCE) algorithm. The secret medical and non-medical images are resized using preprocessing, and then they are fed into the proposed VisualNet DL model to generate the binary shares. These generated binary shares are embedded into the source images using the proposed DOCE algorithm to produce the encrypted images. The decrypted binary share images are generated and applied to the decryption system. It performs the addition operation to retrieve the original secret images. The performance of this proposed method has been estimated and analyzed with respect to the performance evaluation parameters Peak Signal-to-Noise Ratio (PSNR), Mean Square Error (MSE), Pixel Difference Rate (PDR), and Mean Intensity Difference (MID). Two different medical and non-medical imaging datasets are used in this paper to analyze and compare the performance efficiency of the proposed Visual Cryptography (VC) algorithm with respect to recent methodologies. The proposed VisualNet-based VCsystem obtains 37.7 dB PSNR, 12.12 MSE, 92.97 PDR, and 33.31 MID for the medical images on Kaggle Brain Imaging (KBI) dataset. The proposed VisualNet-based VC system obtains 37.4 dB PSNR, 12 MSE, 93.61 PDR, and 33.52 MID for the non-medical images on the Prasun Roy (PR) dataset.
Visual Cryptography, medical images, encryption, VisualNet deep learning model, shares
Visual Cryptography (VC) is a method employed to encrypt images in such a way that when the cipher is decrypted, it is easily decoded by the human eye, without any complicated mathematical computation needed [1, 2]. VC decryption is not based on computation but on visual perception, which is easy but strong. It is used to facilitate the reliable and highly secure sharing of images without a computational decryption algorithm or method, which reduces the computational complexity compared to traditional encryption-based algorithms. Thus, sensitive visual information can only be reassembled by summing up multiple shares, which boosts security and removes the overhead of key management [3-6]. The key differences between the VC and the conventional encryption-decryption algorithms have been clearly depicted in Table 1.
In a conventional image transmission system, the images are compressed and then transmitted to the remote unit through the noise enable channel environments [3]. Due to the restricted bandwidth of the wireless channels, the transmitted images should be compressed before they are transmitted into the wireless channels. Therefore, the compression algorithm is required to compress the encrypted images before they are directly transmitted into the bandwidth-limited wireless channels. The secret image is embedded into the source image with the aid of the compression technique, whereas the secret image is used as the key element for compressing the pixels in the source image. The type of compression technique is entirely based on the compression ratio [4].
The medical images are mostly required lossless compression technique, in which the loss of a single pixel is more important for analyzing the patterns in the secret medical images. Therefore, the conventional system requires a lossless compression technique for compressing the medical images which leads to a low compression ratio. The lossy compression technique has been used for compressing non-medical images which leads to a higher compression ratio [5, 6]. In this research article, the medical and non-medical images are encrypted using the proposed VisualNet model and Dual Order Compression-Encryption (DOCE) algorithm. The previous studies [7] are mainly related to lightweight semantic compression-based VC for IoT medical transmission, while this work proposes a shared generation framework based on deep learning (DL)and dual-order compression-encryption.
This research article is split into various sections. Section 2 states the traditional VC methods and approaches on various kinds of images along with their limitations and simulation results; Section 3 proposes a novel VisualNet DL model-based VC approach and DOCE algorithm for compressing the secret medical and non-medical images; Section 4 highlights the simulation results and their discussions, and finally, Section 5 states the conclusion with limitations of this proposed work.
Table 1. Key differences highlighted between Visual Cryptography (VC) and the conventional encryption-decryption algorithms
|
VC Approach |
Conventional Encryption-Decryption Algorithms |
|
It divides the entire secret image into multiple share images, and it does not require a specified algorithm and key value. |
It transforms or converts the data into another format using a specified algorithm and key value. |
|
Decryption is not required to retrieve the secret image. |
Decryption is required to retrieve the secret image. |
|
The security method is computationally strong and stable. |
Key-based Security method, and hence its stability depends on the algorithm. |
|
The generated share images are appeared as noisy, and hence the security level is strong. |
It is entirely dependent on the generated key values during the encryption process. |
|
Low computational complexity |
High computational complexity |
|
Its flexibility is mostly restricted with images. |
Its flexibility is high with respect to data, images, and video. |
Blesswin et al. [7] proposed a lightweight compression technology integrated visual encryption method for a medical image processing system. The compressed medical images were transmitted to the remote unit through this proposed lightweight algorithm. The Internet of Things (IoT) system was implemented with this transmission system to reduce the error rates during the transmission of the pixels in the compressed images. The author attained 63.12 dB Peak Signal-to-Noise Ratio (PSNR), 15.87 MSE, 90.26 PDR, and 30.28 MID for the medical images on the KBI dataset. The author attained 62.19 dB PSNR, 15.98 MSE, 88.76 PDR, and 31.09 MID for the non- medical images on the PR dataset.
Ren and Zhang [8] proposed a methodology for improving the security of social media networks. The large-scale data forwarding algorithm was integrated with this lightweight algorithm to increase the image security logic. This method did not perform any compression process on the encrypted images, and it was tested with the medical type of images as identified as the main limitation of this encryption scheme. The author attained 61.90 dB PSNR, 18.32 MSE, 87.87 PDR and 29.12 MID for the medical images on the KBI dataset. The author attained 60.98 dB PSNR, 16.25 MSE, 86.20 PDR, and 29.65 MID for the non- medical images on the Prasun Roy (PR) dataset.
Yang et al. [9] developed an error correction system for image and data security in a VC system with respect to medical and non-medical data. The lightweight method based on the Bose-Chaudhuri-Hocquenghem coding algorithm was proposed in this work to perform the encryption process for the large volume of image sequences. The author attained 60.42 dB PSNR, 21.71 MSE, 85.31 PDR, and 27.87 MID for the medical images on the KBI dataset. The author attained 55.29 dB PSNR, 18.76 MSE, 84.54 PDR, and 26.65 MID for the non-medical images on the PR dataset. Wang et al. [10] designed a resistant visual cryptographic algorithm for the transmission of large multimedia images and videos over large channels. The self-computational and adaptable modeling algorithm was proposed in this work to reduce the computational complexity of the proposed encryption model on larger imaging and data models. The author attained 55.28 dB PSNR, 24.87 MSE, 83.29 PDR, and 26.19 MID for the medical images on the KBI dataset. The author attained 53.98 dB PSNR, 20.54 MSE, 81.09 PDR, and 24.17 MID for the non- medical images on the PR dataset.
Ibrahim et al. [11] proposed a Harris Hawks Optimization Algorithm (HHO) for performing VC on large-sized images and videos. The optimization workflow of the developed model was tested with the input patterns and produced the encrypted images and videos. The optimization algorithm reduced the computational complexity of the proposed HHO algorithm and improved the security performance of the proposed encryption system in this work. The author attained 51.29 dB PSNR, 26.98 MSE, 81.09 PDR, and 25.98 MID for the medical images on the KBI dataset. The author attained 52.10 dB PSNR, 23.10 MSE, 79.37 PDR, and 23.87 MID for the non- medical images on the PR dataset [12].
Jeno Jasmine et al. [13] developed a cryptographic framework using an adaptive fusion method. The medical images were encrypted using this method to improve the security system performance. Mahalakshmi and Nagarajan [14] constructed a system for encrypted medical images using the deep reinforcement algorithm. This methodology was tested on IoMT environments for real-time performance measurements. Duggirala and Sathya [15] used a hybrid deep learning algorithm for encrypting medical images for IoMT applications. Rosaline and Paulraj [16] performed both encryption and compression processes using a deep learning approach for medical images. Wu et al. [17] proposed a compression-based encryption system for medical images using a chaos-based algorithm.
The increased share growth, ineffective compression methodologies, and reconstruction artifacts lower the quality of recovered images with respect to both medical and non-medical images in conventional methods. Furthermore, the majority of current methods [18-20] only maximize one or two of these goals, leading to compromises between security robustness, reconstruction fidelity, and computing efficiency. These are identified as the research gap, and these limitations have been overcome by the proposed VisualNet, which combines compact shared representation, effective share production, and high-quality picture recovery into a single framework. Instead of being regarded as direct quantitative comparisons, the performance results presented in the literature are reviewed qualitatively to uncover research patterns because they were acquired using various datasets, preprocessing techniques, and evaluation processes. To ensure fairness, consistent datasets and evaluation measures are used in this work's experimental comparisons.
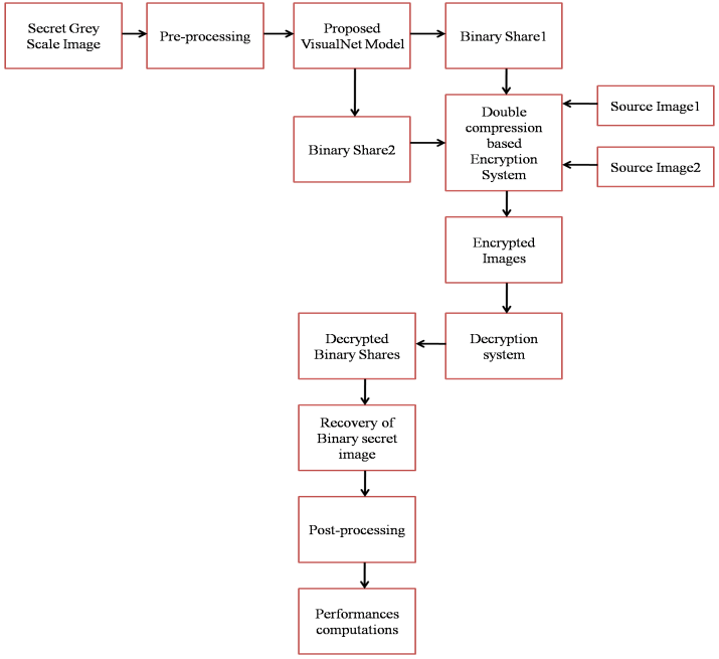
In this research article, the medical and non-medical images are encrypted using the proposed VisualNet model and DOCE algorithm. The secret medical and non-medical images are resized using preprocessing, and then they are fed into the proposed VisualNet DL model to generate the binary shares. These generated binary shares are embedded into the source images using the proposed DOCE algorithm to produce the encrypted images. The decrypted binary share images are generated and applied to the decryption system. It performs the addition operation to retrieve the original secret images. The performance of this proposed method has been estimated and analyzed with respect to the performance evaluation parameters PSNR, Mean Square Error (MSE), Pixel Difference Rate (PDR), and Mean Intensity Difference (MID). Two different medical and non-medical imaging datasets are used in this paper to analyze and compare the performance efficiency of the proposed VC algorithm with respect to recent methodologies.
Figure 1 shows the proposed VC system using double compression with the VisualNet model.
Figure 1. Proposed Visual Cryptography (VC) system using VisualNet model and Dual Order Compression-Encryption (DOCE) algorithm
3.1 Share generation using the proposed Convolutional Neural Network architecture
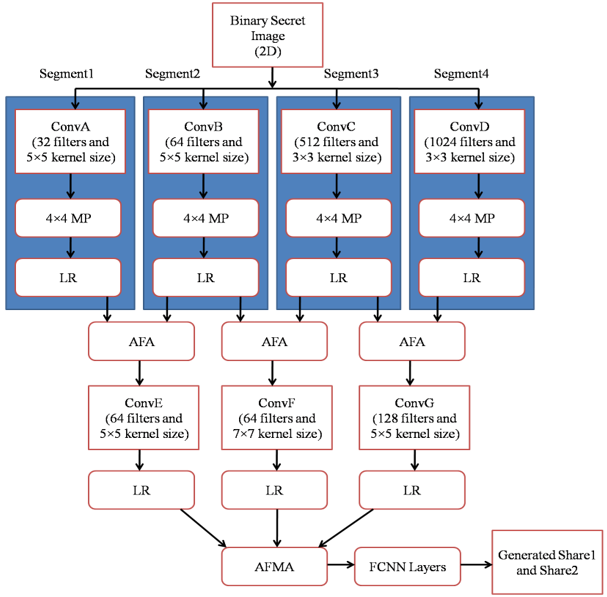
In this research work, the shares from the grey-scale images have been generated using the DL model. The traditional algorithm generates the shares as fixed patterns, and each fixed pattern is lower quality in nature. In the case of the proposed VisualNet model, the learned patterns (shares) are generated and their quality is higher. Hence, the reconstruction accuracy rate is higher in the proposed VisualNet model than the traditional share generation algorithm in the VC process. Figure 2 shows the proposed VisualNet model for the generation of shares.
Figure 2. Proposed VisualNet model for the generation of shares
The grayscale image is converted into a binary image and fed into the proposed VisualNet DL model to produce the variable share patterns. This proposed VisualNet model has been designed into four segments as depicted in Figure 2. Segment1 and segment2 have been used to compute the local feature maps from the binary secret image, and segment3 and segment4 have been used to compute the higher order edge feature maps, as illustrated in the following Eq. (1):
$\{Segments\} = \{segment1, segfment2, segment3, segment4\}$ (1)
The segment1 contains three modules: Convolutional layer (ConvA), Max pooling layer (MP), and Leaky Rectification Linear Unit (LR), which are given in the following Eq. (2-3):
$Segment 1=\left[\begin{array}{c}\operatorname{ConvA} \\ M P \\ L R\end{array}\right]$ (2)
ConvA $=(32$ filters and $5 \times 5$ filter kernel size $)$ (3)
The convolution function between the secret image and the filter kernels has been depicted in the below Eq. (4):
$C(i, j)=\sum_{p=0}^{M-1} \sum_{q=0}^{N-1} B(i+p, j+q) \times k(p, q)$ (4)
where, $B()$ represents the binary secret image, $k()$ is the filter kernel, M and N represent the width and height of the secret image and $C()$ is the feature map output.
The Max pooling layer (MP) and Leaky Rectification Linear Unit (LR) are given in Eqs. (5)-(6):
$M P=\{$Maxpooling with $4 \times 4$ window$\}$ (5)
$L R=\{$Leaky ReLU$\}$ (6)
The ReLU provides either 0 or 1 as output. Due to ‘0’ output, the neurons stop learning immediately, which is called the dying neuron problem. In order to eliminate such limitation, the LR activation function has been used in this proposed VisualNet model, and it is described by the following Eq. (7):
$L(y)=\left\{\begin{array}{c}y ; y \geq 0 \\ a \times y ; \text { else }\end{array}\right.$ (7)
The ‘a’ is a functional variable, and it is fixed at 0.01 after several trials. This LR also improves the gradient flow and computational efficiency compared to the traditional ReLU.
Segment2 contains three modules ConvB, MP, and LR, which are given in Eqs. (8)-(11):
Segment 2 $=\left[\begin{array}{c}\text { ConvB } \\ M P \\ L R\end{array}\right]$ (8)
ConvB $=(64$ filters and $5 \times 5$ filter kernel size$)$ (9)
MP $=\{$Maxpooling with $4 \times 4$ window$\}$ (10)
$L R=\{$Leaky ReLU$\}$ (11)
The computed local feature maps from segment1 and segment2 have been fed into Arithmetic Feature Adder (AFA), which adds these two local feature maps to enhance the local feature output. This output response is next passed through the ConvE, which is designed with 64 filter kernels and with the kernel size of 5 × 5. The gradient flow has been improved by eliminating the negativity in the ConvE layer output.
Segment3 contains three modules ConvC, MP, and LR, as presented in Eqs. (12)-(15):
Segment $3=\left[\begin{array}{c}\text { ConvC } \\ M P \\ \text { LR }\end{array}\right]$ (12)
ConvC $=(512$ filters and $3 \times 3$ filter kernel size$)$ (13)
MP $=\{$Maxpooling with $4 \times 4$ window$\}$ (14)
$L R=\{$Leaky ReLU$\}$ (15)
The computed local feature maps and edge feature maps from segment2 and segment3 have been fed into AFA, which adds these two feature maps to enhance the feature output. This output response is next passed through the ConvF, which is designed with 64 filter kernels and with the kernel size of 7 × 7. The gradient flow has been improved by eliminating the negativity in the ConvF layer output.
Segment4 contains three modules, ConvD, MP, and LR, and these are shown in Eqs. (16)-(19):
Segment $4=\left[\begin{array}{c}\text { ConvD } \\ M P \\ \text { LR }\end{array}\right]$ (16)
ConvD $=(1024$ filters and $3 \times 3$ filter kernel size$)$ (17)
MP $=\{$Maxpooling with $4 \times 4$ window$\}$ (18)
$L R=\{$Leaky ReLU$\}$ (19)
The computed higher-order edge feature maps from segment3 and segment4 have been fed into AFA, which adds these two higher-order edge feature maps to enhance the feature output. This output response is next passed through the ConvG, which is designed with 128 filter kernels and with the kernel size of 5 × 5. The gradient flow has been improved by eliminating the negativity in the ConvG layer output.
The final output from ConvE, ConvF and ConvG have been given to the Arithmetic Feature Map Integrator (AFMI) to produce the integrated output responses. This integrated response is fed into Fully Connected Neural Networks (FCNN) layers. In this proposed model, two fully connected layers with 4096 (for layer-1) and 512 (for layer-2) neurons have been assigned, respectively. The FCNN layer-2 produces two shares as Share-1 and Share-2. The size of Share-1 and Share-2 images is equivalent to the size of the binary secret image. The 512-neuron layer provides latent representations, which are decoded through convolutional and upsampling layers to generate two binary shares. Rather, it functions as a latent representation that is decoded using several convolutions and upsampling layers to generate two output tensors with the same spatial dimensions as the input image. A sigmoid activation followed by thresholding at 0.5 converts the outputs into binary shares.
The functional representations of these layers have been illustrated in the equations below.
AFMI output = concatenation{ConvE, ConvF, ConvG}
The hyper-parameters are the functional parameters which controls the functional output of the proposed VisualNet model in this work. The experimental setup of these functional hyper-parameters has been given in Table 2. The entire functional operation of this proposed model has been controlled by the set of parameters learning rate, batch size, epochs count, optimizer, momentum, activation function, stride, dropout, regularization, and regularization. All these experimental setup values are given in Table 2 and the internal layer specifications are given in Table 3.
Table 2. Functional experimental values of the hyper-parameters for the proposed VisualNet model
|
Parameter Names |
Parameter Values |
|
Learning rate |
0.006 |
|
Batch size |
50 |
|
Epochs count |
150 |
|
Optimizer |
Stochastic Gradient Descent (SGD) |
|
Momentum |
0.6 |
|
Activation function |
Leaky ReLU |
|
Stride |
1 |
|
Dropout |
0.1 |
|
Regularization |
0.01 |
|
Weight decay |
0.1 |
|
Layer counts |
7 |
|
Kernel size desired |
3 × 3, 5 × 5, 7 × 7 |
|
Kernels |
32, 64, 128, 512, 1024 |
|
Training input |
Secret image having a size of 512×512 pixels |
|
Target output |
Share-1 and Share-2 images |
|
Loss function |
Binary cross-entropy |
Table 3. Layer specifications
|
Convolutional Layer Names |
Specifications |
|
ConvA |
32 filters, 5 × 5 kernel size, stride 1, Max pooling with stride 2 |
|
ConvB |
64 filters, 5 × 5 kernel size, stride 1, Max pooling with stride 2 |
|
ConvC |
512 filters, 3 × 3 kernel size, stride 1, Max pooling with stride 2 |
|
ConvD |
1024 filters, 3 × 3 kernel size, stride 1, Max pooling with stride 2 |
|
ConvE |
64 filters, 5 × 5 kernel size, stride 1, Max pooling with stride 2 |
|
ConvF |
64 filters, 7 × 7 kernel size, stride 1, Max pooling with stride 2 |
|
ConvG |
128 filters, 5 × 5 kernel size, stride 1, Max pooling with stride 2 |
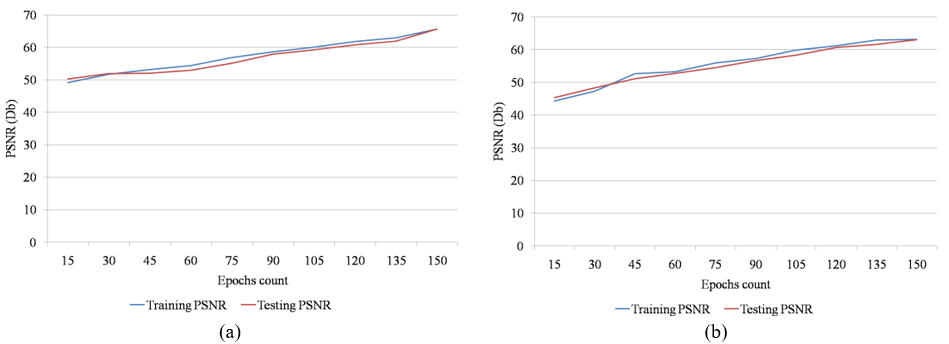
Figure 3(a) shows the PSNR computational graph with respect to epoch count on a non-medical imaging dataset, and Figure 3(b) shows the PSNR computational graph with respect to epoch count on a medical imaging dataset.
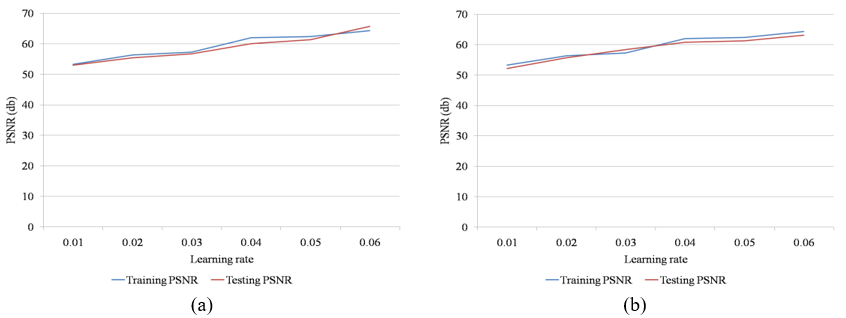
Figure 4(a) shows the PSNR computational graph with respect to learning rate on the non-medical imaging dataset, and Figure 4(b) shows the PSNR computational graph with respect to learning rate on the medical imaging dataset.
Figure 3. (a) Peak Signal-to-Noise Ratio (PSNR)computational graph with respect to epochs count on non-medical imaging dataset, (b) PSNR computational graph with respect to epochs count on medical imaging dataset
Figure 4. (a) Peak Signal-to-Noise Ratio (PSNR) computational graph with respect to learning rate on non-medical imaging dataset, (b) PSNR computational graph with respect to learning rate on medical imaging dataset
3.2 Encryption system
Encryption is the process of scramble the pixels in the secret image which is mainly used for image or data security. In this work, the encryption algorithm has been used for grey scale medical as well as non-medical images. In the conventional method, the encryption algorithm requires a key to scramble and descramble the original secret image, which is identified as the main limitation and this method of encryption consumes more time for generating the secret key. Moreover, compression is the process of compressing the pixels in the image and the compression techniques are categorized into either lossy or lossless based on the compression procedure. Here, the secret image is embedded into the source image with the aid of the compression technique, whereas the secret image is used as the key element for compressing the pixels in the source image. The type of compression technique is entirely based on the compression ratio. Medical images mostly require a lossless compression technique in which the loss of a single pixel is more important for analyzing the patterns in the secret medical images. Therefore, the conventional system requires a lossless compression technique for compressing the medical images which leads to a low compression ratio. The lossy compression technique has been used for compressing the non-medical images which leads to a higher compression ratio. In this article, the source image is only compressed, and hence a lossy compression technique has been used. In order to reduce the loss of pixels in the proposed lossy compression technique, the quantization tables (QAT) with low and higher quantization values have been used. Due to the utilization of these low- and higher-order QAT, the source image has been compressed by a dual compression process, which increases the compression ratio and reduces the loss of pixels during compression. This is the main advantage of this work to embed the secret medical image into the source image by dual QAT.
The entire DOCE algorithm is explained in the following steps:
Dual Order Compression-Encryption (DOCE) algorithm
Inputs: Source image-1 (SI-1), source image-2 (SI-2); Binary share-1 (BS-1), Binary share-2 (BS-2);
Outputs: Encrypted source image-1 (EI-1) and Encrypted source image-2 (EI-2);
Start:
Step 1:
The SI-1 and SI-2 images are resized into fixed 512 × 512 size in order to avoid overlapping and padding issues.
Step 2:
They resized source images are split into 8 × 8 non-overlapping blocks (NOB), and hence 4096 blocks are generated for each source image, respectively.
Step 3:
Generate two QAT tables with respect to lower-order quantization values and higher-order quantization values and these QAT tables are denoted as QAT-1 and QAT-2 as depicted in the following Eq. (20):
$Gsenerated Q A T s=\{Q A T-1, Q A T-2\}$ (20)
In order to retain good reconstruction quality and minimize quantization distortion during the embedding process, QAT-1 uses comparatively low quantization settings. By using larger quantization values, QAT-2, on the other hand, achieves better compression efficiency, stronger coefficient suppression, and increased robustness of the embedded information against noise and typical image processing procedures.
Step 4:
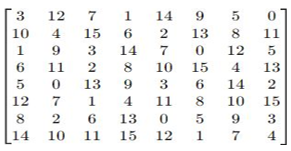
The $Q A T-1$ is constructed with lower-order quantization values, and hence the image that uses this $Q A T-1$ for the quantization process is compressed in order to obtain a low compression ratio. The $Q A T-1$ which is used for a low compression ratio, is given in Figure 5 below. Each value in this $Q A T-1$ represents the quantization value which is used to quantize the pixels in the source image. All the quantization values in this $Q A T-1$ are set between 0 and 15 and hence this $Q A T-1$ is used to produce the lower-order compressed source image.
Figure 5. $Q A T-1$ table which contains lower quantization values for performing quantization of the pixels in the source image for obtaining the compressed source image
Step 5:
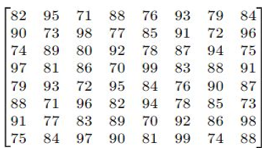
The $Q A T-2$ is constructed with higher-order quantization values, and hence the image that uses this $Q A T-2$ for the quantization process is compressed in order to obtain a high compression ratio. The $Q A T-2$ which is used for a high compression ratio, is given in Figure 6 below. Each value in this $Q A T-2$ represents the quantization value which is used to quantize the pixels in the source image. All the quantization values in this $Q A T-2$ are set between 70 and 99, and hence this $Q A T-2$ is used to produce the higher-order compressed source image.
Figure 6. $Q A T-2$ table which contains higher quantization values for performing quantization of the pixels in the source image for obtaining the compressed source image
Step 6:
During this step process, the encrypted source images are generated by embedding the secret image based on the compression process. The compression process is performed based on the quantization tables $Q A T-1$ and $Q A T-2$.
The Encrypted source image-1 (EI-1) is generated using all Non-Overlapping Block of SI-1 and Binary Share image $B S-1$ by the below Eq. (21):
$E I-1=\left\{\begin{array}{lr}\frac{N O B}{Q A T-1} ; & \text { if } B S-1=1 \\ \frac{N O B}{Q A T-2} ; & \text { else }\end{array}\right.$ (21)
The Encrypted source image-2 (EI-2) is generated using all Non-Overlapping Block of SI-2 and Binary Share image $B S-2$ by the below Eq. (22):
$E I-2=\left\{\begin{array}{lr}\frac{N O B}{Q A T-1} ; & \text { if } B S-2=1 \\ \frac{N O B}{Q A T-2} ; & \text { else }\end{array}\right.$ (22)
Step 7:
Perform the reverse operation with the aid of the quantization tables $Q A T-1$ and $Q A T-2$ to recover the binary share images 1 and 2, respectively.
Step 8:
Compute PSNR value between the original BS-1 and the recovered BS-1. If the obtained PSNR value is less than 30 dB, then repeat step 6 using the equations below.
The Encrypted source image-1 (EI-1) is generated using all Non-Overlapping Block of SI-1 and Binary Share image $B S-1$ by the below Eq. (23):
$E I-1=\left\{\begin{array}{lr}\frac{N O B}{Q A T-2} ; & \text { if } B S-1=1 \\ \frac{N O B}{Q A T-1} ; & \text { else }\end{array}\right.$ (23)
The Encrypted source image-2 (EI-2) is generated using all Non-Overlapping Block of SI-2 and Binary Share image $B S-2$ by the following Eq. (24):
$E I-2=\left\{\begin{array}{lr}\frac{N O B}{Q A T-2} ; & \text { if } B S-2=1 \\ \frac{N O B}{Q A T-1} ; & \text { else }\end{array}\right.$ (24)
End.
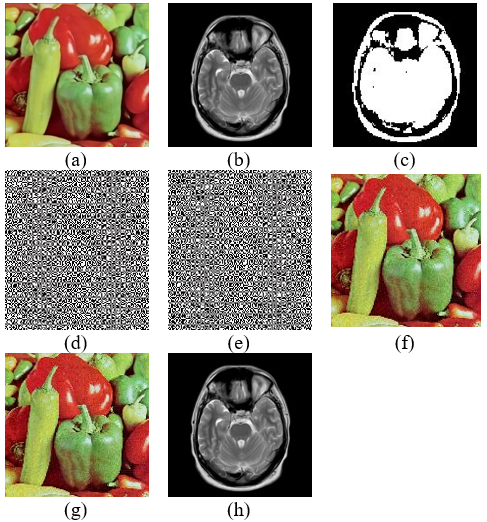
Figure 7. (a) Source image which is to be compressed by secret image, (b) grey scale secret image, (c) converted binary secret image, (d) generated BS-1 image, (e) generated BS-2 image, (f) encrypted EI-1 image by BS-1, (g) encrypted EI-2 image by BS-2, (h) recovered secret image (bit error rate is 0.0009)
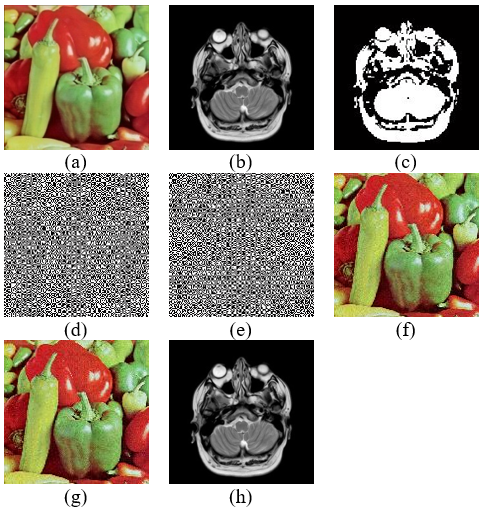
Figure 8. (a) Source image which is to be compressed by secret image, (b) grey scale secret image, (c) converted binary secret image, (d) generated BS-1 image, (e) generated BS-2 image, (f) encrypted EI-1 image by BS-1, (g) encrypted EI-2 image by BS-2, (h) recovered secret image (bit error rate is 0.0008)
Figure 7(a) shows the source image which is to be compressed by secret image (tumor case brain MRI image), Figure 7(b) shows the grey scale secret image, Figure 7(c) shows the converted binary secret image, Figure 7(d) shows the generated BS-1 image, Figure 7(e) shows the generated BS-2 image, Figure 7(f) shows the encrypted EI-1 image by BS-1 and Figure 7(g) shows the encrypted EI-2 image by BS-2 and Figure 7(h) shows the recovered secret image.
Figure 8(a) shows the source image which is to be compressed by secret image (non-tumor case brain MRI image), Figure 8(b) shows the grey scale secret image, Figure 8(c) shows the converted binary secret image, Figure 8(d) shows the generated BS-1 image, Figure 8(e) shows the generated BS-2 image, Figure 8(f) shows the encrypted EI-1 image by BS-1 and Figure 8(g) shows the encrypted EI-2 image by BS-2 and Figure 8(h) shows the recovered secret image.
This research work uses MATLAB R2023 version simulation software to simulate the proposed VC system with the VisualNet DL model. The hardware which is used in this research work is a Core i7 processor, a 1 TB SSD drive, and 8 GB RAM. Two different medical and non-medical imaging datasets are used in this paper to analyze the performance efficiency of the proposed VC algorithm. The Kaggle Brain Imaging (KBI) dataset [17] has been used as the medical imaging dataset, and the PR dataset [18] has been used as the non-medical imaging dataset.
The KBI dataset was created by BRATS programme under various medical university colleges to collect brain MRI images with respect to various medical conditions. This dataset is maintained by Kaggle, and it contains 5620 brain MRI images and all these images are split into two categories as training and testing. The training category contains 70% of medical images where testing category contains 30% of medical images. Hence, 3934 medical images are used for training the system and the remaining 1686 medical images are used for testing the system. The imaging size in this KBI dataset is about 512 × 512 pixels and all these images are in grey scale mode format.
The PR dataset was created by imaging researcher PRin the University of Technology at Sydney. This dataset is also maintained by Kaggle and it contains 15000 non-medical natural images and all these non-medical images are split into two categories as training and testing. The training category contains 70% of non-medical images whereas the testing category contains 30% of non-medical images. Hence, 10500 non-medical images are used for training the system and the remaining 4500 non-medical images are used for testing the system. The image size in this KBI dataset is about 1024 × 1024 pixels, and all these images are in RGB color scale mode format.
The performance of the proposed VisualNet DL algorithm-based VC system has been analyzed with respect to the performance evaluation parameters PSNR, MSE, PDR, and MID, as depicted in the following equations.
4.1 Peak Signal-to-Noise Ratio and Mean Square Error computations
PSNR is an accepted computational performance measure of how good a reconstructed secret binary image is relative to the original secret binary image. It is the ratio between the maximum pixel intensity and the error (noise) added during processing, and it is measured in decibels (dB). It finds extensive applications in medical image compression and encryption analysis, as depicted in Eq. (25) below:
$P S N R=10 \times \log \left(\frac{B}{M S E}\right)$ (25)
where, 255 is the maximum pixel intensity in grey scale image and MSE is the Mean Square Error, and B is the computational pixel intensity.
The computational pixel intensity (B) is determined with respect to the number of bits in each pixel in the grey scale image and it is depicted in the below Eq. (26):
$B=2^b-1$ (26)
where, b is the number of bits in each pixel of the grey scale secret image.
The MSE is another important error analysis parameter which is the average squared difference between the original secret grey scale image and the recovered secret grey scale image in a corresponding pixel position. The computation of MSE is given in Eq. (27) below:
$M S E=\frac{1}{S \times T} \sum_{i=1}^S \sum_{j=1}^T(R(i, j)-G(i, j))^2$ (27)
where, $R(i, j)$ is the recovered secret grey scale image and $G(i, j)$ is the original secret grey scale image, $S$ and $T$ are the size of the original secret grey scale image with respect to width and height, respectively.
4.2 Pixel Difference Rate computation
PDR is also a performance estimation method of gauging the sensitivity and diffusion ability of the proposed VC-based image encryption algorithm. It has been used to measure the percentage difference between pixel values of the original secret grey scale image and the recovered secret grey scale image in corresponding pixel positions. The computation of PDR is given in the following Eq. (28):
$P D R=\frac{1}{S \times T} \sum_{i=1}^S \sum_{j=1}^T C(x, y)$ (28)
where, C is the computational metric, which is computed between the original secret grey scale image and the recovered secret grey scale image.
The Computational metric is given in the following Eq. (29):
$C(x, y)=\left\{\begin{array}{c}0 ; \text { if } R(x, y)=G(x, y) \\ \text { 1: Else }\end{array}\right.$ (29)
The good diffusion represents a strong encryption system, and hence the higher value of this PDR indicates that the proposed VC-based encryption system is technically strong and has higher resistance to threats and attacks.
A higher value of PDR, which is more than 90, indicates that there is stability between the original secret grey scale image and the recovered secret grey scale image. The lower value of PDR, which is less than 90, indicates that there is poor diffusion between the original secret grey scale image and the recovered secret grey scale image.
4.3 Mean Intensity Difference computation
MID is a performance computational performance determination metric which is used in the proposed VC-based grey scale medical image encryption to measure the average intensity difference between the original secret grey scale image and the recovered secret grey scale image. It evaluates how much the pixel values change on average. It is inversely proportional to the computed PDR, and it is given in the below Eq. (30).
$M I D=\frac{1}{S \times T} \sum_{i=1}^S \sum_{j=1}^T \frac{|R(x, y)-G(x, y)|}{B}$ (30)
The higher value of MID, which is more than 40, indicates that there is instability between the original secret grey scale image and the recovered secret grey scale image. The lower value of MID, which is less than 30, indicates that there is poor diffusion between the original secret grey scale image and the recovered secret grey scale image. The value between 30 and 40 of MID indicates stable diffusion and encryption between the original secret grey scale image and the recovered secret grey scale image.
Table 4. Computations of the proposed VC system performance analysis on medical images (KBI dataset)
|
Medical Images |
Computations of the Proposed VC System Performance Metrics |
|||
|
PSNR |
MSE |
PDR |
MID |
|
|
1 |
38.1 |
12.8 |
90.3 |
33.7 |
|
2 |
39.2 |
11.9 |
93.1 |
32.9 |
|
3 |
38.2 |
12.3 |
92.8 |
32.7 |
|
4 |
38.1 |
12.8 |
93.2 |
33.8 |
|
5 |
36.9 |
11.6 |
93.7 |
33.1 |
|
6 |
37.1 |
11.7 |
93.2 |
33.8 |
|
7 |
38.0 |
12.9 |
92.7 |
33.2 |
|
8 |
37.5 |
12.1 |
93.8 |
32.9 |
|
9 |
37.1 |
11.8 |
93.2 |
33.8 |
|
10 |
36.9 |
11.3 |
93.7 |
33.2 |
|
Mean value |
37.7 |
12.12 |
92.97 |
33.31 |
Table 4 shows the computations of the proposed VC system performance analysis on medical images (KBI dataset). The proposed VisualNet-based VC system obtains 37.7 dB PSNR, 12.12 MSE, 92.97 PDR, and 33.31 MID for the medical images on KBI dataset.
In this manuscript, 10 images (both medical and non-medical cases) have been randomly selected from both datasets, and the proposed method has been tested on these images to obtain the experimental results. Similar experimental results (with minor variations) are also obtained by testing the proposed method on all the images in the specified dataset.
Table 5 shows the computations of the proposed VC system performance analysis on non-medical images (PR dataset). The proposed VisualNet-based VC system obtains 37.4dB PSNR, 12 MSE, 93.61 PDR, and 33.52 MID for the non-medical images on the PR dataset.
Table 6 shows the comparative analysis of the proposed VC system between datasets KBI and PR. From this detailed comparative analysis between the medical and non-medical imaging dataset images, the proposed VC system outperforms the performance with respect to all types of images in this research work.
Table 7 shows the performance comparisons of the proposed VC with other state-of-the-art methods on the KBI dataset. The simulation results of the proposed VisualNet-based VC system have been compared with the recent methodologies of Blesswin et al. [7], Ren and Zhang [8], Yang et al. [9], Wang et al. [10], and Ibrahim et al. [11] with respect to PSNR, MSE, PDR, and MID performance measures on the KBI dataset.
Table 5. Computations of the proposed VC system performance analysis on non-medical images (PR dataset)
|
Non-Medical Images |
Computations of the Proposed VC System Performance Metrics |
|||
|
PSNR |
MSE |
PDR |
MID |
|
|
1 |
36.9 |
11.8 |
93.2 |
33.8 |
|
2 |
37.1 |
11.4 |
93.7 |
33.2 |
|
3 |
37.6 |
12.7 |
93.2 |
32.9 |
|
4 |
37.3 |
12.3 |
94.2 |
32.1 |
|
5 |
37.1 |
11.7 |
94.1 |
33.8 |
|
6 |
38.2 |
10.9 |
93.8 |
33.2 |
|
7 |
38.1 |
12.7 |
93.2 |
33.7 |
|
8 |
37.6 |
12.1 |
93.7 |
34.2 |
|
9 |
36.9 |
11.8 |
93.2 |
34.7 |
|
10 |
37.2 |
12.6 |
93.8 |
33.6 |
|
Mean value |
37.4 |
12 |
93.61 |
33.52 |
Table 6. Comparative analysis of the proposed VC system between datasets KBI and PR (mean and standard deviation)
|
Performances Metrics |
Datasets |
|
|
KBI |
PR |
|
|
PSNR |
37.7 ± 0.31 |
37.4 ± 0.37 |
|
MSE |
12.12 ± 0.11 |
12 ± 0.12 |
|
PDR |
92.97 ± 0.23 |
93.61 ± 0.27 |
|
MID |
33.31 ± 0.21 |
33.52 ± 0.24 |
Table 7. Performance comparisons of the proposed VC with other state-of-the-art methods on the KBI dataset
|
Approaches |
Performances Metrics |
|||
|
PSNR |
MSE |
PDR |
MID |
|
|
Proposed VisualNet model |
37.7 |
12.12 |
92.97 |
33.31 |
|
Blesswin et al. [7] |
30.6 |
15.87 |
90.26 |
30.28 |
|
Ren and Zhang [8] |
29.6 |
18.32 |
87.87 |
29.12 |
|
Yang et al. [9] |
29.1 |
21.71 |
85.31 |
27.87 |
|
Wang et al. [10] |
28.7 |
24.87 |
83.29 |
26.19 |
|
Ibrahim et al. [11] |
28.4 |
26.98 |
81.09 |
25.98 |
Table 8 shows the performance comparisons of the proposed VC with other state-of-the-art methods on PR dataset. Simulation results of the proposed VisualNet-based VC system have been compared with the recent methodologies of Blesswin et al. [7], Ren and Zhang [8], Yang et al. [9], Wang et al. [10], and Ibrahim et al. [11] with respect to PSNR, MSE, PDR, and MID performance measures on KBI dataset.
Table 8. Performance comparisons of the proposed VC with other state-of-the-art methods on the PR dataset
|
Approaches |
Performances Metrics |
|||
|
PSNR |
MSE |
PDR |
MID |
|
|
Proposed VisualNet model |
37.4 |
12 |
93.61 |
33.52 |
|
Blesswin et al. [7] |
32.8 |
15.98 |
88.76 |
31.09 |
|
Ren and Zhang [8] |
31.9 |
16.25 |
86.20 |
29.65 |
|
Yang et al. [9] |
30.8 |
18.76 |
84.54 |
26.65 |
|
Wang et al. [10] |
29.6 |
20.54 |
81.09 |
24.17 |
|
Ibrahim et al. [11] |
29.5 |
23.10 |
79.37 |
23.87 |
In order to estimate the performance of the proposed VisualNet-based VC system with respect to the time period, the embedding time period of the generated binary share images into the source image has been computed, and it is measured in milliseconds (ms). It is the time taken by the proposed DOCE algorithm to embed the secret binary share images into the source image. It is given in the below Eq. (31).
Encryption time period $(t)=E_{\text {End}}-E_{\text {Start}}$ (31)
where, $E_{\text {Start}}$ is the starting time of the proposed DOCE algorithm and $E_{\text {End}}$ is the ending time of the proposed DOCE algorithm.
The computed encryption time period (t) should be low for real-time medical image processing and analysis processes. The proposed algorithm is faster when the computed ‘t’ should be low and the proposed algorithm is slow when the computed ‘t’ should be high.
Table 9 is the performance analysis of time period of the proposed VC system with respect to other approaches on KBI dataset. The proposed DOCE algorithm consumed 0.25 ms for the encryption process and also consumed 0.21 ms for the decryption process on KBI dataset images.
Table 10 is the performance analysis of the time period of the proposed VC system with respect to other approaches on the PR dataset. The proposed DOCE algorithm consumed 0.22 ms for the encryption process and also consumed 0.27 ms for decryption process on PR dataset images.
Table 9. Performance analysis of time period of the proposed VC system with respect to other approaches on Kaggle Brain Imaging (KBI) dataset
|
Approaches |
KBI Dataset |
|
|
Encryption Time Period (ms) |
Decryption Time Period (ms) |
|
|
Proposed VisualNet model |
0.25 |
0.21 |
|
Blesswin et al. [7] |
0.54 |
0.67 |
|
Ren and Zhang [8] |
0.97 |
0.81 |
|
Yang et al. [9] |
1.25 |
1.20 |
|
Wang et al. [10] |
1.56 |
1.43 |
|
Ibrahim et al. [11] |
1.77 |
1.68 |
Table 10. Performance analysis of time period of the proposed VC system with respect to other approaches on PR dataset
|
Approaches |
PR Dataset |
|
|
Encryption Time Period (ms) |
Decryption Time Period (ms) |
|
|
Proposed VisualNet model |
0.22 |
0.27 |
|
Blesswin et al. [7] |
0.68 |
0.76 |
|
Ren and Zhang [8] |
0.79 |
0.85 |
|
Yang et al. [9] |
0.91 |
0.98 |
|
Wang et al. [10] |
1.23 |
1.34 |
|
Ibrahim et al. [11] |
1.67 |
1.78 |
The methodologies used in the conventional approaches Blesswin et al. [7], Ren and Zhang [8], Yang et al. [9], Wang et al. [10], and Ibrahim et al. [11] are applied on the datasets KBI and PR, and the experimental results (PSNR, MSE, PDR, and MID) of these conventional methods are noted in Tables 6 and 7. Moreover, the encryption and decryption time periods of the proposed method are compared with the time periods of the conventional methods using the same datasets and hardware platform. Hence, the experimental results of both proposed and conventional methods are comparable with respect to PSNR, MSE, PDR, and MID with encryption and decryption time periods.
The original image size is 256 KB, and the compressed image size is 51.2 KB with a compression ratio of 5:1 and a bit per pixel is 1.6 bpp.
In this article, the VisualNet DL model-based encryption algorithm with a compression technique has been proposed to strengthen the image security system. The proposed system has been tested on two different datasets KBI and PR with respect to medical and non-medical images. This proposed system has been simulated, and its performance has been measured with respect to various parameter metrics PSNR, MSE, PDR, and MID, along with the encryption and decryption time period. The proposed VisualNet-based VC system obtains 37.7 dB PSNR, 12.12 MSE, 92.97 PDR, and 33.31 MID for the non-medical images on the KBI dataset. The proposed VisualNet-based VC system obtains 37.4dB PSNR, 12 MSE, 93.61 PDR, and 33.52 MID for the medical images on the PR dataset. The proposed DOCE algorithm consumed 0.25 ms for the encryption process and also consumed 0.21 ms for the decryption process on KBI dataset images. The proposed DOCE algorithm consumed 0.22ms for the encryption process and also consumed 0.27ms for the decryption process on PR dataset images. Even though this proposed method has advantages over conventional systems, it has certain limitations as stated below.
Conflict of interest: The authors declare that they have no conflict of interest.
Funding declarations: This research received no specific grant from any funding agency in the public, commercial, or not-for-profit sectors.
Data availability:
The datasets used in this study were obtained from the open-access dataset available in the following links: (Accessed: 12-1-2026)
We thank the supervisor of this research work and my friends who supports to bring this research work in an effective manner.
[1] Li, M., Fan, H., Ren, H., Lu, D., Xiao, D., Li, Y. (2018). Meaningful image encryption based on reversible data hiding in compressive sensing domain. Security and Communication Networks, 2018(1): 9803519. https://doi.org/10.1155/2018/9803519
[2] Wang, H., Xiao, D., Li, M., Xiang, Y., Li, X. (2019). A visually secure image encryption scheme based on parallel compressive sensing. Signal Processing, 155: 218-232. https://doi.org/10.1016/j.sigpro.2018.10.001
[3] Wen, W., Hong, Y., Fang, Y., Li, M., Li, M. (2020). A visually secure image encryption scheme based on semi-tensor product compressed sensing. Signal Processing, 173: 107580. https://doi.org/10.1016/j.sigpro.2020.107580
[4] Song, W., Fu, C., Zheng, Y., Zhang, Y., Chen, J., Wang, P. (2024). Batch image encryption using cross image permutation and diffusion. Journal of Information Security and Applications, 80: 103686. https://doi.org/10.1016/j.jisa.2023.103686
[5] Magdy, M., Hosny, K.M., Ghali, N.I., Ghoniemy, S.J.M.T. (2022). Ensuring security of medical images for telemedicine: A methodical review. Multimedia Tools and Applications, 81: 25101-25145.
[6] Hasan, M.K., Islam, S., Sulaiman, R., et al. (2021). Lightweight encryption technique to enhance medical image security on internet of medical things applications. IEEE Access, 9: 47731-47742. https://doi.org/10.1109/ACCESS.2021.3061710
[7] Blesswin, A.J., Mary, G.S., Sankaranarayanan, S., Khan, A.R., Sait, A.R.W., Lorenz, P. (2025). Lightweight semantic compression visual cryptography for secure medical image transmission in IoT systems. Scientific Reports, 16(1): 1498. https://doi.org/10.1038/s41598-025-31947-6
[8] Ren, L., Zhang, D. (2025). Integrating visual cryptography for efficient and secure image sharing on social networks. Applied Sciences, 15(8): 4150. https://doi.org/10.3390/app15084150
[9] Yang, C.N., Wu, X., Chung, M.J. (2023). Enhancement of information carrying and decoding for visual cryptography with error correction. ACM Transactions on Multimedia Computing, Communications and Applications, 20(1): 1-24. https://doi.org/10.1145/3612927
[10] Wang, Q., John, B.A., Manoranjitham, T., Akilandeswari, P., Selva, M.G. (2023). Securing image-based document transmission in logistics and supply chain management through cheating-resistant visual cryptographic protocols. Mathematical Biosciences and Engineering, 20(11): 19983-20001. https://doi.org/10.3934/mbe.2023885
[11] Ibrahim, D., Sihwail, R., Arrifin, K.A.Z., Abuthawabeh, A., Mizher, M. (2023). A novel color visual cryptography approach based on Harris Hawks optimization algorithm. Symmetry, 15(7): 1305. https://doi.org/10.3390/sym15071305
[12] Nickparvar, M. (2026). Brain tumor MRI dataset. Kaggle. https://doi.org/10.34740/kaggle/dsv/14832123
[13] Jeno Jasmine, J., Dhinakaran, D., Gopalakrishnan, S., Ramathilagam, A. (2026). An adaptive cryptographic fusion framework for secure and efficient medical image encryption. Scientific Reports, 16(17396): 1-18. https://doi.org/10.1038/s41598-026-48170-6
[14] Mahalakshmi, K., Nagarajan, S. (2026). Deep reinforcement learning–based reversible medical image encryption framework for secure IoMT environments. Frontiers in Artificial Intelligence, 9: 1839687. https://doi.org/10.3389/frai.2026.1839687
[15] Duggirala, S.K., Sathya, M. (2026). A hybrid deep learning framework utilizing CNN, GAN, and autoencoder for safe medical image encryption in IoMT. Engineering Research Express, 8(2): 025233. https://doi.org/10.1088/2631-8695/ae3881
[16] Rosaline, S., Paulraj, D. (2025). Deep learning-based compression and encryption of CT images for secure telemedicine applications. Evolving Systems, 16(1): 29. https://doi.org/10.1007/s12530-024-09652-y
[17] Wu, X., Chen, Z., Liu, T., et al. (2025). An efficient chaos-based color image compression and encryption scheme using compressed sensing and Hachimoji DNA. Physica Scripta, 100(8): 085262. https://doi.org/10.1088/1402-4896/adf809
[18] Fu, Z., Li, X., Fang, L., Feng, Y., Yu, B. (2024). Security issues in visual cryptography scheme with known random number sequence. Journal of King Saud University Computer and Information Sciences, 36(3): 101983. https://doi.org/10.1016/j.jksuci.2024.101983
[19] Gilmolk, A.M.N., Aref, M.R. (2024). Lightweight image encryption using a novel chaotic technique for the safe Internet of things. International Journal of Computational Intelligence Systems, 17(1): 146. https://doi.org/10.1007/s44196-024-00535-3
[20] Purnamasari, D., Herlinudinkhaji, D., Dewi, A.K., Mauludin, M.Z. (2024). Foveal avascular zone image encryption using pixel scrambling combination technique for medical image security. Jurnal Infotel, 16(1): 44-57. https://doi.org/10.20895/infotel.v16i1.102