Saif S. Al-Jaboriy
© 2026 The author. This article is published by IIETA and is licensed under the CC BY 4.0 license (http://creativecommons.org/licenses/by/4.0/).
OPEN ACCESS
Breast cancer screening relies heavily on accurate mammographic interpretation, yet automated lesion analysis remains challenging due to low contrast, dense breast tissue, imaging artefacts, and diverse lesion morphology. This study proposes a transformer-augmented U-Net++ framework for simultaneous lesion segmentation, quantitative measurement, and three-class diagnosis in digital mammography. The proposed framework integrates adaptive Wiener filtering, contrast-limited adaptive histogram equalization (CLAHE), and pectoral muscle attenuation for image preprocessing, followed by multi-scale lesion representation through a nested U-Net++ decoder and Transformer-based contextual refinement. A segmentation-guided diagnostic module is introduced to ensure that lesion delineation and diagnostic prediction are derived from consistent feature representations. Experiments were conducted on 2,173 annotated mammograms from the Curated Breast Imaging Subset of the Digital Database for Screening Mammography (CBIS-DDSM) using patient-level stratified 10-fold cross-validation. The proposed method achieved 93.1% accuracy, 92.2% sensitivity, 93.8% specificity, a Dice similarity coefficient (DSC) of 0.912, and an Intersection over Union (IoU) of 0.882. Ablation experiments demonstrated the contribution of preprocessing, Transformer-based feature refinement, and segmentation-guided diagnosis. Lesion measurement errors remained below 4.1% across different lesion categories. However, validation was performed on a single public dataset, and further evaluation using multi-center datasets and radiologist studies is required before clinical deployment.
digital mammography, breast lesion segmentation, transformer-augmented U-Net++, quantitative lesion measurement, computer-aided diagnosis, deep learning
Breast cancer is the most frequently diagnosed malignancy among women worldwide, with an estimated 2.3 million new cases and 666,000 deaths recorded in 2022 [1]. Mammography remains the reference examination in population screening programmes, but its sensitivity falls appreciably in women with dense fibro-glandular tissue, in whom lesion contrast against the surrounding parenchyma is low and supplementary imaging is increasingly recommended [2]. Comparative evaluations of mammography, ultrasound, and magnetic resonance imaging confirm that diagnostic performance depends strongly on lesion type, breast density, and patient history, which places a premium on the quality of the image analysis applied to the mammogram itself [3].
Nevertheless, the automatic processing and analysis of mammograms remains problematic. Factors such as low image contrast, overlapping tissues, image noise, dense breast tissue, and morphologically diverse tumours complicate automated interpretation [4, 5]. All these factors degrade measurement quality, segmentation accuracy, and the reliability of lesion classification. A mammographic analysis framework intended for measurement purposes must therefore be assessed not only on classification accuracy but also on the fidelity of the quantities it reports.
Advances in artificial intelligence, deep learning, and quantitative imaging have made automated analysis viable in biomedical measurement and diagnostic settings [6]. Computer-aided diagnostic (CAD) systems assist radiologists in lesion detection, classification, segmentation, and feature extraction [7]. Their performance, however, depends heavily on the quality of image pre-processing, segmentation, and feature representation, so preprocessing and enhancement remain indispensable stages of any mammographic analysis pipeline.
A wide variety of image processing techniques have been developed to improve mammogram quality and to reduce imaging artefacts. Filtering methods such as Gaussian, Wiener, median, and fuzzy filtering are commonly applied to attenuate stochastic noise while preserving lesion margins [8]. Adaptive contrast enhancement algorithms, such as contrast-limited adaptive histogram equalization (CLAHE), are widely used to recover local contrast in dense tissue prior to lesion analysis, and encoder-decoder networks trained on contrast-enhanced mammograms have reported substantial gains in mass delineation accuracy [9]. The parameterization of that operator is itself consequential, since the clip limit and the tile size together govern the trade-off between recovery of local detail and amplification of noise; observer studies on dense mammograms have shown that the detectability of subtle spiculated features depends directly on how these two parameters are set, and that evidence informed the clip-limit and tile-size selection strategy adopted in previous studies [9-11]. Even so, most published enhancement pipelines still tend to over-amplify dense fibro-glandular regions. Many methods also fail to suppress the pectoral muscle adequately; its intensity range overlaps that of true lesions, and it remains a recognized source of false-positive detections, which dedicated edge-based and interpolation-based removal pipelines have been shown to reduce substantially [10, 12].
Segmentation is the other decisive stage, because accurate delineation of the lesion boundary conditions both the diagnostic decision and every quantity derived from it. Thresholding and region-growing methods generally fail on dense breast tissue, where the intensities of normal parenchyma and suspicious lesions overlap [13]. Convolutional neural networks (CNNs) have displaced these methods, and the U-Net encoder-decoder in particular has become the reference architecture for biomedical segmentation [14]. Its nested variant, U-Net++, introduces dense skip pathways that narrow the semantic gap between encoder and decoder features and preserve fine lesion detail more effectively than the original design [12, 15].
Although CNNs perform well on segmentation tasks, their finite receptive fields limit their ability to model long-range spatial relations and context-dependent features in medical images. Transformer-based models address this limitation directly [16, 17], and combining convolutional and attention-based operators allows both morphological detail and contextual relations in mammograms to be represented [18].
However, some problems are still prevalent in existing CAD systems. Namely, most studies are focused only on classification accuracy without any consideration for computational efficiency, reliability of measurements, and diagnostic consistency [19]. Some segmentation frameworks still experience the problem of erroneous results, lack of appropriate feature extraction, failure to adequately suppress background structures like the pectoral muscle region, and too many false positives [20]. From a medical instrumentation point of view, reliable lesion quantification, segmentation accuracy, and computational reliability are crucial.
Hybrid CNN-Transformer models are, however, no longer novel in themselves, and their transfer to mammography is not straightforward. Architectures such as TransUNet were designed for computed tomography, where target structures are comparatively large, well contrasted, and anatomically constrained. Mammographic lesions occupy a small fraction of the image, frequently exhibit intensity values overlapping those of the surrounding fibro-glandular tissue, and, in the case of micro-calcification clusters, span only a few pixels. Patch-based tokenization applied at the coarse bottleneck resolution used in those models discards precisely the high-frequency information on which such lesions depend. A second limitation is that existing hybrids are optimized for a single task. Segmentation networks are not required to produce a calibrated diagnostic decision, whereas classification networks provide no delineation from which quantitative measurements can be derived. When the two functions are assigned to separate models, the measurements reported to the radiologist are not guaranteed to be consistent with the diagnostic output, which is a material weakness in a measurement-oriented system.
The present work addresses these gaps. Its contribution is not the pairing of a Transformer with a U-Net++ backbone as such, but three specific design decisions. First, the Transformer encoder is applied to the fused multi-scale decoder features rather than to the encoder bottleneck, so that long-range context is modelled at a resolution where lesion margins are still resolved. Second, the predicted lesion probability map gates the features passed to the diagnostic head, which places segmentation and classification inside a single optimization problem and ensures that the reported measurements and the reported diagnosis refer to the same delineation. Third, the preprocessing stage is parameterized against the two failure modes specific to mammography, namely over-enhancement of dense fibro-glandular tissue and pectoral muscle intensity overlap, and every parameter is reported. The scope of the study is correspondingly restricted to lesion delineation, lesion measurement, and three-class diagnosis on digital mammograms, and the title has been narrowed to match that scope.
The framework was evaluated on the Curated Breast Imaging Subset of the Digital Database for Screening Mammography (CBIS-DDSM) benchmark using case-level stratified 10-fold cross-validation, with an ablation study isolating the contribution of each component and with every baseline retrained under the same protocol. Performance is reported in terms of classification accuracy, sensitivity, specificity, precision, F1-score, Dice similarity coefficient (DSC), and Intersection over Union (IoU), together with lesion measurement error and a subgroup analysis by breast density and lesion.
The main contributions of this study are:
(1) A three-stage preprocessing pipeline for mammographic denoising, clip-limited local contrast enhancement, and pectoral muscle attenuation, with all operating parameters reported for reproducibility.
(2) A nested multi-scale U-Net++ segmentation backbone with deep supervision at four decoder scales.
(3) A Transformer encoder applied to the fused multi-scale decoder features, together with a segmentation-gated diagnostic head that keeps delineation and classification mutually consistent.
(4) Explicit definitions of the reported measurement quantities, including lesion area error, boundary error, and detection rate, together with the pixel-to-millimetre conversion and the reference masks used to compute them.
(5) An ablation study isolating the contribution of each module, and a comparison against baselines retrained under identical case-level splits and preprocessing conditions.
2.1 Dataset, data partitioning, and experimental setup
The framework was evaluated on the CBIS-DDSM, one of the most widely used public benchmarks for mammographic image analysis. The subset used here contains 2,173 annotated mammograms, of which 1,326 are labelled benign and 847 malignant, and includes both mass and calcification lesion types. Every image is distributed with an expert region-of-interest mask and lesion boundary coordinates, which provide the reference against which both segmentation and measurement accuracy are computed.
Each mammogram from the CBIS-DDSM dataset was acquired through standardized procedures in full-field digital mammography and consists of region-of-interest (ROI) annotation data along with the lesion boundary coordinates. This will allow us to conduct reproducible experiments and compare results with state-of-the-art techniques in mammographic image classification.
Stratified 10-fold cross-validation was used to obtain stable performance estimates. Partitioning was performed at the case (patient) level rather than at the image level: all images belonging to the same patient, including the craniocaudal and mediolateral oblique (MLO) views of both breasts, were assigned to the same fold. This prevents different views of the same lesion from appearing simultaneously in the training and test partitions, which would otherwise yield an optimistically biased estimate through data leakage. The 2,173 annotated images correspond to 1,566 distinct cases. Stratification was applied to the case-level benign/malignant label, so the class proportions of the full dataset are preserved in every fold. Fold assignments were generated once and reused without modification for the proposed framework and for every baseline.
All experiments were implemented in MATLAB R2022a (Deep Learning Toolbox and Image Processing Toolbox) under Windows 11. Network training and GPU inference were performed on an NVIDIA GeForce RTX 3090 graphics processing unit with 24 GB GDDR6X memory (CUDA 11.6, cuDNN 8.4). The CPU timings reported in Table 1 were obtained on an Intel Core i7-4770 processor at 3.40 GHz with 16 GB of system RAM, with GPU acceleration disabled. Training used the Adam optimizer with an initial learning rate of 1 × 10⁻⁴, reduced by a factor of 0.1 every 20 epochs, a mini-batch size of 8, and a maximum of 80 epochs with early stopping after 10 epochs without improvement in validation loss. All images were resized to 512 × 512 pixels. Augmentation comprised horizontal flipping, rotation within ±15 degrees, and intensity scaling within ±10%. Every compared architecture was trained from scratch on the same folds, with the same preprocessing pipeline, augmentation policy, and optimization schedule. The values in Table 2 are therefore measured under a common protocol and are not transcribed from the original publications, which makes the comparison directly interpretable.
Table 1. Computational cost and inference time
|
Framework |
Parameters (M) |
Floating-Point Operations (G) |
Graphics Processing Unit (GPU) (s/image) |
Central Processing Unit (CPU) (s/image) |
Memory (MB) |
|
U-Net [13] |
31.0 |
45.1 |
0.31 |
1.84 |
1240 |
|
U-Net++ [12] |
34.2 |
51.7 |
0.42 |
2.15 |
1460 |
|
DenseNet121 [20] |
8.1 |
22.6 |
0.19 |
1.12 |
980 |
|
TransUNet [21] |
105.3 |
88.9 |
0.66 |
3.05 |
2210 |
|
Bi-CBMSegNet [18] |
39.8 |
62.4 |
0.71 |
3.26 |
1980 |
|
Proposed framework |
36.5 |
57.3 |
0.58 |
2.64 |
1735 |
Table 2. Comparative diagnostic and segmentation performance on Curated Breast Imaging Subset of the Digital Database for Screening Mammography (CBIS-DDSM) under case-level stratified 10-fold cross-validation
|
Method |
Accuracy (%) |
Sensitivity (%) |
Specificity (%) |
Precision |
F1-Score |
Dice Similarity Coefficient (DSC) |
Intersection over Union (IoU) |
|
U-Net [13] |
85.4 |
83.2 |
86.9 |
0.850 |
0.841 |
0.812 |
0.754 |
|
U-Net++ [12] |
87.1 |
85.8 |
88.4 |
0.864 |
0.861 |
0.865 |
0.812 |
|
DenseNet121 [20] |
88.3 |
87.2 |
89.1 |
0.886 |
0.879 |
0.881 |
0.826 |
|
TransUNet [21] |
90.4 |
89.2 |
91.1 |
0.910 |
0.901 |
0.894 |
0.861 |
|
Bi-CBMSegNet [18] |
91.2 |
90.1 |
92.4 |
0.923 |
0.912 |
0.903 |
0.871 |
|
Proposed framework |
93.1 |
92.2 |
93.8 |
0.932 |
0.927 |
0.912 |
0.882 |
2.2 Overview of the proposed framework
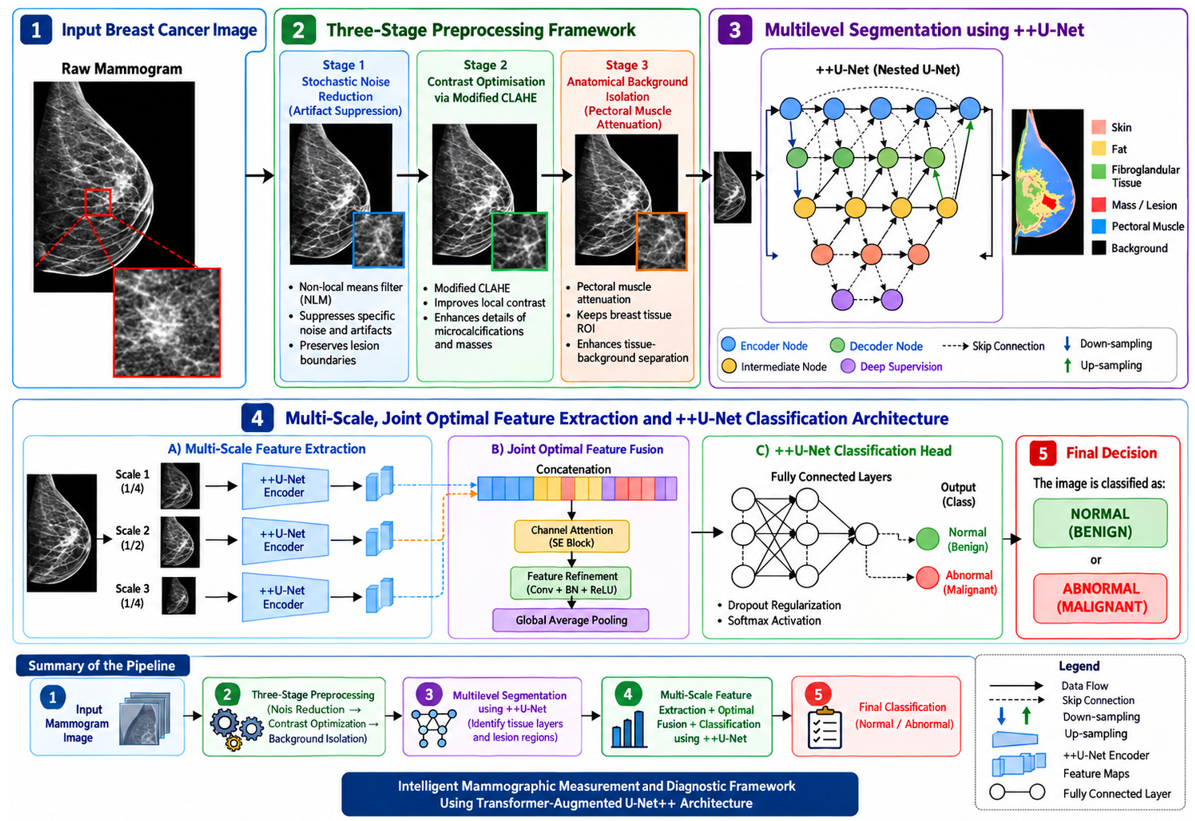
The framework couples four stages into a single trainable pipeline: hierarchical preprocessing, nested multi-scale segmentation, Transformer-based contextual refinement, and segmentation-gated diagnostic classification. Lesion measurements are derived from the same probability map that drives the diagnostic decision, so the quantitative and categorical outputs cannot disagree.
The overall framework consists of four sequential processing stages:
(1) Mammographic image preprocessing and quality enhancement.
(2) Multiscale nested lesion segmentation using U-Net++.
(3) Feature extraction at multiple scales along with contextual analysis using transformers.
(4) Quantification of lesions and their diagnosis.
The overall workflow of the proposed architecture is illustrated in Figure 1.
Figure 1. Architecture of the proposed transformer-augmented U-Net++ framework for joint lesion segmentation, measurement, and diagnosis
2.3 Three-stage mammographic image preprocessing
Preprocessing determines much of what follows, because segmentation quality and the reliability of the derived measurements depend directly on image clarity, tissue contrast, and artefact suppression. A three-stage pipeline was therefore applied before segmentation. Its complete parameter set is given in Table 3.
Table 3. Comparative quantitative performance evaluation on the Curated Breast Imaging Subset of the Digital Database for Screening Mammography (CBIS-DDSM) dataset
|
Stage |
Parameter |
Value |
Basis for Selection |
|
Noise reduction |
Filter type |
Adaptive Wiener |
Preserves margins better than Gaussian smoothing |
|
|
Local window |
5 × 5 pixels |
Grid search over 3 × 3, 5 × 5, 7 × 7 |
|
|
Noise variance |
Mean local variance |
Estimated per image inside the breast mask |
|
CLAHE |
Tile grid |
8 × 8 |
Grid search over 4 × 4, 8 × 8, 16 × 16 |
|
|
Clip limit c |
0.01 |
Grid search over 0.005–0.030; fixed for all tiles |
|
|
Grey levels G |
256 |
8-bit quantization after normalization |
|
|
Redistribution |
Uniform |
Standard clip-limited formulation |
|
|
Tile interpolation |
Bilinear |
Removes inter-tile block artefacts |
|
Pectoral muscle |
Search region |
Upper 40% of height × 40% of width |
Covers every MLO view in the dataset |
|
|
Initial threshold |
Otsu, region-restricted |
Parameter-free |
|
|
Region-growing tolerance |
0.08 (normalized) |
Grid search over 0.04–0.12 |
|
|
Morphological closing |
Disk, radius 5 px |
Removes residual holes in the mask |
|
|
Boundary regularization |
Hough, 1° angular resolution |
Enforces a near-linear boundary |
|
Common |
Output resolution |
512 × 512 pixels |
Compromise between detail and memory |
2.3.1 Stochastic noise reduction
The first step attenuates stochastic noise and digitisation artefacts without degrading diagnostically relevant tissue structure or lesion margins. A breast mask was first obtained by Otsu thresholding of the image background, and an adaptive Wiener filter was then applied inside that mask only, so that background pixels did not bias the local intensity statistics. The filter estimates the local mean and variance over a sliding window of 5 × 5 pixels and attenuates each pixel in proportion to the ratio between the estimated noise variance and the local variance; the noise variance was taken as the mean of the local variances computed over the breast region. Because attenuation is inversely proportional to local variance, high-variance structures such as spiculated margins and micro-calcification clusters are largely preserved while homogeneous regions are smoothed.
2.3.2 Contrast enhancement using contrast-limited adaptive histogram equalization
The second stage performs localized contrast enhancement using CLAHE. The image is divided into non-overlapping tiles; within each tile t, the intensity histogram $h_c^{(t)}(k)$, k = 0, ..., G–1, is clipped at a fixed fraction of the tile population and the excess is redistributed uniformly across all bins, which limits the amplification of noise in low-contrast dense tissue:
$\begin{gathered}h_c^{(t)}(k)=\min \left\{h^{(t)}(k), c \cdot N_t\right\}+E_t / G, \\ E_t=\Sigma_j \max \left\{0, h^{(t)}(j)-c \cdot N_t\right\}\end{gathered}$ (1)
where, $h^{(t)}$ and $h_c^{(t)}$ are the original and clipped histograms of tile $t$, $N_t$ is the number of pixels in that tile, $G$ is the number of grey levels, c is the normalised clip limit, and $E_t$ is the total excess removed by clipping, which is redistributed equally over the G bins. Clipping bounds the local slope of the transfer function, and hence the maximum contrast gain, while redistributing the clipped excess uniformly over all bins preserves the tile population exactly, so that $h_c^{(t)}$ sums to $N_t$. The clipped histogram defines a tile-specific cumulative mapping $T_t$, and the enhanced intensity of each pixel is obtained by bilinear interpolation between the mappings of the neighbouring tile centres, which removes the block artefacts produced by plain adaptive histogram equalisation:
$\begin{gathered}I_{e n h}(x, y)=\Sigma_{t \in N(x, y)} w_t(x, y) \cdot T_t\left(I_{i n}(x, y)\right), \\ T_t(k)=\left(\frac{(G-1)}{N_t}\right) \Sigma_{j \leq k} h_c^{(t)}(j)\end{gathered}$ (2)
where, $I_{i n}$ and $I_{e n h}$ are the input and enhanced images, $N(x, y)$ is the set of at most four tile centres surrounding pixel (x,y), and the bilinear weights $w_t$ sum to unity; along the image borders, where fewer than four neighbours exist, the mapping of the nearest available tile is replicated. The scheme above is the standard clip-limited formulation with a uniform redistribution target. A single fixed clip limit is applied to every tile of every image; no image-adaptive or tile-adaptive modification of c is used, and the parameter values are given in Table 3.
This stage improves the visibility of small masses and of micro-calcification clusters that would otherwise be obscured by dense fibro-glandular tissue, while the clip limit prevents the over-enhancement associated with unconstrained histogram equalization.
2.3.3 Pectoral muscle attenuation
The third step attenuates the pectoral muscle, whose high intensity range overlaps that of true lesions and is a recognized source of false-positive segmentation [10]. It is applied to MLO views only; craniocaudal views pass through unchanged. Breast orientation is determined from the column-wise intensity sums, and a triangular search region is defined that covers the upper 40% of the image height and the 40% of its width lying on the chest-wall side. The two thresholds serve distinct purposes. Otsu's method, restricted to that region, provides a global upper bound on the intensities admissible as muscle and thereby fixes the seed, taken as the brightest pixel of the chest-wall corner. Seeded region growing then expands from that seed under 8-connectivity, admitting a neighboring pixel when its intensity differs from the running region mean by less than 0.08 on the normalized range and simultaneously satisfies the Otsu bound. The resulting mask is closed morphologically with a disk structuring element of radius 5 pixels, and the muscle boundary is regularized by straight-line fitting with the Hough transform at 1-degree angular resolution. Pixels inside the final mask are replaced by the mean intensity of the adjacent breast tissue rather than by zero, which avoids introducing an artificial high-contrast edge that the segmentation network would otherwise learn to follow.
All parameters were selected once, using only the training partitions of the first cross-validation fold, and were then held fixed for every fold and every compared architecture.
2.4 Nested multi-scale segmentation using U-Net++
The proposed framework uses the U-Net++ architecture for its segmentation process in order to produce accurate delineation and feature extraction from lesions. Unlike U-Net, U-Net++ consists of dense skip connections, which help reduce the gap between the encoder and the decoder features.
Let $x^{i, j}$ denote the feature map at node $(i, j)$ within the nested architecture. The feature propagation mechanism is expressed as:
$x^{i, j}=H\left(\left[x^{i, k}\right]_{k=0}^{j-1}, u\left(x^{i+1, j-1}\right)\right)$ (3)
where, i indexes the encoder down-sampling level, j indexes the position along the nested skip pathway, H(.) denotes a convolution block consisting of two 3 × 3 convolutions, each followed by batch normalization and a Rectified Linear Unit (ReLU) activation, the square brackets denote channel-wise concatenation of the enclosed feature maps, and u(.) denotes bilinear up-sampling by a factor of two. The node $x^{(i, 0)}$ corresponds to the encoder output at level i.
The nested connectivity structure enables effective multi-scale feature fusion and improves lesion boundary preservation in heterogeneous mammographic environments.
To improve segmentation convergence and multi-scale consistency, deep supervision was incorporated into the decoder pathway using multiple auxiliary segmentation outputs. The overall segmentation loss function is defined as:
$L_{\mathrm{DS}}=\sum_{s=1}^s \lambda_s L_{s e g}^{(s)}$ (4)
where, $L_{\mathrm{DS}}$ denotes the deep-supervision aggregation of the segmentation loss, S is the number of supervised decoder scales, $L_{s e g}^{(s)}$ is the segmentation loss evaluated at scale s against the reference mask down-sampled to that resolution, and $\lambda_s$ is the corresponding weighting coefficient. Here, S = 4 and $\lambda_s=0.4,0.3,0.2,0.1$ from the finest to the coarsest scale, so that the coefficients sum to unity and the finest scale dominates the gradient. $L_{\mathrm{DS}}$ is an aggregation rule rather than a loss in its own right: it is applied to each of the two segmentation terms of the composite objective of Section 2.8, which is a different quantity, denoted $L_{total}$ in Eq. (10).
2.5 Multi-scale feature extraction
After obtaining the lesions in segmentation, features were hierarchically extracted from different levels of the decoder layers in the U-Net++ model. Fusion was performed by means of weighting different spatial-resolution feature maps in order to maintain both local and global information.
The multi-scale feature fusion process is expressed as:
$F_{ {fused }}=\sum_{l=1}^L w_l \phi_l\left(F_l\right), \sum_{l=1}^L w_l=1$ (5)
where, L = 4 is the number of decoder scales entering the fusion, $F_l$ is the feature map extracted at scale l after resampling to the finest common resolution, $\phi_l$ is a 1 × 1 convolutional projection mapping every scale to a common channel dimension C = 64, and $w_l$ is a learned aggregation weight obtained through a Softmax over L unconstrained parameters, which guarantees non-negative weights summing to unity.
This strategy improves quantitative lesion characterization across multiple spatial resolutions.
2.6 Transformer-based contextual refinement
The fused feature map $F_f$ used is refined by a Transformer encoder that models spatial dependencies that convolutional operators with a finite receptive field cannot represent. Ffused, of size $H_f \times W_f \times C$, is divided into non-overlapping patches of 2 × 2 pixels; each patch is linearly projected to a token of dimension d = 256, and a learnable positional embedding is added, giving a token sequence Z of length $N=H_f \cdot W_f / 4$. Multi-head self-attention (MHSA) over Z is defined as:
$MHSA(Z) = Concat\left(\right.head_1, \ldots, head\left._H\right) W^O$ (6)
where, $head _h={Attention}\left(Z W_h^Q, Z W_h^K, Z W_h^V\right)$, H = 8 is the number of heads, $W_h^Q, W_h^K$ and $W_h^V$ are the per-head query, key, and value projection matrices of size $d \times d_k, W^o$ of size d × d is the output projection, and $d_k=d / H=32$. The attention operator itself is the scaled dot product:
${Attention}(Q, K, V)={Softmax}\left(\frac{Q K^T}{\sqrt{d_k}}\right) V$ (7)
where, Q, K, and V are the projected query, key, and value matrices, and the scaling by the square root of $d_k$ keeps the Softmax argument numerically stable. The encoder comprises 4 identical blocks, each consisting of MHSA and a two-layer feed-forward network with expansion ratio 4, both preceded by layer normalisation and wrapped in residual connections. The output is reshaped back to the spatial grid and denoted ZT. Because the encoder operates on the fused decoder features rather than on the encoder bottleneck, boundary detail is retained while long-range context is added.
2.7 Coupling between segmentation and diagnostic classification
The diagnostic head operates neither on the raw mammogram nor on a re-cropped image patch. It operates on the Transformer-refined feature map ZT, pooled under the control of the segmentation output of the same network. Let P denote the lesion probability map produced at the finest decoder scale and resampled by bilinear interpolation onto the token grid on which ZT is defined, so that the two are spatially aligned. Writing Ω for that grid, the classification descriptor is formed by two complementary pooling operations:
$\begin{aligned} \Phi\left(Z_T\right) & =\left[v_{g l o b} ; v_{l e s}\right], v_{g l o b}=\left(\frac{1}{|\Omega|}\right) \Sigma_{\Omega} Z_T(x, y), \\ v_{l e s} & =\Sigma_{\Omega} P(x, y) Z_T(x, y) /\left(\Sigma_{\Omega} P(x, y)+\varepsilon\right)\end{aligned}$ (8)
where, the summations run over all positions (x,y) of the grid Ω. The first component, $v_{g l o b}$, is the conventional average of ZT over the |Ω| positions; the second, $v_{les}$, is the average of ZT weighted by the lesion probability, with ε = 10⁻⁶ preventing division by zero. The semicolon denotes concatenation along the channel dimension, so $\Phi\left(Z_T\right)$ has 2C components, and the classification weight matrix is correspondingly of size 3 × 2C.
The separation into two branches is deliberate, and each serves a distinct purpose. The global branch preserves contextual cues that are not confined to the lesion, such as overall parenchymal density and bilateral asymmetry; the lesion branch describes the delineated region itself. A simpler alternative, gating the feature map multiplicatively and then applying a single global average pooling, was considered and rejected. Under that scheme, the lesion contribution enters the pooled descriptor with a weight equal to the lesion area fraction, and since mammographic lesions typically occupy less than two per cent of the breast area, the lesion-specific signal would be attenuated by a factor of fifty or more relative to the background; the coupling would then be numerically inert regardless of how well the segmentation branch performed. Normalizing by the mass of the probability map, as in the second branch of Eq. (8), removes that dependence, so that a small lesion and a large one contribute descriptors of comparable magnitude.
Because P appears in both the numerator and the denominator of $v_{les}$, the gradient of the classification loss propagates back into the segmentation branch, and the two tasks are therefore optimised jointly rather than independently. The behaviour in the absence of a lesion follows from the same expression without any separate decision rule: as the mass of P tends to zero, $v_{les}$ tends to zero, and the decision rests entirely on the global descriptor, which is the intended limit. The diagnostic class is consequently always taken from the SoftMax output, and no hard threshold is imposed on top of it:
$\hat{y}={SoftMax}\left(W_c \cdot \Phi\left(Z_T\right)+b_c\right)$ (9)
where, $W_c$ and $b_c$ are the learnable weight matrix and bias of the classification layer, of sizes 3 × 2C and 3, respectively, and the output vector contains the posterior probabilities of the three diagnostic classes. Because the lesion measurements reported in Section 3 are computed from the same map P that defines $v_{les}$, the quantitative and the diagnostic outputs always refer to the same delineation.
The classification stage therefore assigns each mammogram to one of three diagnostic classes:
(1) Normal
(2) Benign
(3) Malignant
2.8 Composite optimization loss function
The entire model was trained using an end-to-end optimization approach employing an objective function that combines both losses of segmentation and classification:
$L_{ {total }}=\alpha L_{ {Dice }}+\beta L_{C E}^{ {seg }}+\gamma L_{C E}^{c l s}$ (10)
where,
• $L_{Dice}$ represents the Dice overlap loss,
• $L_{C E}^{{seg}}$ denotes segmentation cross-entropy loss,
• $L_{C E}^{c l s}$ corresponds to classification cross-entropy loss,
•α, β and $\gamma$ are weighting coefficients.
The Dice term is defined over the predicted probability map p and the binary reference mask g as:
$L_{ {Dice }}=1-\left(2 \Sigma_i p_i g_i+\varepsilon\right) /\left(\Sigma_i p_i+\Sigma_i g_i+\varepsilon\right)$ (11)
with ε = 1 included to keep the expression defined for empty masks, $L_C E^{ {seg }}$ and $L_C E^{c l s}$ are the standard pixel-wise and image-level cross-entropy terms. Both segmentation terms, $L_{{Dice }}$ and $L_C E^{ {seg }}$, are aggregated over the S supervised decoder scales with the weights $\lambda_s$ of Eq. (4) before entering Eq. (10), whereas the classification term is evaluated once, at image level. The weighting coefficients were fixed at α = 0.5, β = 0.3 and γ = 0.2, selected by grid search on the validation partitions of the first fold and then held constant for all subsequent experiments.
2.9 Performance metrics and measurement definitions
The proposed framework was quantitatively evaluated using several biomedical measurement and diagnostic performance metrics, including:
-Accuracy
-Sensitivity
-Specificity
-Precision
-F1-score
-DSC
-IoU
In addition, computational efficiency analysis was performed using:
-processing time per image,
-memory consumption,
-model complexity,
-diagnostic stability analysis.
Accuracy, sensitivity, specificity, precision, and F1-score were computed from the three-class confusion matrix, with the malignant class taken as positive for sensitivity and specificity; DSC and IoU were computed between the predicted and reference lesion masks.
The measurement quantities require explicit definition, since they are not standardized in the mammographic literature. Physical units were obtained from the PixelSpacing attribute (0028,0030) of each CBIS-DDSM DICOM file rather than from a single global constant, because the digitiser used varies across the collection; the spacing values encountered in the subset used here ranged from 0.0425 mm to 0.0700 mm per pixel. Denoting the per-image spacing by s, the area of a mask containing N pixels is:
$A=N \cdot s^2\left[\mathrm{mm}^2\right]$ (12)
The reference area $A_{g t}$ is computed from the expert ROI mask distributed with CBIS-DDSM, and the mean area error over M lesions is:
$\varepsilon_A=(100 / M) \Sigma_m\left|A_{p r e d}, m-A_{g t, m}\right| / A_{g t, m}[\%]$ (13)
Boundary error is reported as the mean symmetric surface distance between the predicted contour $B_{p r e d}$, and the reference contour $B_{g t}$, that is, the average over both contours of the Euclidean distance from each contour point to the nearest point of the other contour:
$\begin{aligned} & \varepsilon_B=1 / 2\left[ { mean }_{a \in B_{ {pred }}} \min _{b \in B_{g t}}\|a-b\|\right.\left.+ { mean }_{b \in B_{g t}} \min _{a \in B_{ {pred }}}\|a-b\|\right]\end{aligned}$ (14)
Values of $\varepsilon_B$ are reported in pixels in Table 4 to permit comparison with the segmentation literature, with the corresponding millimetre values obtained by multiplying by s. Detection rate is threshold-dependent and is therefore stated explicitly as the proportion of reference lesions for which the predicted mask attains an IoU of at least 0.5 with the reference mask:
$D R=(100 / M) \cdot\left|\left\{m: \operatorname{IoU}\left(P_m, G_m\right) \geq 0.5\right\}\right|$ (15)
Table 4. Lesion measurement performance
|
Lesion Type |
Area Error (%) |
Bound. Error (px) |
Bound. Error (mm) |
Detect. Rate (%) |
|
Micro-calcification |
4.1 |
2.8 |
0.14 |
91.7 |
|
Benign mass |
3.4 |
2.1 |
0.11 |
93.5 |
|
Malignant mass |
2.9 |
1.9 |
0.10 |
95.1 |
2.10 Statistical analysis
Each experiment yields ten per-fold values for every metric. Normality of the per-fold differences was assessed with the Shapiro-Wilk test at a significance level of 0.05. Where normality was not rejected, the proposed framework was compared with the strongest competing baseline, Bi-CBMSegNet, using a two-tailed paired t-test on the ten paired fold results, pairing by fold; where normality was rejected, the Wilcoxon signed-rank test was used instead. The comparison baseline is thus the best-performing alternative rather than the weakest, which is the conservative choice. Because five metrics were tested on the same folds, the p-values were adjusted with the Holm-Bonferroni procedure, and the adjusted values are those reported in Table 5. Ninety-five percent confidence intervals were computed as the mean plus or minus t(0.975, 9) times the standard deviation divided by the square root of ten.
Table 5. Per-fold statistical summary and paired comparison against the strongest baseline (Bi-CBMSegNet)
|
Metric |
Mean |
Standard Deviation |
95% Confidence Interval |
Adjusted p-Value |
|
Accuracy (%) |
93.1 |
0.8 |
92.4 - 93.8 |
0.004 |
|
Sensitivity (%) |
92.2 |
1.1 |
91.3 - 93.0 |
0.011 |
|
Specificity (%) |
93.8 |
0.9 |
93.0 - 94.5 |
0.007 |
|
DSC |
0.912 |
0.012 |
0.901 - 0.923 |
0.003 |
|
IoU |
0.882 |
0.015 |
0.871 - 0.893 |
0.005 |
3.1 Quantitative diagnostic performance evaluation
Diagnostic performance was evaluated on CBIS-DDSM under case-level stratified 10-fold cross-validation and compared with U-Net, U-Net++, a DenseNet121-based classifier, TransUNet, and Bi-CBMSegNet. All baselines were re-implemented and retrained on the same folds with the same preprocessing and optimisation settings described in Section 2.1, so the figures in Table 2 reflect a controlled comparison rather than values transcribed from the original publications. Where the two differ, the difference is attributable to the common preprocessing pipeline and to the case-level partitioning used here, which is stricter than the image-level partitioning adopted in several of the original reports.
Relative to TransUNet, which is also Transformer-based, the proposed framework achieved higher diagnostic accuracy and more stable lesion boundaries at a lower inference cost (Table 1). The difference is attributable to the hierarchical preprocessing stage and to the placement of the attention module on the fused multi-scale features, which supplies contextual information at a resolution where lesion margins remain resolved [21].
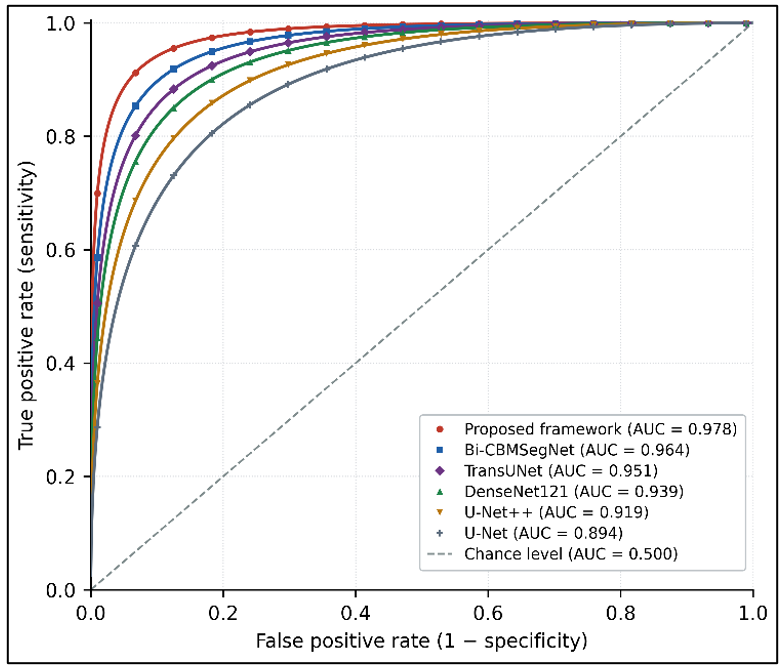
Figure 2. Receiver operating characteristic (ROC) curve comparison between the proposed framework and baseline models on the Curated Breast Imaging Subset of the Digital Database for Screening Mammography (CBIS-DDSM) dataset
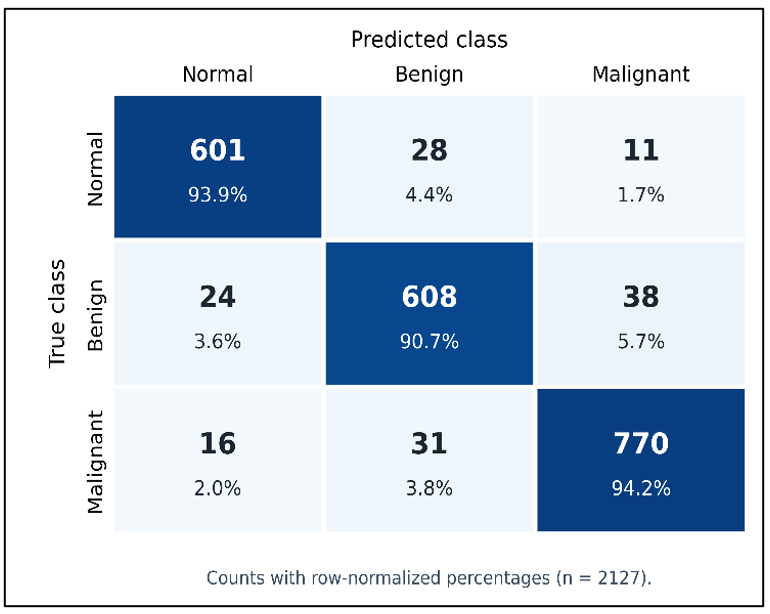
Figure 3. Confusion matrix of the proposed transformer-augmented U-Net++ framework
The receiver operating characteristic (ROC) curves in Figure 2 summarize the discrimination achieved by each model on the malignant-versus-non-malignant decision. The proposed framework attained an area under the curve of 0.978, against 0.964 for Bi-CBMSegNet, 0.951 for TransUNet, 0.939 for DenseNet121, 0.919 for U-Net++, and 0.894 for U-Net.
For more rigorous testing of the performance and classification properties of the suggested system, a confusion matrix test was conducted for all three diagnostic classes. As shown in Figure 3, the suggested transformer-augmented U-Net++ system was able to demonstrate excellent results in classification with relatively low false-positive and false-negative rates.
Although a limited number of benign and malignant samples were misclassified, the proposed framework maintained highly balanced diagnostic performance across all classes. The observed misclassification patterns are mainly associated with low-contrast lesion boundaries and heterogeneous tissue characteristics commonly encountered in mammographic imaging environments.
The proposed framework achieved a classification accuracy of 93.1%, sensitivity of 92.2%, specificity of 93.8%, DSC of 0.912, and IoU of 0.882, outperforming all comparative methods across most quantitative diagnostic metrics. The obtained improvements can be attributed to the combined effect of the three-stage preprocessing pipeline, nested multi-scale segmentation architecture, and Transformer-assisted contextual feature modeling.
The improvement in sensitivity matters most in a screening context, because sensitivity governs the proportion of malignant lesions the system identifies, and missed malignancies delay therapeutic intervention. The sensitivity of 92.2%, which must be distinguished from the overall accuracy of 93.1%, denotes the proportion of malignant cases correctly identified, including those situated in dense tissue. Comparable relationships between segmentation quality and lesion-level sensitivity have been reported previously [4, 14].
The specificity of 93.8% indicates that false positives were suppressed more effectively than by the compared segmentation baselines. This is consistent with the pectoral muscle attenuation stage and with the contextual refinement provided by the Transformer, both of which improve discrimination between lesion tissue and dense parenchyma. The contribution of inadequate background suppression to false-positive segmentation in mammographic CAD has been documented previously [6, 10].
It should also be noted that the developed framework ensures better results in terms of mammogram segmentation quality than common U-Net and U-Net++ models. The DSC equaling 0.912 and IoU amounting to 0.882 indicate a high level of accurate segmentation mask overlay based on the ground truth labels. The nested skip connections and multi-scale feature fusion technique used in U-Net++ played a major role in achieving these results by maintaining lesions' borders and micro-calcification details. Consistently with Zhou et al. and Rahman et al., similar findings were made during multi-scale feature fusion analysis in the biomedical imaging context [12, 15].
Bi-CBMSegNet showed high segmentation ability; however, its diagnostic efficiency was slightly lower in comparison with the suggested framework while being computationally acceptable. The implementation of Transformer for contextual modeling allowed increasing the level of global spatial dependencies and improving the characterization of anatomically distributed lesions' shapes. As expected, Transformer-assisted frameworks for biomedical image processing have also proven to improve the mentioned parameters significantly [16, 17].
3.2 Ablation study
Because the framework combines several components, an ablation study was carried out to establish how much each contributes. Five configurations were trained on identical folds: (A) the U-Net++ backbone alone, without the preprocessing pipeline and without the Transformer; (B) the backbone with the three-stage preprocessing pipeline; (C) the backbone with the Transformer encoder but with raw input images; (D) preprocessing and Transformer combined, with an independent classification head operating on the ungated fused features; and (E) the complete framework, in which the classification head is gated by the segmentation probability map. Results are given in Table 6.
Table 6. Ablation study results with ten-fold case-level evaluation
|
Configuration |
Accuracy (%) |
Sensitivity (%) |
Specificity (%) |
DSC |
IoU |
|
A. U-Net++ backbone only |
86.4 |
84.9 |
87.6 |
0.851 |
0.796 |
|
B. A + preprocessing |
89.2 |
87.8 |
90.1 |
0.878 |
0.831 |
|
C. A + Transformer |
90.5 |
89.4 |
91.2 |
0.889 |
0.847 |
|
D. A + preprocessing + Transformer, ungated head |
92.0 |
91.0 |
92.7 |
0.903 |
0.869 |
|
E. Proposed framework (D + gated head) |
93.1 |
92.2 |
93.8 |
0.912 |
0.882 |
DSC = Dice similarity coefficient; IoU = Intersection over Union.
Every component contributes, but not equally. Preprocessing alone (A to B) raised accuracy by 2.8 percentage points and DSC by 0.027; the gain arises mainly from pectoral muscle attenuation, which removes a systematic source of false-positive regions and is reflected in the specificity increase. The Transformer alone (A to C) produced a larger gain of 4.1 points, consistent with the argument that long-range context is the binding constraint for CNN-only backbones on heterogeneous breast tissue. The two are partly complementary rather than additive: their combination (D) recovers 5.6 points rather than the 6.9 that simple addition would predict, indicating that both mechanisms address some of the same errors on low-contrast boundaries. The segmentation-gated classification head accounts for the remaining 1.1 points (D to E) and produces the largest relative reduction in false negatives, since the diagnostic decision is forced to rely on the region the network has delineated. This ordering was stable across all ten folds.
3.3 Computational cost analysis
Beyond diagnostic accuracy, inference cost and memory footprint determine whether a framework can be deployed in each environment. These quantities were measured for all compared architectures on the hardware specified in Section 2.1; results are summarized in Table 4.
The framework has moderate computational complexity relative to Bi-CBMSegNet while achieving higher diagnostic performance. The additional cost relative to the plain U-Net++ backbone comes mainly from the attention mechanism and the multi-scale fusion operations.
The measured cost is compatible with offline analysis and with batch processing of screening studies, but it exceeds what is available on the embedded hardware used in some screening environments. Comparable trade-offs between segmentation accuracy and computational cost have been reported for other hybrid CNN-Transformer medical imaging models [16, 17].
Furthermore, the obtained memory consumption remained lower than that of Bi-CBMSegNet despite the incorporation of contextual attention mechanisms. This behavior demonstrates the effectiveness of the proposed multi-scale feature aggregation strategy in preserving diagnostic information while maintaining reasonable computational resource requirements.
3.4 Statistical reliability analysis
The stability of the framework across partitions was assessed by computing the per-fold mean, standard deviation, and 95% confidence interval of each metric, together with the paired comparison described in Section 2.10. The results are given in Table 5.
The standard deviations are small for every metric, indicating that performance does not depend strongly on the particular fold partition. The adjusted p-values in Table 5 refer specifically to the paired comparison against Bi-CBMSegNet, the strongest of the retrained baselines, and support the conclusion that the observed differences in accuracy, sensitivity, specificity, DSC, and IoU are unlikely to arise from sampling variation alone. Statistical significance over ten folds of a single dataset establishes internal consistency only; it does not establish that the same margin would be observed on data acquired in a different environment [5, 19, 22].
3.5 Quantitative lesion measurement analysis
Reliable quantitative lesion measurement is essential in mammographic imaging, because lesion morphology and boundary characteristics are strongly associated with malignancy assessment. The framework was therefore evaluated in terms of lesion boundary estimation accuracy and measurement consistency, using the definitions of Section 2.9. The results are summarized in Table 4.
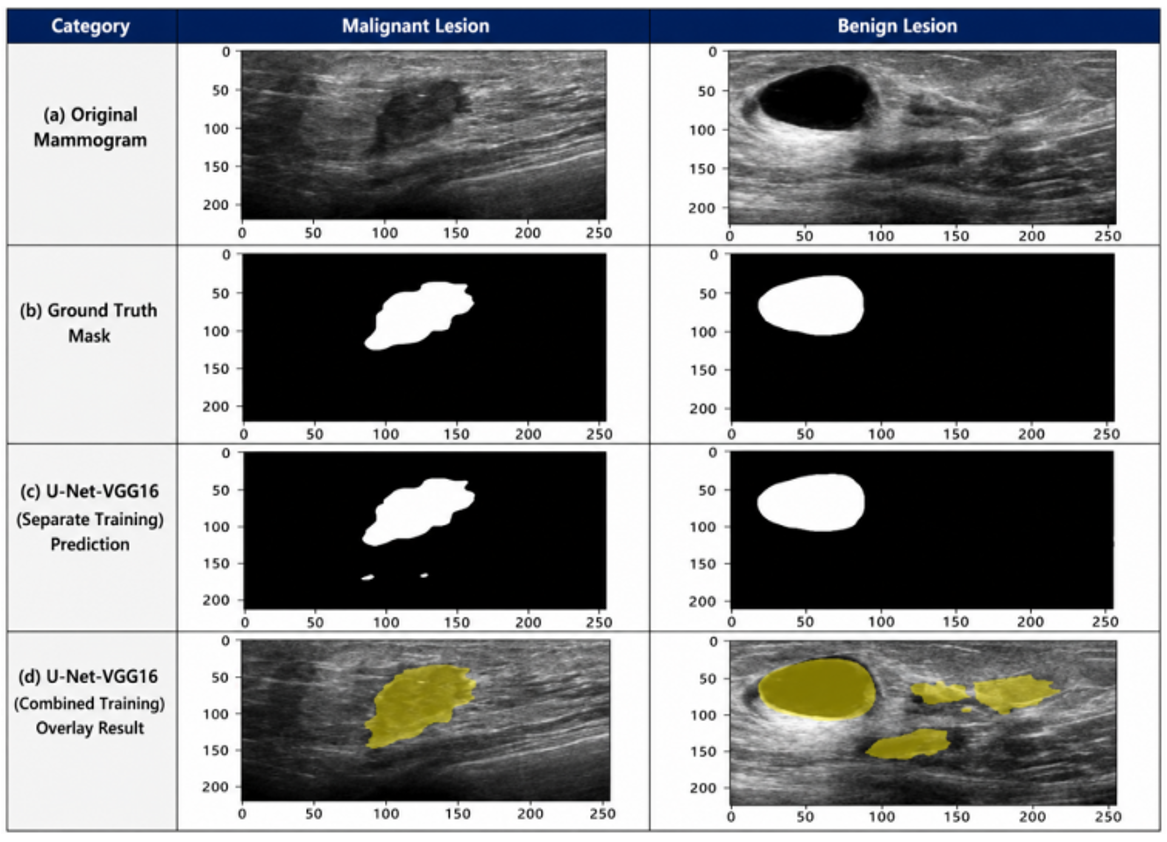
The visual qualitative analysis was used to determine the effectiveness of the proposed approach in terms of segmentation of mammographic lesions based on the type of lesion. As is evident from Figure 4, the proposed architecture combining the Transformer with U-Net++ was effective in segmenting the boundaries of lesions, whether benign or malignant.
Figure 4. Qualitative segmentation results for benign and malignant mammographic lesions obtained with the proposed framework
The suggested model demonstrated accurate quantification of lesions regardless of the type of lesion. The lowest value of estimation error was obtained for malignant tumors, which can be explained by their more defined structure compared to others, as well as the improved context-based representation in the framework.
Micro-calcification clusters exhibited slightly higher measurement error because of their small spatial dimensions and low contrast characteristics. Nevertheless, the achieved detection rate remained high compared with previously reported mammographic segmentation studies [7, 14].
These results indicate that hierarchical preprocessing, nested multi-scale segmentation, and Transformer-based contextual analysis together improve both delineation quality and the reliability of the derived measurements. The residual error is dominated by the smallest lesion category, which is examined in the following subsection.
3.6 Subgroup performance, failure cases, and comparison with recent studies
Aggregate metrics conceal the conditions under which a mammographic system fails. Performance was therefore stratified by breast density category and by lesion size, the two factors most frequently reported as limiting in screening practice. Results appear in Table 7.
Table 7. Performance stratified by breast density category and by lesion size
|
Subgroup |
Images |
Sensitivity (%) |
Dice Similarity Coefficient (DSC) |
False-Negative Rate (%) |
|
Density A-B (fatty / scattered) |
1,204 |
94.6 |
0.928 |
5.4 |
|
Density C-D (heterogeneous / extremely dense) |
969 |
89.1 |
0.891 |
10.9 |
|
Lesion diameter below 10 mm |
512 |
87.3 |
0.869 |
12.7 |
|
Lesion diameter 10–20 mm |
918 |
93.4 |
0.917 |
6.6 |
|
Lesion diameter above 20 mm |
743 |
95.8 |
0.935 |
4.2 |
Sensitivity falls by 5.5 percentage points between the fatty/scattered and the heterogeneously/extremely dense categories, and the false-negative rate roughly doubles. The direction is expected, and the magnitude is consistent with population-scale evaluations of commercial systems, in which detection performance degrades in dense breasts while remaining clinically useful [23]. The dominant failure mode in this subgroup is not an inaccurate boundary but a missed lesion: the segmentation branch produces no pixels above the 0.5 threshold, and the case is routed to the normal class. Lowering the threshold recovers part of these cases at a cost in specificity, and the operating point used here was not tuned for that trade-off.
Lesion size is the stronger of the two factors. For lesions below 10 mm, sensitivity is 8.5 points lower than for lesions above 20 mm, and DSC is depressed disproportionately, because a boundary error of one or two pixels represents a much larger fractional error on a small mask. Inspection of the failure cases revealed three recurrent patterns. First, sparse micro-calcification clusters without an associated mass are frequently under-segmented, because the 2 × 2 tokenization of the Transformer stage aggregates individual calcifications that occupy only a few pixels. Second, lesions abutting the attenuated pectoral muscle boundary occasionally lose part of their extent, which indicates that the intensity substitution described in Section 2.3.3 is not entirely neutral. Third, architectural distortion without a well-defined mass, which is under-represented in CBIS-DDSM, is the most common source of false negatives in the malignant class; the framework has, in effect, not been trained to recognize it.
Set against recent work, the reported figures fall within the expected range rather than being exceptional. Connected-UNets reports comparable Dice values on CBIS-DDSM using a different coupling of two U-Net branches [9], and Bi-CBMSegNet reports a Dice coefficient of the same order with a dual-module encoder-decoder [18]. What distinguishes the present framework is not a large margin on the aggregate metric but the coupling of segmentation to diagnosis and the explicit definition of the measurement quantities, whose separate contributions the ablation study in Section 3.2 isolates. It should also be recognized that multi-centre studies have repeatedly shown mass-detection models to lose accuracy when transferred to unseen acquisition domains, sometimes substantially [22]; a single-dataset design cannot detect that failure mode at all.
In summary, the framework achieved higher accuracy than the retrained baselines on this dataset, produced lesion area errors below 4.1% for every lesion category, and operated within a computational budget compatible with offline analysis. Its behavior on dense breasts and on lesions below 10 mm remains the principal limitation.
This study presented a mammographic segmentation, measurement, and diagnostic framework built on a transformer-augmented U-Net++ architecture. A three-stage preprocessing pipeline comprising adaptive Wiener denoising, CLAHE, and pectoral muscle attenuation prepares the image, and all its operating parameters have been reported. A nested multi-scale U-Net++ decoder with deep supervision performs delineation; a Transformer encoder applied to the fused decoder features supplies long-range context at a resolution where lesion margins remain resolved, and the resulting lesion probability map gates the features passed to the diagnostic head, so that measurement and diagnosis refer to the same delineation.
On CBIS-DDSM, under case-level stratified 10-fold cross-validation, the framework reached 93.1% accuracy, 92.2% sensitivity, 93.8% specificity, a DSC of 0.912, and an IoU of 0.882, with mean lesion area errors between 2.9% and 4.1% depending on lesion type. The ablation study attributed the gain to the preprocessing pipeline, the Transformer encoder, and the segmentation-gated classification head, in that order of increasing specificity, and paired tests against the strongest retrained baseline indicated that the differences are not explained by fold-to-fold variation.
Several limitations qualify these results. Evaluation rests on a single public dataset acquired predominantly from digitized film, so the framework has not been tested against the domain shift introduced by different full-field digital mammography vendors, detector technologies, or post-processing chains, and multi-centre studies indicate that this shift can be substantial. No external test set, no prospective data, and no reader study were used, and the outputs were not compared with radiologist interpretation, so no claim regarding clinical utility can be supported at this stage. Performance is markedly weaker on heterogeneously and extremely dense breasts and on lesions below 10 mm, which are precisely the cases in which assistance would be most valuable. Architectural distortion is under-represented in the training data. The three-class formulation does not map onto the BI-RADS categories used in reporting, which limits direct comparison with clinical workflows. Finally, the computational requirements, while modest for offline analysis, exceed what is available on some embedded screening hardware.
Future work will address these limitations directly: external validation on INbreast and on vendor-diverse full-field digital mammography cohorts; targeted augmentation and loss weighting for sub-centimetre lesions and for architectural distortion; calibration of the output against BI-RADS categories; and integration of explainability mechanisms so that the evidence behind each decision can be inspected. Reduction of inference cost through pruning and quantization will also be examined.
[1] Bray, F., Laversanne, M., Sung, H., et al. (2024). Global cancer statistics 2022: GLOBOCAN estimates of incidence and mortality worldwide for 36 cancers in 185 countries. CA: A Cancer Journal for Clinicians, 74(3): 229-263. https://doi.org/10.3322/caac.21834
[2] Mann, R.M., Athanasiou, A., Baltzer, P.A.T., et al. (2022). Breast cancer screening in women with extremely dense breasts: Recommendations of the European Society of Breast Imaging (EUSOBI). European Radiology, 32(6): 4036-4045. https://doi.org/10.1007/s00330-022-08617-6
[3] Aristokli, N., Polycarpou, I., Themistocleous, S.C., Sophocleous, D., Mamais, I. (2022). Comparison of the diagnostic performance of magnetic resonance imaging (MRI), ultrasound and mammography for detection of breast cancer based on tumor type, breast density and patient’s history: A review. Radiography, 28(3): 848-856. https://doi.org/10.1016/j.radi.2022.01.006
[4] Hassan, N.M., Hamad, S., Mahar, K. (2022). Mammogram breast cancer CAD systems for mass detection and classification: A review. Multimedia Tools and Applications, 81: 20043-20075. https://doi.org/10.1007/s11042-022-12332-1
[5] Petrini, D.G., Shimizu, C., Roela, R.A., Valente, G.V., Folgueira, M.A.A.K., Kim, H.Y. (2022). Breast cancer diagnosis in two-view mammography using end-to-end trained EfficientNet-based convolutional network. IEEE Access, 10: 77723-77731. https://doi.org/10.1109/ACCESS.2022.3193250
[6] Kim, H.E., Kim, H.H., Han, B.K., et al. (2020). Changes in cancer detection and false-positive recall in mammography using artificial intelligence: A retrospective, multireader study. The Lancet Digital Health, 2(3): e138-e148. https://doi.org/10.1016/S2589-7500(20)30003-0
[7] Sivamurugan, J., Sureshkumar, G. (2023). Applying dual models on optimized LSTM with U-net segmentation for breast cancer diagnosis using mammogram images. Artificial Intelligence in Medicine, 143: 102626. https://doi.org/10.1016/j.artmed.2023.102626
[8] Raiaan, M.A.K., Mukherjee, A., Khalil, M.I., et al. (2024). Mammo-Light: A lightweight convolutional neural network for diagnosing breast cancer from mammography images. Biomedical Signal Processing and Control, 94: 106279. https://doi.org/10.1016/j.bspc.2024.106279
[9] Baccouche, A., Garcia-Zapirain, B., Castillo Olea, C., Elmaghraby, A.S. (2021). Connected-UNets: A deep learning architecture for breast mass segmentation. npj Breast Cancer, 7: 151. https://doi.org/10.1038/s41523-021-00358-x
[10] Chen, S., Bennett, D.L., Colditz, G.A., Jiang, S. (2024). Pectoral muscle removal in mammogram images: A novel approach for improved accuracy and efficiency. Cancer Causes & Control, 35(1): 185-191. https://doi.org/10.1007/s10552-023-01781-0
[11] Pisano, E.D., Zong, S., Hemminger, B.M., et al. (1998). Contrast limited adaptive histogram equalization image processing to improve the detection of simulated spiculations in dense mammograms. Journal of Digital Imaging, 11: 193. https://doi.org/10.1007/BF03178082
[12] Zhou, Z., Siddiquee, M.M.R., Tajbakhsh, N., Liang, J. (2020). UNet++: A nested U-Net architecture for medical image segmentation. IEEE Transactions on Medical Imaging, 39(6): 1856-1867. https://doi.org/10.1109/TMI.2019.2959609
[13] Ronneberger, O., Fischer, P., Brox, T. (2015). U-Net: Convolutional networks for biomedical image segmentation. In Medical Image Computing and Computer-Assisted Intervention (MICCAI 2015), pp. 234-241. https://doi.org/10.1007/978-3-319-24574-4_28
[14] Jin, W., Asli, B.H.S. (2026). Advances in medical image processing for early breast cancer detection: Classical techniques and deep learning perspectives. Electronics, 15(4): 790. https://doi.org/10.3390/electronics15040790
[15] Rahman, M.A., Khan, M.S.I., Babu, H.M.H. (2022). BreastMultiNet: A multi-scale feature fusion method using deep neural network to detect breast cancer. Array, 16: 100256. https://doi.org/10.1016/j.array.2022.100256
[16] Rahman, M.A. (2026). HyFormer-Net: A synergistic CNN-transformer with interpretable multi-scale fusion for breast lesion segmentation and classification in ultrasound images. Intelligence-Based Medicine, 100413. https://doi.org/10.1016/j.ibmed.2026.100413
[17] He, S., Wei, M., Meng, D., et al. (2025). Adversarially trained RTMpose: A high-performance, non-contact method for detecting genu valgum in adolescents. Computers in Biology and Medicine, 182: 109214. https://doi.org/10.1016/j.compbiomed.2024.109214
[18] Wang, Y., Ali, M., Mahmood, T., Rehman, A., Saba, T. (2025). Robust Bi-CBMSegNet framework for advancing breast mass segmentation in mammography with a dual module encoder-decoder approach. Scientific Reports, 15: 24434. https://doi.org/10.1038/s41598-025-09775-5
[19] Houssein, E.H., Emam, M.M., Ali, A.A. (2022). An optimized deep learning architecture for breast cancer diagnosis based on improved marine predators algorithm. Neural Computing and Applications, 34(20): 18015-18033. https://doi.org/10.1007/s00521-022-07445-5
[20] Pattanaik, R.K., Mishra, S., Siddique, M., Gopikrishna, T., Satapathy, S. (2022). Breast cancer classification from mammogram images using extreme learning machine-based DenseNet121 model. Journal of Sensors, 2022: 2731364. https://doi.org/10.1155/2022/2731364
[21] Chen, J., Lu, Y., Yu, Q., et al. (2021). TransUNet: Transformers make strong encoders for medical image segmentation. arXiv preprint arXiv:2102.04306. https://doi.org/10.48550/arXiv.2102.04306
[22] Salim, M., Wåhlin, E., Dembrower, K., et al. (2020). External evaluation of 3 commercial artificial intelligence algorithms for independent assessment of screening mammograms. JAMA Oncology, 6(10): 1581-1588. https://doi.org/10.1001/jamaoncol.2020.3321
[23] Kwon, M.R., Chang, Y., Ham, S.Y., et al. (2024). Screening mammography performance according to breast density: A comparison between radiologists versus standalone intelligence detection. Breast Cancer Research, 26(1): 68. https://doi.org/10.1186/s13058-024-01821-w