Dentik Karyaningsih* | Vidila Rosalina | Arief Wibowo | Saleh Dwiyatno | Raditya Pradana | Ikna Niswatuzzakiah | Agus Rulli Sofian
© 2026 The authors. This article is published by IIETA and is licensed under the CC BY 4.0 license (http://creativecommons.org/licenses/by/4.0/).
OPEN ACCESS
Effective management of geoparks requires a comprehensive understanding of both the temporal variation of visitor demand and the spatial characteristics of diverse geosites. This study proposes an integrated analytical framework that combines spatial clustering and temporal forecasting to support smart geotourism decision-making in Bayah Dome Geopark, Indonesia. A total of 49 geosites, including geological, cultural, and biological attractions, was analyzed using K-Means clustering to identify representative destination profiles. The analysis revealed four interpretable groups characterized by differences in accessibility, infrastructure, attraction types, and visitor-oriented features. In parallel, a Seasonal Autoregressive Integrated Moving Average with Exogenous Regressors (SARIMAX) model was developed to forecast daily visitor demand using historical observations and external variables, including holidays, Google Trends, and weather conditions. The proposed forecasting model achieved a symmetric Mean Absolute Percentage Error (sMAPE) of 6.34% and demonstrated improved performance compared with baseline approaches. The analytical results were integrated into a web-based decision-support prototype that enables exploration of visitor forecasts, geosite profiles, and scenario-based planning options. The proposed framework does not aim to directly control visitor movements but provides analytical support for destination managers and tourists in evaluating potential planning strategies. This study demonstrates how integrating machine learning-based clustering with econometric forecasting contributes to data-driven smart geotourism management.
smart geotourism, spatial-temporal analytics, visitor demand forecasting, decision support system, machine learning, geosite clustering
Modern geotourism management faces the dual challenge of anticipating temporal fluctuations in visitor demand and managing a spatially diverse portfolio of attractions. Bayah Dome Geopark illustrates this challenge through its 49 geosites, which differ in accessibility, infrastructure, and experiential characteristics. Integrating visitor demand forecasting with geosite segmentation provides a coherent framework for scenario-based destination planning [1, 2].
Previous studies have generally addressed tourism demand forecasting and destination segmentation as separate analytical tasks [3, 4]. Forecasting commonly focuses on aggregate demand, whereas clustering provides static spatial profiles without accounting for time-series fluctuations. This separation limits the ability to interpret forecasted demand alongside specific geosite characteristics. In tourism demand forecasting, the deliberate selection of exogenous variables and the integration of contemporaneous data represent pivotal factors for building operational forecasting models [5]. To support tourism planning and destination development, stakeholders can adopt analytical techniques such as cluster analysis to identify meaningful groups of destinations based on shared characteristics [6]. This persistent separation between temporal and spatial analysis represents a significant research gap, limiting the development of proactive and coordinated strategies for managing visitor flows in real-world operational contexts.
This study addresses this gap by integrating K-Means clustering and Seasonal Autoregressive Integrated Moving Average with Exogenous Regressors (SARIMAX) forecasting within a scenario-based decision-support prototype. K-Means identifies interpretable profiles across 49 geosites, while SARIMAX forecasts geopark-level daily visitor demand using weekly seasonality and external variables. The integration illustrates how temporal forecasts and spatial profiles could conceptually support management and trip-planning scenarios without claiming demonstrated behavioral or operational impacts.
2.1 Geotourism demand forecasting
Accurate geotourism demand forecasting is a cornerstone of effective destination management, enabling stakeholders to optimize resource allocation, staffing, and strategic planning. The field has evolved from foundational time series models to more sophisticated approaches capable of integrating complex external signals. Traditional models like the Autoregressive Integrated Moving Average (ARIMA) and its seasonal variant, SARIMA, have long been valued for their robustness and interpretability [7, 8]. Existing studies demonstrate that the ARIMA family of models, including SARIMAX-E, ARIMAX, and SARIMA, is particularly well suited to tourism demand forecasting, as its members consistently ranked among the top performers in terms of error metrics [9].
To address the limitations of conventional time-series models, the SARIMAX framework incorporates exogenous variables to enhance forecasting precision [10, 11]. This model extends the SARIMA framework by incorporating external variables, thereby enhancing predictive accuracy when relevant exogenous information is available. The literature highlights the value of incorporating diverse exogenous data, including online search queries from Google Trends, which can serve as a proxy for geotourist interest and intent [12]. To enhance model accuracy, a systematic selection process was applied to identify an effective subset of external variables. The results of the empirical experiments demonstrated that the proposed SARIMAX model outperformed traditional univariate models, including SARIMA, Holt–Winters, and Prophet, as well as machine learning-based approaches such as Long Short-Term Memory (LSTM) and Recurrent Neural Networks (RNNs) [13].
2.2 Geosite segmentation
Alongside temporal forecasting, spatial segmentation of geotourism assets is essential for targeted marketing, product development, and visitor distribution management [14]. Unsupervised machine learning, particularly cluster analysis, is a widely adopted approach for achieving data-driven segmentation. The K-Means algorithm is widely used in tourism research due to its computational efficiency, scalability, and the interpretability of its results [15, 16]. It allows managers to distill a complex portfolio of attractions into a small number of strategic archetypes.
A methodologically sound application of K-Means requires addressing two key prerequisites. First, because the algorithm is distance-based, feature scaling (e.g., Z-score normalization) is essential to prevent variables with larger numeric ranges from dominating the clustering process [17]. Second, the number of clusters (k) should be determined using an objective criterion. The elbow method is commonly employed to identify an appropriate value of k by examining the trade-off between the number of clusters and within-cluster variation [18, 19]. K-Means has been widely applied in tourism research to identify and segment both geotourists and destinations. Its use in geopark contexts has also been documented, indicating that the method may provide a suitable approach for clustering geosites to support thematic geotourism planning.
2.3 Integrated spatio-temporal analytics
This research is positioned within the "smart geotourism" paradigm, which promotes the integration of data and artificial intelligence (AI) to support responsive and sustainable geotourism ecosystems. A core focus of smart geotourism is the analysis of visitor flows across both space and time. However, a persistent gap exists in the literature: temporal forecasting and spatial segmentation are predominantly treated as separate analytical tasks. Forecasting studies often provide aggregate predictions for an entire destination, yet offer limited insight into how demand may be distributed among its various attractions. Conversely, segmentation studies provide rich but static typologies of attractions that are disconnected from the dynamic, time-varying flow of visitors.
This study directly addresses this gap by proposing a framework that synergistically integrates these two analytical pillars. The novelty lies not in the individual application of SARIMAX or K-Means, but in their operational integration to create a holistic decision-support tool. This integration is further operationalized through the development of a web-based application designed to serve two key audiences. For geopark management, the application provides a prototype decision-support dashboard for exploring visitor forecasts and geosite clusters. For geotourists, it provides a prototype planning interface that supports geosite recommendations based on cluster characteristics and forecast information. The resulting prototype architecture demonstrates how predictive analytics, spatial clustering, and user-facing interfaces can be integrated to provide decision-support information. However, its practical effectiveness requires further evaluation through field deployment and user testing.
This study adopts a structured Research and Development (R&D) methodology. This approach was selected to reflect the study's dual objective: generating novel analytical insights and translating these findings into a tangible, operational smart geotourism application. The R&D process comprised the following phases:
Preliminary research: This initial phase involved a comprehensive literature review to identify the research gap, followed by the collection of time-series and cross-sectional data, and extensive data preprocessing to ensure data quality and suitability for analysis.
Model development: The analytical core of the research, this stage focused on constructing the two complementary machine learning pipelines: spatial segmentation using K-Means clustering and temporal forecasting using a SARIMAX model.
Product development: This stage involved translating the outputs from the analytical models into a functional, web-based application with distinct, user-centric interfaces for both geopark management and end-user tourists.
Validation: The final phase consisted of a dual evaluation. First, the statistical accuracy of the predictive models was assessed against established metrics. Second, the technical feasibility and decision-support potential of the integrated framework were evaluated through a scenario-based proof-of-concept application. The latter evaluation did not represent real-world user validation or field deployment.
The first pillar, geosite segmentation, addresses the types and spatial distribution of attractions exist and 'where' they are concentrated by partitioning the 49 geosites into interpretable groups. The second pillar, visitor forecasting, tackles the operational question of 'when' visitor demand will fluctuate by modeling daily arrivals and incorporating exogenous variables. The true novelty lies not in the isolated application of these techniques, but in their deliberate synergy throughout the R&D lifecycle. This integrated foundation supports a transition toward proactive, data-driven geotourism management. The entire methodological pipeline is visually summarized in Figure 1.
Figure 1. Research framework
3.1 Data and pre-processing
The analysis was based on two distinct datasets curated to support the core analytical pillars of this research. The first was a daily time series dataset for visitor forecasting, spanning from January 2023 to December 2024 (731 observations). Daily visitor counts across 49 individual geosites were aggregated by date to construct a unified, geopark-level time series. This target variable was supplemented by exogenous regressors selected for their potential influence on geotourism demand, including holiday indicators, online search interest, and morning weather conditions [20]. The second was a cross-sectional dataset detailing the unique attributes of the 49 geosites for the segmentation task. These features represented key dimensions of tourist experience and operational management, including geosite type, accessibility, visitor appeal, and level of development. The variables used to characterize the geosites for the K-Means clustering process are summarized in Table 1.
Table 2 presents the variables included in the visitor forecasting model, comprising the dependent variable and exogenous regressors.
Table 1. Variables used in clustering with types and description
|
Variable |
Description |
Data Type |
Coding |
Scaling |
|
Type_Bio |
Biodiversity type indicator |
Categorical |
One-hot of “Type”: 1 = bio diversity, 0 = otherwise |
Binary |
|
Type_Culture |
Culture Diversity type indicator |
Categorical |
One-hot of “Type”: 1 = culture diversity, 0 = otherwise |
Binary |
|
Type_Geo |
Geodiversity type indicator |
Categorical |
One-hot of “Type”: 1 = geodiversity, 0 = otherwise |
Binary |
|
Distance |
Distance to nearest access point/city (km) |
Numeric |
Distance measurement (km) |
Z-score |
|
Travelling time |
Travel time from nearest city (minutes) |
Numeric |
Minutes |
Z-score |
|
Rating |
Average visitor rating (scale 1–5) |
Numeric |
Mean visitor rating, 1–5 |
Z-score |
|
Road Condition_Good |
Access road condition: Good |
Categorical |
Road condition: 1 = Good, 0 = otherwise |
Binary |
|
Road Condition_Poor |
Access road condition: Poor |
Categorical |
Road condition: 1 = Poor, 0 = otherwise |
Binary |
|
Road Condition_Fair |
Access road condition: Fair |
Categorical |
Road condition: 1 = Fair, 0 = otherwise |
Binary |
|
Entry fee |
Adult admission ticket price (IDR) |
Numeric |
IDR |
Z-score |
|
Number of facilities |
Total supporting facilities (toilet, parking, etc.) |
Numeric |
Facility count |
Z-score |
|
Photography |
Photography attraction indicator |
Binary |
0 = No, 1 = Yes |
Binary |
|
Education |
Educational value indicator |
Binary |
0 = No, 1 = Yes |
Binary |
|
Adventure |
Adventure activity indicator |
Binary |
0 = No, 1 = Yes |
Binary |
|
Family recreation |
Family recreation suitability indicator |
Binary |
0 = No, 1 = Yes |
Binary |
|
Rock Type_Non-rock |
Non-rock formation indicator (grouped from 11 rock types) |
Categorical |
Rock vs. non-rock; 1 = non-rock, 0 = rock |
Binary |
Table 2. Variables used in forecasting, with types and descriptions
|
Variable |
Description |
Data Type |
|
Date |
Daily record of visitor and weather data |
Date |
|
Holiday Indicator |
Holiday/non-holiday status (weekends, national holidays, etc.) |
Categorical |
|
Google Trends Index |
A normalized index representing the search interest relative popularity for a specific term on Google |
Numeric |
|
cloudcover_morning_mean |
The average percentage of cloud cover recorded during the morning hours (ranging from 0% to 100%) |
Numeric |
|
rh_morning_mean |
The mean relative humidity (RH) measure captured during the morning period, expressed as a percentage |
Numeric |
|
Daily visitor count |
Total number of visitors recorded per day across the 49 geosites |
Numeric |
The exogenous variables were aligned by date with the daily geopark-level visitor series and comprised a binary Holiday Indicator, Google Trends Index, mean morning cloud cover, and mean morning relative humidity (RH). The Holiday Indicator distinguishes “Holiday” and “Non-Holiday” dates, while the Google Trends Index represents normalized relative search interest. Meteorological variables represent the corresponding mean morning measurements. For the hold-out evaluation, these exogenous observations were aligned with the respective test dates. Because this study does not forecast future Google Trends or weather values, the reported SARIMAX results represent conditional forecasting performance based on the prepared exogenous inputs rather than a fully autonomous forecasting system.
3.2 K-Means clustering
To perform geosite segmentation, this study employed K-Means clustering to identify homogeneous groups of geosites based on their shared characteristics [21, 22]. The selection of clustering features was guided by domain relevance and prior literature on geotourism destination evaluation. Specifically, features were chosen to represent three key dimensions critical for visitor flow management: accessibility (e.g., travel time, road condition), attractiveness (e.g., visitor ratings, review counts, thematic attributes), and operational capacity (e.g., facilities, entrance fee). This feature selection strategy was designed to ensure that the resulting clusters were interpretable and directly relevant for destination management [23, 24].
The final feature set entered into the K-Means analysis consisted of geosite type, distance, travelling time, visitor rating, road condition, entrance fee, number of facilities, photography, education, adventure, family recreation, and rock type. The ‘Geosite Name’ attribute was excluded from the clustering feature matrix and retained solely as an identifier.
Prior to clustering, all numerical features were standardized using Z-score normalization to prevent variables with larger numeric ranges from disproportionately influencing the distance-based K-Means algorithm. Categorical variables were encoded using dummy variables to allow their inclusion in the clustering process. The optimal number of clusters was determined using the Elbow Method, which evaluates the trade-off between cluster compactness and model simplicity. The resulting within-cluster variation across candidate values of k is presented in Figure 2.
A clear inflection point was observed at k = 4, indicating that four clusters provide a parsimonious and interpretable segmentation of the geosite dataset.
Figure 2. Elbow method for selecting k in K‑Means
To further assess the clustering solution, internal clustering validity and stability across random initializations were evaluated. For the selected four-cluster solution, the silhouette coefficient was 0.1751, the Davies–Bouldin index was 1.6113, and the Calinski–Harabasz index was 10.314. These metrics yielded complementary insights into cluster cohesion, separation, and compactness. Cluster stability was evaluated across 50 random K-Means initializations using the Adjusted Rand Index (ARI). The mean pairwise ARI across the 50 runs was 0.631 (SD = 0.153), with values ranging from 0.369 to 1.000, while the mean ARI relative to the final solution using seed = 42 was 0.671. These results demonstrated a moderate level of consistency in cluster assignments across varying initializations.
The resulting four clusters were subsequently interpreted based on their mean feature profiles. Cluster 0 was characterized as Accessible Cultural & Bio-Diversity Geosites, Cluster 1 as Nearby but Underdeveloped Geological Geosites, Cluster 2 as Developed Geo-Adventure & Family Hubs, and Cluster 3 as Distant but Highly-Rated Geo-Adventure Sites. These profiles summarize differences in accessibility, infrastructure, geosite type, and visitor-oriented characteristics across the four segments.
As a descriptive comparison, one-way Analysis of Variance (ANOVA) was conducted on the numerical features included in the clustering process, namely distance, travelling time, visitor rating, entrance fee, and number of facilities. Since these variables were directly used to construct the K-Means solution, the resulting between-cluster differences were not treated as independent evidence of cluster validity. ANOVA assumptions were verified, and the Kruskal–Wallis test was additionally used as a non-parametric robustness check where appropriate. The results showed significant differences across clusters for distance, travel time, entrance fee, and facility count, whereas visitor rating exhibited no significant variation among the segments. These descriptive comparisons help characterize the key attributes distinguishing the four segments, while the internal validity and stability metrics provide the primary evidence for the quality of the clustering solution.
The identified cluster profiles provide a strategic foundation for differentiated destination management, including infrastructure prioritization, targeted promotion, and visitor distribution planning across the Bayah Dome Geopark. Within the prototype web application, these profiles are integrated to generate tailored recommendation scenarios aligned with specific visitor preferences such as adventure, photography, education, and family recreation. However, these applications represent scenario-based decision support and have not yet been validated through field deployment or real-world user testing.
3.3 SARIMAX forecasting
To forecast daily visitor arrivals, a SARIMAX model was employed owing to its capability to simultaneously capture historical demand dynamics, weekly seasonality, and exogenous explanatory variables [25]. The model was developed using the daily geopark-level visitor time series introduced in Section 3.1. The forecasting procedure followed a structured pipeline involving chronological data splitting, stationarity assessment, model identification, parameter estimation, and out-of-sample evaluation.
To evaluate forecasting performance under realistic operational conditions, the dataset was chronologically divided into training (80%, n = 584) and testing (20%, n = 147) subsets. The training dataset was used for parameter estimation and model selection, whereas the testing dataset was reserved exclusively for out-of-sample forecasting evaluation. A chronological split was adopted to preserve temporal dependencies and prevent information leakage between training and testing data. First, the stationarity of the daily visitor time series was examined using the Augmented Dickey–Fuller (ADF) test [26]. The ADF test indicated stationarity at the 5% significance level (p < 0.05). Nevertheless, the ADF result was not used as the sole criterion for establishing the differencing orders. Instead, regular and seasonal differencing orders were treated as model-selection parameters and systematically evaluated within the SARIMAX grid search framework. This approach enabled candidate models with differing combinations of non-seasonal and seasonal differencing to be compared via information criteria while accounting for the observed weekly seasonality. Seasonal patterns were further evaluated through time-series decomposition and autocorrelation diagnostics.
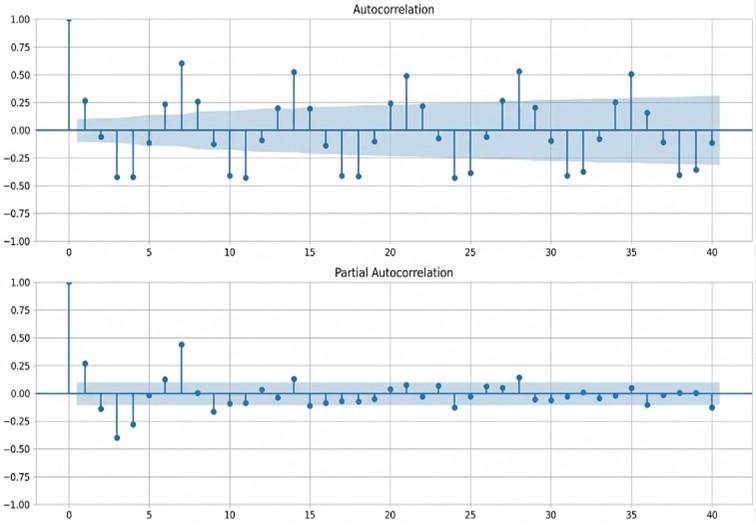
Model order identification was initially diagnosed through visual inspection of the Autocorrelation Function (ACF) and Partial Autocorrelation Function (PACF) plots. To systematically evaluate alternative differencing and autoregressive-moving-average structures, a grid search involving 120 candidate configurations was conducted across non-seasonal and seasonal parameters, given a weekly seasonal cycle (s = 7). Candidate models were evaluated using the Akaike Information Criterion (AIC) and Bayesian Information Criterion (BIC) for model selection. The selected SARIMAX specification, SARIMAX (0,1,2)(0,1,2,7), achieved the lowest AIC (3727.267) and BIC (3766.202).
The selected differencing orders should therefore be interpreted as the outcome of a comparative model selection process rather than as a direct implication of the ADF test. In particular, the final specification was retained because the combination of regular differencing (d = 1), seasonal differencing (D = 1), and the corresponding MA terms provided the best information-criterion performance among all evaluated candidate configurations.
In addition to historical visitor counts, exogenous variables were incorporated to represent contextual factors potentially associated with visitor demand. These variables consisted of holiday indicators, Google Trends search interest, morning cloud cover, and RH. Although the estimated coefficients exhibited varying levels of statistical significance, these variables were retained in the final specification based on their theoretical relevance and contextual explanatory value. Specifically, calendar events, meteorological factors, and online search behavior provide valuable signals for capturing visitor-demand fluctuations in an outdoor geotourism context.
To assess the incremental forecasting value of the exogenous variables, an additional benchmark experiment was conducted by comparing the selected SARIMAX model with an equivalent SARIMA model without exogenous regressors. Both models utilized the same autoregressive, differencing, moving-average, and seasonal orders, alongside identical chronological training and testing subsets, to ensure a consistent comparison. Model fit was evaluated using AIC and BIC, while out-of-sample forecasting performance was assessed via Mean Absolute Error (MAE), Root Mean Square Error (RMSE), and Symmetric Mean Absolute Percentage Error (sMAPE).
Model adequacy was further assessed through residual diagnostic tests, including the Ljung–Box test for residual autocorrelation, the Jarque–Bera test for residual normality, and the Autoregressive Conditional Heteroskedasticity Lagrange Multiplier (ARCH-LM) test for conditional heteroskedasticity. The complete diagnostic test outputs are detailed in the Results section, while the estimated coefficients, standard errors, z-statistics, and p-values of the selected SARIMAX model are presented in Table 3.
Table 3 summarizes the estimated parameters of the selected SARIMAX specification. The MA(1) and seasonal MA(7) components were statistically significant, whereas the exogenous variables did not reach individual statistical significance. Nevertheless, the exogenous variables were retained as theoretically motivated contextual predictors and subsequently benchmarked against an equivalent SARIMA baseline model without exogenous inputs. The seasonal MA(7) coefficient was estimated at −0.9986, which lies close to the conventional invertibility boundary. Although the parameter was statistically significant, its near-boundary estimate warrants cautious interpretation and may indicate that the selected specification is sensitive to the strong weekly seasonal structure in the visitor series. This potential numerical limitation was considered when interpreting the residual diagnostics and forecasting performance. The temporal dependence and seasonal structure of the visitor series were further examined using the ACF and PACF plots presented in Figure 3.
Table 3. Estimated parameters of the final SARIMAX model
|
Parameter |
Coefficient |
Standard Error |
z-Statistic |
p-Value |
|
Holiday indicator |
0.3315 |
0.6793 |
0.488 |
0.626 |
|
Google trends index |
0.0047 |
0.0121 |
0.391 |
0.696 |
|
Cloud cover (morning) |
−0.0028 |
0.0159 |
−0.176 |
0.860 |
|
Relative humidity (morning) |
−0.0350 |
0.0868 |
−0.404 |
0.687 |
|
MA(1) |
0.1337 |
0.0205 |
6.534 |
<0.001 |
|
MA(2) |
−0.0167 |
0.0369 |
−0.453 |
0.651 |
|
Seasonal MA(7) |
−0.9986 |
0.0681 |
−14.671 |
<0.001 |
|
Seasonal MA(14) |
0.0087 |
0.0408 |
0.212 |
0.832 |
Figure 3. Autocorrelation (ACF) and Partial Autocorrelation (PACF) plots
Figure 3 presents the ACF and PACF diagnostics used to examine the temporal structure of the visitor data. In the ACF plot (top), significant and recurring correlation spikes are observed at lags that are multiples of 7 (lags 7, 14, 21, and so on), indicating a weekly seasonal pattern (s = 7). Meanwhile, the PACF plot (bottom) provides preliminary information for determining appropriate autoregressive and moving-average orders. The shaded region represents the 95% confidence interval, with observations outside this region indicating statistically significant autocorrelation.
3.4 Integration logic
The integration logic connects the temporal and spatial analytical components of the framework. SARIMAX provides geopark-level visitor-demand forecasts, while K-Means generates geosite profiles based on accessibility, infrastructure, and visitor-oriented characteristics. Together, these outputs could support scenario-based consideration for promotion, resource allocation, and alternative geosite planning during anticipated periods of high demand. The framework is intended to provide decision-support information rather than evidence of actual visitor redistribution or behavioral change.
3.5 Proof-of-concept validation of the integrated framework
The integrated framework was evaluated through a scenario-based proof-of-concept to assess its technical feasibility and intended decision-support logic rather than actual changes in visitor behavior. A representative high-demand holiday scenario was constructed using the SARIMAX forecast, while K-Means profiles were deployed to identify geosites with different accessibility, facility, and visitor-oriented characteristics for potential alternative planning.
The scenario illustrates how forecast information and geosite profiles can support data-driven decision-making in strategic promotion, resource allocation, and visitor trip planning. However, it does not provide empirical evidence of changes in tourist decisions, congestion, or visitor redistribution. Such effects require future field deployment, usability testing, behavioral observation, and longitudinal evaluation.
This section details the analytical results from both geosite segmentation and visitor forecasting. The findings are discussed in terms of their individual performance and their combined strategic implications for smart geotourism management.
4.1 Web application architecture and deployment
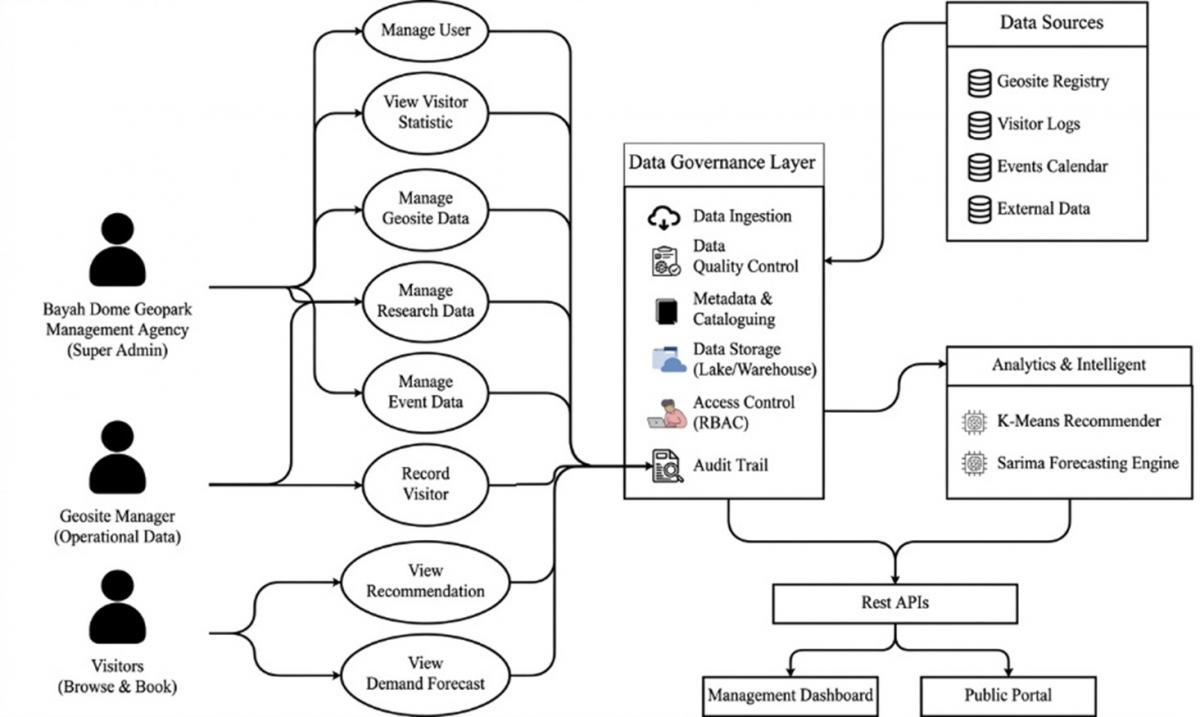
The web application integrates the SARIMAX forecasting and K-Means clustering outputs through a three-layer architecture consisting of data, analytics, and presentation layers (Figure 4). The data layer manages visitor, exogenous, and geosite data; the analytics layer executes the forecasting and clustering models, while the presentation layer delivers tailored interfaces for management and geotourist users.
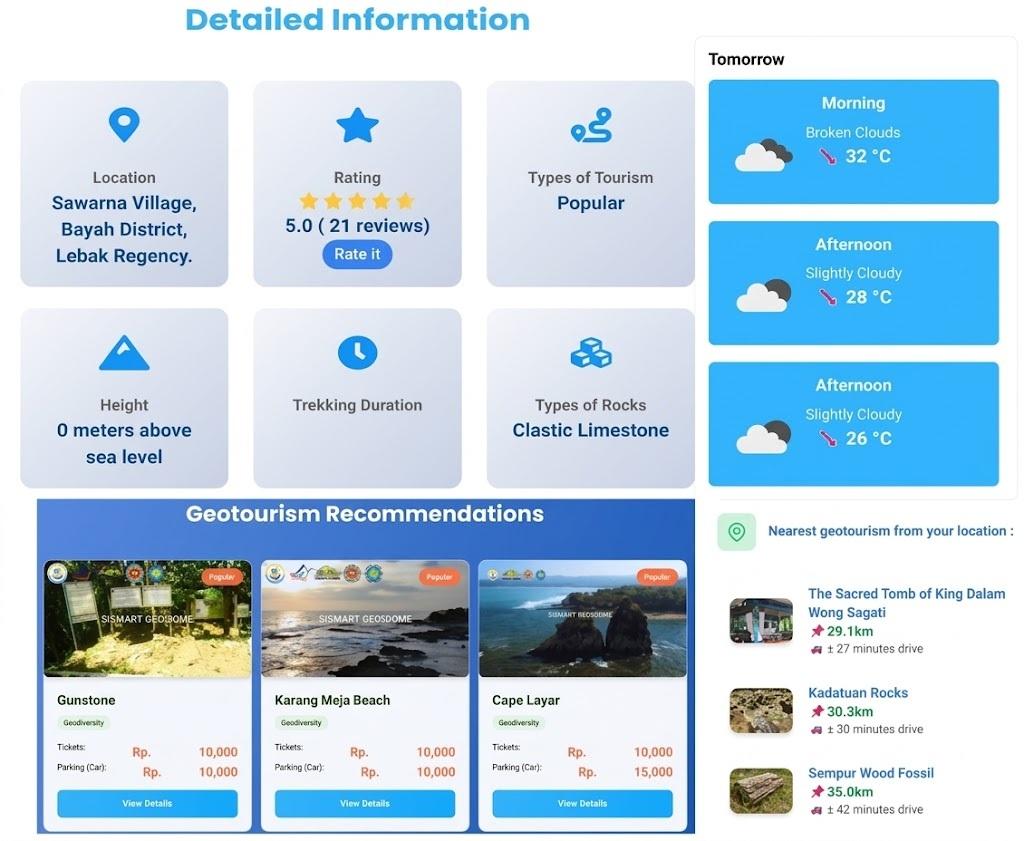
The application accommodates two primary user roles. The management role accesses an administrative dashboard that visualizes geopark-level visitor forecasts and geosite cluster profiles to support planning during anticipated high-demand periods. Meanwhile, geotourists interact with a user-facing interface that offers cluster-based geosite recommendations and forecast information for trip planning (Figure 5).
Figure 4. System architecture of integrated geotourism governance model for Bayah Dome Geopark
Figure 5. Geosite recommendation interface based on K-Means clustering results in Bayah Dome Geopark
4.2 Setup and metrics
The evaluation of the implemented models was tailored to their respective objectives. The effectiveness of the K-Means clustering was assessed based on the managerial interpretability and distinctiveness of the four resulting geosite profiles. Principal Component Analysis (PCA) was employed to visually inspect cluster separation in a reduced-dimensional space. For the SARIMAX forecasting model, predictive accuracy was quantitatively evaluated on a hold-out test dataset. The model's performance was measured using three standard error metrics: MAE, to indicate the average magnitude of the forecast errors; RMSE, which gives more weight to larger errors; and sMAPE, which provides a relative measure of accuracy. To demonstrate its value, the SARIMAX model's performance was compared against three baseline models: Naive, Seasonal Naive, and Moving Average.
4.3 K-Means results and implications
The K-Means algorithm partitioned the 49 geosites into four clusters selected based on the Elbow Method. The analysis produced four distinct and managerially interpretable segments of varying sizes. Cluster 2 was the largest segment, comprising 15 geosites (30.61%), whereas Cluster 3 was the smallest (10 geosites, 20.41%). Clusters 0 and 1 were equal in size, containing 12 geosites (24.49%) each. PCA was used to reduce the dimensionality of the feature space and visualize the relative positioning of the four clusters. The resulting projection provides a visual representation of the relative positioning of the four cluster groups and their centroids in the reduced feature space as shown in Figure 6.
Figure 6. Principal Component Analysis (PCA) projection of geosites colored by K‑Means clusters; centroids marked
Each point represents an individual geosite, with distinct colors indicating membership across the four identified clusters (Cluster 0 to Cluster 3). Red "X" markers indicate the centroids, or central points, of each cluster. This PCA projection illustrates the relative spatial disposition and separation of the four cluster groups within the reduced two-dimensional feature space.
The four-cluster solution was further evaluated using internal validation and initialization stability measures. The selected solution obtained a silhouette coefficient of 0.1751, a Davies–Bouldin index of 1.6113, and a Calinski–Harabasz index of 10.314. These metrics provide complementary information regarding cluster cohesion, separation, and compactness. Stability analysis across 50 random K-Means initializations produced a mean pairwise ARI of 0.631 (SD = 0.153), ranging from 0.369 to 1.000, with a mean ARI of 0.671 relative to the final solution using seed = 42. These results indicate a moderate level of consistency in cluster assignments across different initializations. The four-cluster solution was therefore selected based primarily on the Elbow Method, with additional support from internal validity measures, initialization stability, and the interpretability of the resulting geosite profiles.
The mean feature profiles of the four K-Means clusters, which form the basis for interpreting their respective characteristics, are summarized in Table 4.
Table 4. Mean feature values across K-Means clusters
|
Variables |
C0 |
C1 |
C2 |
C3 |
|
Type_Bio |
0.333 |
0.0 |
0.133 |
0.0 |
|
Type_Culture |
0.667 |
0.0 |
0.133 |
0.1 |
|
Type_Geo |
0.0 |
1.0 |
0.733 |
0.9 |
|
Distance |
0.3 |
0.266 |
0.523 |
0.822 |
|
Travelling time |
0.246 |
0.345 |
0.655 |
0.509 |
|
Rating |
0.537 |
0.375 |
0.433 |
0.69 |
|
Road Condition_Good |
0.583 |
0.25 |
0.6 |
0.2 |
|
Road Condition_Poor |
0.0 |
0.667 |
0.0 |
0.5 |
|
Road Condition_Fair |
0.417 |
0.083 |
0.4 |
0.3 |
|
Entry fee |
0.133 |
0.1 |
0.413 |
0.1 |
|
Number of facilities |
0.55 |
0.067 |
0.867 |
0.06 |
|
Photography |
0.75 |
0.417 |
0.733 |
0.2 |
|
Education |
0.583 |
0.25 |
0.467 |
0.4 |
|
Adventure |
0.417 |
0.667 |
0.867 |
0.8 |
|
Family recreation |
0.667 |
0.083 |
0.933 |
0.2 |
|
Rock Type_Non-rock |
1.0 |
0.0 |
0.267 |
0.1 |
Each cluster's defining traits were interpreted from its normalized feature means. Cluster 0 — Accessible Cultural & Bio-Diversity Geosites: dominated by Type_Culture/Type_Bio, all non-rock formations, good road access, strong family-recreation and photography appeal. Cluster 1 — Nearby but Underdeveloped Geological Geosites: exclusively Type_Geo, closest to the origin point, yet the poorest road condition and fewest facilities. Cluster 2 — Developed Geo-Adventure & Family Hubs: the largest, most facility-rich segment, leading in Number of Facilities, Family Recreation, and Adventure. Cluster 3 — Distant but Highly-Rated Geo-Adventure Sites: the farthest and least accessible, yet the highest visitor Rating and a strong Adventure profile. This typology serves a dual purpose — guiding management's marketing, development, and visitor-distribution decisions, and powering the web application's recommendation engine to generate personalized suggestions based on preferences like "adventure" or "family-friendly."
Because the numerical features used in the K-Means algorithm are, by construction, expected to differ across the resulting clusters, a one-way ANOVA on these same variables cannot be used as independent validation of the clustering solution. Consequently, ANOVA results are reported purely descriptively to characterize feature distributions across the four identified segments, complementing the internal validation and stability metrics established above. The analysis focused on numerical geosite attributes representing accessibility, attractiveness, and operational capacity, including distance, travelling time, visitor rating, entrance fee, and number of facilities. Variables used exclusively in the SARIMAX forecasting model, such as Holiday Indicator and Google Trends Index, were intentionally excluded because they belong to a different analytical component of the proposed framework.
Before interpretation, the assumptions underlying ANOVA were checked for each variable. The Shapiro–Wilk test indicated departures from normality for travelling time, entry fee, and number of facilities (p < 0.05), whereas distance and rating did not deviate significantly from normality (p = 0.194 and p = 0.069, respectively). Levene's test indicated homogeneity of variances for all variables except number of facilities (p = 0.013). Given these violations, the non-parametric Kruskal–Wallis test was also conducted as a robustness check, and the results were consistent between the two tests. Distance (F = 19.62, p < 0.001; H = 26.17, p < 0.001), travelling time (F = 10.45, p < 0.001; H = 20.39, p < 0.001), entry fee (F = 11.52, p < 0.001; H = 19.33, p < 0.001), and number of facilities (F = 38.47, p < 0.001; H = 33.69, p < 0.001) all differed significantly across clusters under both tests, whereas rating did not differ significantly under either test (F = 2.04, p = 0.121; H = 5.05, p = 0.168).
These descriptive comparisons indicate that accessibility- and facility-related attributes contribute most strongly to the differentiation observed among the four segments, whereas visitor rating is more evenly distributed across clusters. Consequently, these results offer additional descriptive evidence for interpreting the characteristics of each geosite segment, supporting tailored destination management strategies, including infrastructure prioritization, targeted promotion, and visitor flow planning within the Bayah Dome Geopark. Importantly, the ANOVA and Kruskal–Wallis results were treated as descriptive comparisons rather than independent evidence of cluster validity; the quality of the clustering solution is instead assessed through the reported internal validity and stability measures.
4.4 SARIMAX performance and operational insight
The predictive performance of the selected SARIMAX(0,1,2)(0,1,2,7) model was evaluated on the hold-out test dataset. Figure 7 presents the comparison between actual and forecasted daily visitor counts during the test period.
The model successfully captures the strong weekly seasonality, with the forecast line closely mirroring the cyclical rhythm of the actual data. However, a notable limitation is the model's tendency to underestimate the magnitude of peak visitor surges during major holidays. While it successfully predicts the timing of these peaks, the forecast does not always capture the full scale of the actual visitor counts, a notable limitation for precise capacity planning during maximum-demand events.
Figure 7. SARIMAX forecast vs. actual daily visitors on the test period
Table 5. Forecast reliability and benchmark comparison results
|
Test |
Statistic |
p-Value |
Interpretation |
|
95% Prediction Interval Coverage |
97.28% |
— |
Empirical coverage close to nominal 95% |
|
Diebold–Mariano vs. Naive (t−1) |
−0.551 |
0.582 |
No statistically significant difference in forecast accuracy |
|
Diebold–Mariano vs. Seasonal Naive (t−7) |
−3.143 |
0.0017 |
SARIMAX has significantly lower forecast errors than Seasonal Naive |
Note: SARIMAX = Seasonal Autoregressive Integrated Moving Average with Exogenous Regressors.
To assess forecast reliability and statistical differences in forecast accuracy, the empirical coverage of the 95% prediction intervals and the Diebold–Mariano (DM) test were evaluated. The results are presented in Table 5.
The 95% prediction intervals achieved an empirical coverage of 97.28%, which is reasonably close to the nominal 95% level. The DM test indicated no statistically significant difference in forecast accuracy between SARIMAX and the Naive benchmark (p = 0.582), whereas a statistically significant improvement was observed relative to the Seasonal Naive benchmark (p = 0.0017). Although SARIMAX produced lower point-forecast errors on the hold-out test set, the statistical evidence of improvement was therefore limited to the Seasonal Naive comparison.
Residual diagnostics were subsequently conducted using the Ljung–Box, Jarque–Bera, and ARCH-LM tests. The results are presented in Table 6.
Table 6. Residual diagnostic results of the final SARIMAX model
|
Diagnostic Test |
Statistic |
p-Value |
Interpretation |
|
Ljung–Box (lag 7) |
14.934 |
0.0369 |
Significant residual autocorrelation |
|
Ljung–Box (lag 14) |
15.975 |
0.3149 |
No significant autocorrelation |
|
Ljung–Box (lag 21) |
20.042 |
0.5186 |
No significant autocorrelation |
|
Jarque–Bera |
81670.303 |
<0.001 |
Residuals deviate from normality |
|
ARCH-LM |
2.954 |
0.8892 |
No significant heteroskedasticity |
Note: SARIMAX = Seasonal Autoregressive Integrated Moving Average with Exogenous Regressors, ARCH-LM = Autoregressive Conditional Heteroskedasticity Lagrange Multiplier.
Table 6 indicates that statistically significant residual autocorrelation remains at lag 7 (p = 0.0369), whereas no significant autocorrelation is detected at lags 14 and 21. The Jarque–Bera test indicates a substantial departure from residual normality (p < 0.001), whereas the ARCH-LM test shows no significant conditional heteroskedasticity (p = 0.8892). Collectively, these results indicate useful out-of-sample forecasting performance; however, the model should not be interpreted as fully statistically validated based on residual diagnostics alone.
On the hold-out test set, SARIMAX achieved lower MAE, RMSE, and sMAPE than SARIMA, with values of 5.2857, 6.8452, and 6.34%, respectively, compared with 15.134, 26.947, and 37.515%. AIC and BIC were also compared to assess model fit. Overall, SARIMAX showed lower out-of-sample forecast errors than the SARIMA benchmark.
4.5 Proof-of-concept application scenario
A scenario-based proof-of-concept was used to illustrate the intended integration of forecasting and clustering. A hypothetical high-demand period during an upcoming long holiday was combined with the SARIMAX forecast and geosite cluster profiles to identify potential alternative planning options. The prototype provides forecast information and cluster-based recommendations for management and geotourist users, including potential alternatives based on accessibility, facilities, and visitor-oriented characteristics. However, this scenario does not demonstrate actual changes in visitor behavior, congestion, or visitor redistribution. Evaluating these potential effects would require future field deployment, usability testing, behavioral observation, and longitudinal evaluation.
This study developed a scenario-based framework integrating K-Means clustering and SARIMAX forecasting for spatial geosite segmentation and temporal visitor-demand analysis. K-Means produced four interpretable geosite profiles, while SARIMAX achieved an sMAPE of 6.34% on the hold-out test set. The 95% prediction intervals achieved 97.28% empirical coverage; however, mild autocorrelation at lag 7, substantial residual non-normality, and systematic underestimation of holiday peaks indicate that the forecasting outputs should be interpreted as useful predictive performance rather than full statistical validation.
The integrated outputs were deployed within a proof-of-concept web application designed to support promotional planning, resource allocation, and trip-planning scenarios. However, the prototype does not provide empirical evidence of changes in tourist behavior, site congestion, visitor redistribution, or management effectiveness.
Future research should evaluate the framework through field deployment, usability testing, and longitudinal observation. Additionally, subsequent studies could explore advanced forecasting models, alternative clustering techniques, and additional real-time data sources.
The authors gratefully acknowledge the Government of Indonesia for the financial support provided through the Ministry of Higher Education, Science, and Technology (KEMDIKTISAINTEK), which made this research possible. The authors also extend their appreciation to the Bayah Dome Geopark Management Board and the Department of Culture and Tourism of Lebak Regency, Banten Province, for their valuable assistance in data collection and field activities. Sincere thanks are further extended to Universitas Serang Raya and Universitas Budi Luhur for their continuous institutional support throughout the implementation and completion of this study.
All authors contributed to the preparation and completion of this study, including research planning, literature review, system design, system testing, data analysis, manuscript preparation, and final revision.
This work was supported by the Government of Indonesia through the Ministry of Higher Education, Science, and Technology (KEMDIKTISAINTEK) under the Regular Fundamental Research scheme (Grant No. 125/C3/DT.05.00/PL/2025).
|
${{x}_{i}}$ |
data point (geosite feature vector) |
|
${{C}_{j}}$ |
centroid of cluster $j$ |
|
${{y}_{t}}$ |
number of clusters in K-Means observed |
|
$k$ |
observed visitor count at time |
|
$\hat{y_t}$ |
forecasted visitor count at time |
|
$p,d,q$ |
non-seasonal ARIMA parameters |
|
$P,D,Q,m$ |
seasonal ARIMA parameters |
|
Greek symbols |
|
|
$\alpha$ |
significance level |
|
$\phi$ |
moving average parameter |
|
f |
autoregressive parameter |
|
${{\varepsilon }_{t}}$ |
error (residual) at time |
|
Subscripts |
|
|
$t$ |
time index |
|
$i$ |
data point index |
|
$j$ |
cluster index |
[1] Parkinson, C., Pan, B., Morris, S.A., et al. (2025). A comparison of tourists’ spatial-temporal behaviors between location-based service data and onsite GPS tracks. Sustainability, 17(2): 391. https://doi.org/10.3390/su17020391
[2] Šoltésová, M., Iannaccone, B., Štrba, Ľ., Sidor, C. (2025). Application of GIS technologies in tourism planning and sustainable development: A case study of Gelnica. ISPRS International Journal of Geo-Information, 14(3): 120. https://doi.org/10.3390/ijgi14030120
[3] Liu, Y., Hsiao, A., Ma, E. (2021). Segmenting tourism markets based on demand growth patterns: A longitudinal profile analysis approach. Journal of Hospitality & Tourism Research, 45(6): 967-997. https://doi.org/10.1177/1096348020962564
[4] Bi, J.W., Han, T.Y., Yao, Y. (2024). Collaborative forecasting of tourism demand for multiple tourist attractions with spatial dependence: A combined deep learning model. Tourism Economics, 30(2): 361-388. https://doi.org/10.1177/13548166231153908
[5] Thalgasduwa, P., Lakmali, S. (2025). Tourist arrival forecast in Sri Lanka with statistical and machine learning models by integrating exogenous factors. In 2025 International Conference on Advances in Technology and Computing (ICATC), Kelaniya, Sri Lanka, pp. 1-6. https://doi.org/10.1109/icatc68823.2025.11407754
[6] Wang, T.L., Azizurrohman, M. (2025). Segmenting international tourists in Indonesia: A cluster analysis of preferences, motivations, and behaviors. Journal of Economics Research and Social Sciences, 9(1): 93-107. https://doi.org/10.18196/jerss.v9i1.23582
[7] He, K., Ji, L., Wu, C.W.D., Tso, K.F.G. (2021). Using SARIMA-CNN-LSTM approach to forecast daily tourism demand. Journal of Hospitality and Tourism Management, 49: 25-33. https://doi.org/10.1016/j.jhtm.2021.08.022
[8] Wu, D.C.W., Ji, L., He, K., Tso, K.F.G. (2021). Forecasting tourist daily arrivals with a hybrid SARIMA-LSTM approach. Journal of Hospitality & Tourism Research, 45(1): 52-67. https://doi.org/10.1177/1096348020934046
[9] Lei, C.F., Chen, F., Chu, C.W. (2025). Optimizing SARIMAX model with big data to predict gaming tourism destination demand. Mathematics, 13(20): 3276. https://doi.org/10.3390/math13203276
[10] Ampountolas, A. (2021). Modeling and forecasting daily hotel demand: A comparison based on SARIMAX, neural networks, and GARCH models. Forecasting, 3(3): 580-595. https://doi.org/10.3390/forecast3030037
[11] Bilek, G. (2025). Modeling tourism demand in Turkey (2008-2024): Time-series approaches for sustainable growth. Sustainability, 17(4): 1396. https://doi.org/10.3390/su17041396
[12] Duan, Q. (2024). Predicting tourism demand by combining search engine data. Tourism Management and Technology Economy, 7(3): 1-8. https://doi.org/10.23977/tmte.2024.070301
[13] Lee, G.C. (2025). A data-driven approach to tourism demand forecasting: Integrating web search data into a SARIMAX model. Data, 10(5): 73. https://doi.org/10.3390/data10050073
[14] Achmad, F., Abdillah, I.T., Amani, H. (2023). Decision-making process for tourism potential segmentation: A case study analysis. International Journal of Innovation in Enterprise System, 7(1): 19-30. https://doi.org/10.25124/ijies.v7i01.204
[15] Kanafi, K., Fitriana, M. (2024). The best tourism recommendation intelligent system model: Weighted product and K-means methods. Sistemasi, 13(5): 2116-2129. https://doi.org/10.32520/stmsi.v13i5.4514
[16] Damos, M.A., Zhu, J., Li, W., et al. (2024). Enhancing the K-means algorithm through a genetic algorithm based on survey and social media tourism objectives for tourism path recommendations. ISPRS International Journal of Geo-Information, 13(2): 40. https://doi.org/10.3390/ijgi13020040
[17] Yildirim, M.E., Kaya, M., Ince, I.F. (2022). A case study: Unsupervised approach for tourist profile analysis by K-means clustering in Turkey. Journal of Internet Computing and Services, 23(1): 11-17. https://doi.org/10.7472/jksii.2022.23.1.11
[18] Zhao, E., Du, P., Azaglo, E.Y., Wang, S., Sun, S. (2023). Forecasting daily tourism volume: A hybrid approach with CEMMDAN and multi-kernel adaptive ensemble. Current Issues in Tourism, 26(7): 1112-1131. https://doi.org/10.1080/13683500.2022.2048806
[19] Luo, F., Zhu, Y., Wang, X., Luo, X., Chen, J., Ye, D. (2023). Principal component and cluster analysis of Macao tourism destination competitiveness based on big data. In Atlantis Highlights in 2023 4th International Conference on Big Data and Social Sciences, Changsha, China, pp. 308-316. https://doi.org/10.2991/978-94-6463-276-7_33
[20] Farsi, M., Hosahalli, D., Manjunatha, B.R., et al. (2021). Parallel genetic algorithms for optimizing the SARIMA model for better forecasting of the NCDC weather data. Alexandria Engineering Journal, 60(1): 1299-1316. https://doi.org/10.1016/j.aej.2020.10.052
[21] Sinaga, K.P., Yang, M.S. (2020). Unsupervised K-means clustering algorithm. IEEE Access, 8: 80716-80727. https://doi.org/10.1109/access.2020.2988796
[22] Vysochan, O., Vysochan, O., Hyk, V., Hryniv, T. (2021). Attributive-spatial tourist clusteration of regions of Ukraine. GeoJournal of Tourism and Geosites, 35(2): 480-489. https://doi.org/10.30892/gtg.35228-675
[23] Guerard, G., Gabot, Q., Djebali, S. (2025). Tourism profile measure for data-driven tourism segmentation. International Journal of Machine Learning and Cybernetics, 16(10): 7107-7132. https://doi.org/10.1007/s13042-024-02145-z
[24] Wang, X. (2023). Python-based for big data analytics in tourism. In 2023 IEEE 7th Information Technology and Mechatronics Engineering Conference (ITOEC), Chongqing, China, pp. 1500-1504. https://doi.org/10.1109/itoec57671.2023.10291922
[25] Zheng, J., Ma, X., Wang, D., Li, P., Yu, Y., Nie, Y. (2025). Improved multi-step prediction of daily tourism demand: An innovative hybrid machine learning framework with search engine data. Current Issues in Tourism, pp. 1-20. https://doi.org/10.1080/13683500.2025.2554872
[26] Çekim, H.Ö., Koyuncu, A. (2022). The impact of Google Trends on the tourist arrivals: A case of Antalya tourism. Alphanumeric Journal, 10(1): 1-14. https://doi.org/10.17093/alphanumeric.931652