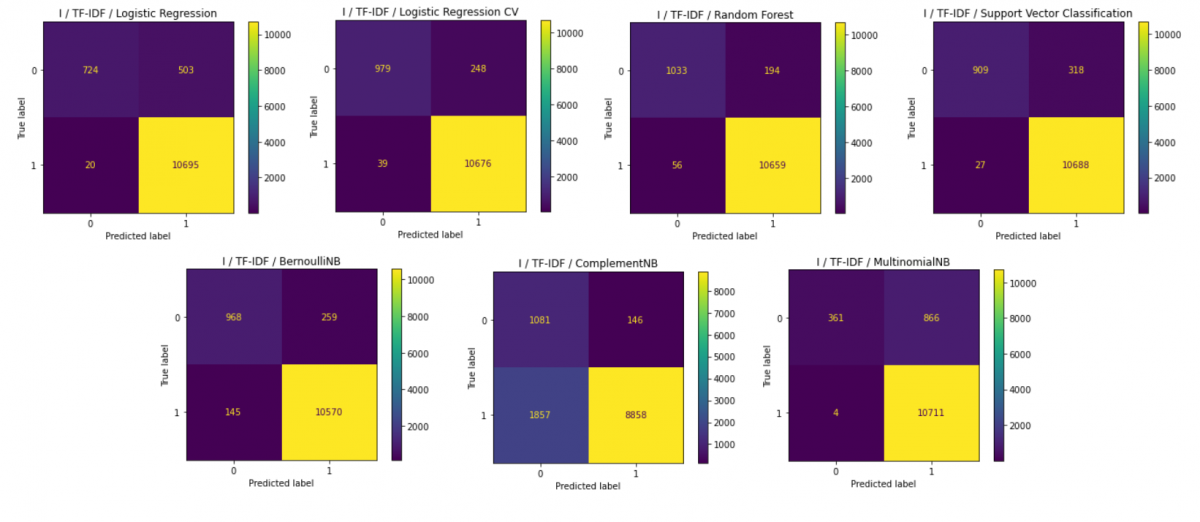
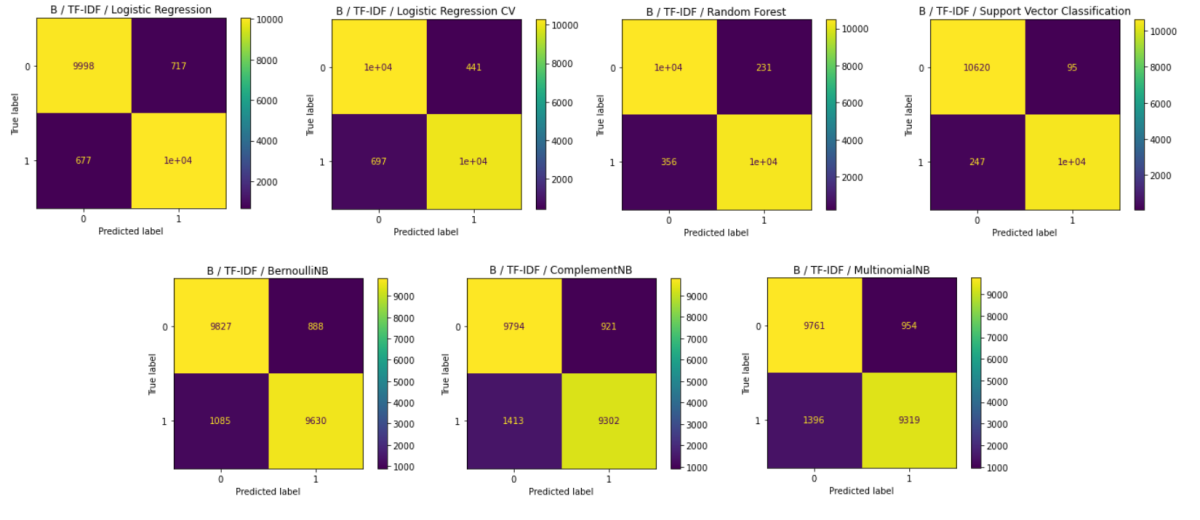
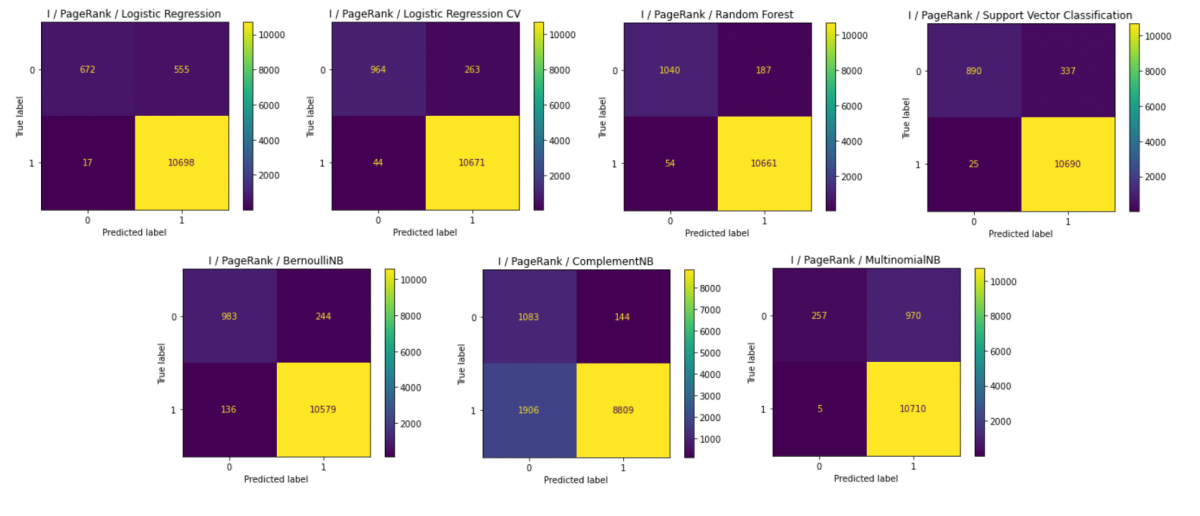
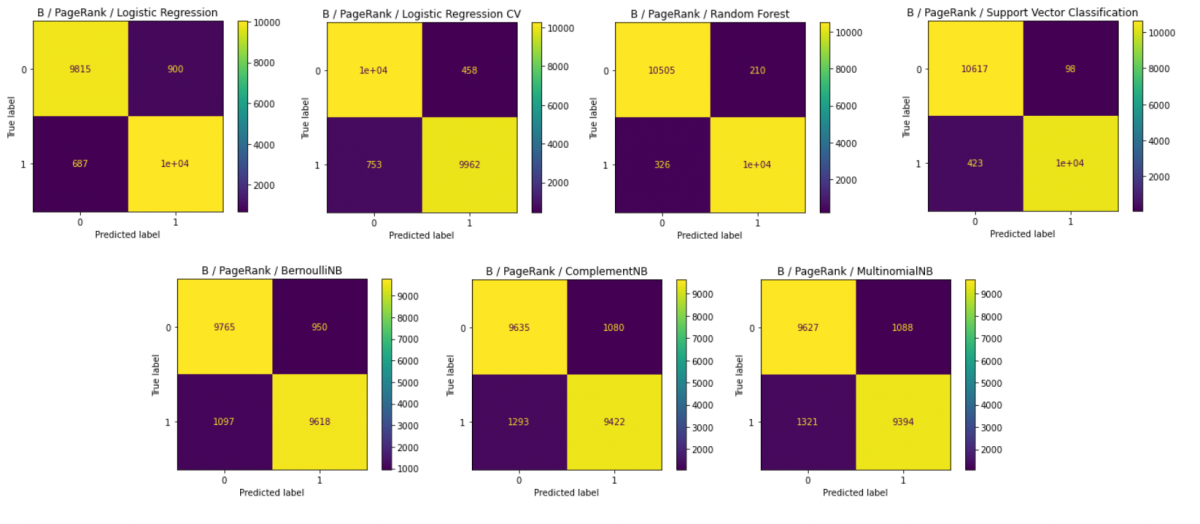
Khadija Khedraoui* | Khalid Zine-Dine | Abdellah Madani
© 2026 The authors. This article is published by IIETA and is licensed under the CC BY 4.0 license (http://creativecommons.org/licenses/by/4.0/).
OPEN ACCESS
The rapid growth of social media platforms has increased the prevalence of harmful online behaviors, particularly cyberbullying, creating a demand for reliable automated detection approaches. This study proposes a graph-based feature representation framework for cyberbullying classification by integrating PageRank-based feature extraction with supervised machine learning (ML) algorithms. A comprehensive preprocessing pipeline is developed to improve text quality, address class imbalance, and enhance the discriminative capability of extracted features. Unlike conventional text representation methods based solely on Term Frequency-Inverse Document Frequency (TF-IDF), the proposed approach incorporates graph structural information derived from relationships among textual features. The extracted graph-based representations are evaluated using multiple supervised classifiers, including Logistic Regression, Naïve Bayes, Random Forest, and Support Vector Machine (SVM) models. Experiments conducted on a Twitter-based cyberbullying dataset demonstrate the effectiveness of combining graph centrality information with traditional ML methods for online harassment detection. Comparative analysis shows that the proposed graph-based representation provides competitive classification performance compared with conventional TF-IDF features. The findings indicate that graph-driven feature engineering can improve the representation of complex linguistic patterns in short social media messages. However, further validation using larger, multilingual, and cross-platform datasets is required to assess the generalizability of the proposed framework in real-world social media environments.
cyberbullying detection, graph-based feature representation, PageRank, supervised machine learning, text classification, social media analytics
Several researchers have argued that cyberbullying is fundamentally a relational or psychological phenomenon. From this perspective, promoting preventive psychological skills among adolescents within educational settings is more effective than restricting their access to technology. In contrast, other scholars contend that cyberbullying is a direct consequence of technological advancements and should be addressed through technological interventions [1].
This research aligns with the technological approach by exploring advanced solutions that utilize artificial intelligence (AI) and machine learning (ML) to identify and mitigate cyberbullying among adolescents [1].
Recent studies have demonstrated the capability of technological systems to detect cyberbullying incidents in online environments. These systems typically rely on cyberbullying-related keywords as input to filter content and identify harmful behaviors. When tested on diverse datasets from various social media platforms like Twitter, YouTube, and Instagram, the accuracy of such detection models ranged between 68.55% and 93.33% [1]. Another study supports the automated detection of cyberbullying, advocating for the automated removal of offensive content, including messages, images, and posts. Given that cyberbullying is an intersectional problem spanning psychological, educational, behavioral, and technological domains, the development of sophisticated detection and prevention tools remains a critical objective [2].
Cyberbullying, as a form of online abuse, has a profound physical and psychological impact on individuals, particularly adolescents. Consequently, there is a need for robust ML models capable of accurately classifying bullying messages across diverse online platforms. Higher levels of awareness and understanding of this phenomenon lead to better detection and intervention outcomes.
Among the various social media datasets available for research, Twitter datasets are frequently used in cyberbullying studies due to the platform’s relatively lenient content moderation policies, which result in a large volume of abusive and hate speech content available for analysis [2]. A further characteristic of Twitter is its 280-character limit per tweet. This constraint presents a challenge for traditional text classification models that typically perform better with longer text inputs [3].
ML algorithms are commonly employed for text classification due to their ability to effectively detect bullying content in social media conversations. One widely used method is the Term Frequency-Inverse Document Frequency (TF-IDF) technique, which assigns each word a weight based on its frequency within a document relative to its frequency across the entire corpus. While TF-IDF has demonstrated satisfactory performance in this context, it presents certain limitations: it ignores word order, and it becomes computationally intensive for large vocabularies.
In this study, we explore an alternative classification approach designed to outperform traditional methods such as TF-IDF. We conduct a comparative analysis between the proposed method and TF-IDF to evaluate its effectiveness.
Handling large-scale data in social media analysis is challenging, especially as the volume of data grows exponentially over time. Unlike conventional feature-based representations, a graph-based representation captures the structural relationships and connections within a dataset, providing insights that conventional methods may overlook.
In this work, we addressed the problem of text classification using supervised ML algorithms. While TF-IDF has been used as a standard feature representation for this task, graph-based methods offer a powerful alternative for representing connected data. Our proposed approach employed a centrality-based algorithm, specifically PageRank, to extract meaningful features from raw datasets. To this end, we used Neo4j, a graph database management system, to construct and store the underlying graph structure on which PageRank was subsequently computed.
Centrality algorithms, such as PageRank, are well-suited for identifying influential nodes in a graph based on two criteria: (1) the number of incoming connections, and (2) the relative importance of these nodes. The PageRank algorithm assigns a weight to each node based on its connectivity, making it a powerful method for analyzing complex networks.
The quality of a dataset is a critical factor in determining the effectiveness of any classification model. Our study underscored the importance of feature engineering and preprocessing techniques in enhancing dataset quality. Through proper preprocessing, noise and irrelevant information were reduced, enabling the classifier to distinguish between classes based on specific criteria. A major challenge encountered was dataset imbalance, which often skewed the results toward the dominant class. To address this issue, balancing techniques were applied before model implementation. This approach yielded more reliable and accurate results.
This paper is an extended version of the conference paper titled "A Graph-Based Approach for Cyberbullying Classification Using Machine Learning Algorithms," which was presented at the 2023 14th International Conference on Intelligent Systems Theories and Applications (SITA).
The primary objectives of this research are as follows:
•To examine existing text classification techniques and highlight their limitations.
•To implement appropriate preprocessing techniques on raw datasets, improving their quality for subsequent analysis and classification.
•To propose a novel method inspired by the PageRank centrality algorithm and demonstrate its advantages over traditional techniques.
•To conduct a comparative study to validate the proposed model in terms of efficiency and performance.
The main contributions of this research are summarized as follows:
•Dataset enhancement: we constructed a dataset from a Kaggle source, containing binary labels, and applied preprocessing techniques to prepare it for classification.
•Comparison of models: the baseline TF-IDF model, configured with the "max_features" parameter, was implemented and evaluated against the proposed PageRank algorithm.
•Evaluation using multiple classifiers: both TF-IDF and PageRank methods were trained and evaluated using seven classifiers, with class imbalance mitigated using appropriate balancing techniques.
The remainder of this paper is organized as follows: Section 2 provides a review of the relevant literature. Section 3 defines the key terminology and concepts used throughout the study. Section 4 details the research objectives and methodological procedures, including dataset preprocessing and model implementation. Section 5 reports the experimental results and provides a comparative analysis of model performance. Section 6 concludes with a summary of the key findings and recommendations for future work leveraging advanced technologies.
Cyberbullying detection is a complex supervised classification task. Various techniques have been proposed in the literature to mitigate its adverse effects, particularly for vulnerable populations such as adolescents and young adults. Prominent approaches include ML and deep learning (DL) algorithms, whose effectiveness and robustness are typically assessed using a variety of performance metrics. However, effective cyberbullying mitigation requires more than simple detection; it requires understanding the context and dynamics of online interactions.
The disclosure of personal information significantly increases the likelihood of becoming a victim of cyberbullying. A survey of 1,555 internet users from Nigeria and the United States (US) revealed a direct correlation between the availability of personal information—whether through direct disclosure or via social media platforms—and the frequency of cyberbullying incidents. Cyberbullying typically involves not only the "perpetrator" and the "victim" but also a third party, referred to as the "discloser," who contributes to the dissemination of sensitive information. Both strangers and acquaintances may be involved, making such attacks particularly challenging [3].
The findings of this study carry important implications for social media literacy programs and policy frameworks. In the United States, nearly 40% of adults have reported experiencing cyberbullying, while at least 36% of adolescents in middle and high school have encountered similar behavior. The consequences include stress, anxiety, depression, and reduced self-esteem. As personal information becomes more accessible, its role in fueling cyberbullying intensifies. For instance, sharing private family details or intimate images in online conversations can be exploited by malicious individuals, resulting in victimization. Many users rely on standard platform features such as reporting mechanisms, user blocking, and content filtering to prevent and mitigate cyberbullying. In the United States, users are generally familiar with these tools; however, the awareness and adoption in Nigeria are much lower, contributing to the persistence of the issue. Effective mitigation requires limiting the disclosure of personal information. Future technological solutions, such as watermarking, may offer a means of tracking and restricting the transmission of personal data [3].
Aggressive behavior in online environments is often based on factors including gender, nationality, religion, race, and ethnicity. The control of hate speech and abusive behavior on social networks has proven difficult, particularly because manual monitoring is not scalable. Intelligent systems represent a promising solution for addressing this issue. Among social media platforms, Twitter is one of the most widely used; its users are frequently exposed to offensive content. However, detecting cyber-attacks and offensive language on Twitter is particularly challenging due to the platform’s use of short messages and the linguistic diversity of its user base. Furthermore, cyberbullying and aggression may be expressed indirectly through sarcasm or trolling, which complicates automated detection. Current techniques in natural language processing (NLP), text mining, and ML face significant challenges in accurately classifying such content, limiting their effectiveness in addressing these nuanced forms of online aggression [4].
Twitter is a valuable resource for analyzing collective opinion, as users frequently share their views on various issues. This study aims to analyze public sentiment regarding COVID-19 vaccination on social media, with a particular focus on Twitter. To combat the pandemic, public healthcare agencies are working to increase vaccination rates, and understanding public opinion on social media is central to this objective. By promoting positive messages and countering negative sentiment, authorities can shape public perception and encourage more individuals to get vaccinated. Tracking public sentiment on social media is essential for effective planning and decision-making [5], particularly in healthcare campaigns. Platforms such as Twitter offer real-time insight into public attitudes, making them invaluable tools for public health strategy.
The definition of cyberbullying varies across studies, as each investigation offers its own perspective, leading to different interpretations. Broadly, cyberbullying refers to harmful behaviors conducted online, often through social media platforms or text messages. It is typically characterized by repeated aggressive actions carried out by an individual or a group against a victim who is unable to defend themselves, with the attacks facilitated via electronic devices. Some scholars classify cyberbullying as a form of hate and harassment, constituting a criminal act. The anonymity afforded by social media, where users can adopt pseudonyms rather than real names, enables perpetrators to engage in harmful behaviors without being easily identified. Cyberbullying is recognized as a significant ethical issue, with the number of affected individuals reaching substantial levels. It involves the use of online networks as channels for aggressive actions directed at victims who often cannot respond effectively. Additionally, cyberbullying presents a challenge for text classification due to the dynamic nature of language, which makes it difficult to maintain a static list of offensive terms [6].
Cyberbullying is considered a serious public health concern, with numerous studies documenting its adverse effects on individuals' physical and mental well-being, as well as on academic performance. In severe cases, the associated psychological distress has been linked to suicidal ideation. Given its pervasive nature, occurring at any time and in any setting, developing automated detection models for cyberbullying is critical to enhance human security. Social media platforms such as Twitter, where users can broadcast content to a large audience while remaining anonymous, amplify the potential risk of harmful messages spreading widely. The anonymity intensifies the seriousness of the transmitted content, making social platforms conducive to cyberbullying. In the era of big data, traditional detection methods are insufficient. This has created a demand for automated models capable of detecting cyberbullying more efficiently [7].
Researchers typically define cyberbullying as the use of electronic devices to disseminate abusive communications aimed at individuals. It can take various forms, including posting hateful messages, targeting victims with threats, or leaving aggressive remarks publicly. A particularly harmful characteristic of cyberbullying is that it can spread rapidly without direct confrontation between perpetrator and victim, which complicates efforts to curb it. Therefore, developing predictive models capable of effectively handling both textual and non-textual content, such as images and videos, is critical to addressing this problem [7].
ML, a subfield of AI, involves the ability of a system to learn from historical data to build predictive models and solve specific tasks. DL, a subset of ML based on artificial neural networks (ANNs), has demonstrated promising performance in various domains. In contrast, AI encompasses a broader range of techniques that enable computers to mimic human behavior and make decisions with minimal human intervention. The complexity of human language and the challenge of codifying all human knowledge present several limitations, particularly when dealing with high-dimensional data for tasks such as classification, clustering, or regression. Different learning models are required for specific problems and datasets. The three main types of ML are supervised, unsupervised, and reinforcement learning.
Tweets were classified into cyberbullying and non-cyberbullying categories using convolutional neural networks (CNNs). Following data collection and cleaning, annotations were performed using CrowdFlower. Word similarities and semantics were computed using Global Vectors for Word Representation (GloVe). The results showed that varying CNN parameters, including the number of epochs, neurons per layer, and network depth, influenced classification accuracy and that metaheuristic optimization algorithms provided the most effective means of improving it [6].
Beyond this specific approach, the broader body of research on cyberbullying detection relies on data collected from social media platforms, with feature engineering playing a central role in model performance. While many feature selection algorithms are used to extract features for classifier training, they often do not explicitly determine the significance of specific features. Commonly utilized algorithms include Information Gain, Pearson Correlation, and Chi-Square Tests. Supervised ML algorithms frequently employed for cyberbullying detection include Support Vector Machine (SVM), Naïve Bayes, Random Forest, Decision Tree, k-nearest neighbors (KNN), and Logistic Regression. Various evaluation metrics, such as accuracy, precision, recall, F1-score, and area under the curve (AUC), are used to measure the models' effectiveness. Given that datasets are often imbalanced, Synthetic Minority Over-sampling Technique (SMOTE) is frequently applied to mitigate this imbalance and reduce the risk of overfitting [7].
A proposed solution for detecting cyberbullying on social media networks leverages supervised ML and NLP techniques. The researchers used TF-IDF to assess word importance within a document and evaluated whether the text contained profanity in conjunction with a pronoun. The Affective Norms for English Words (AFINN) lexicon was used to determine polarity at the sentence level, while SVM was chosen as the classifier due to its effectiveness in binary classification tasks. The hybrid model, integrating TF-IDF with sentiment analysis, achieved the best performance metrics, with accuracy, precision, recall, and F1-score all reaching 75% [8].
The authors utilized an annotated cyber-trolls dataset and implemented preprocessing techniques using various Python libraries. These techniques included the removal of stop words, punctuation, and numbers, lowercase conversion, and tokenization. For feature extraction, TF-IDF was applied in both unigram and bigram formats, and a feature selection module was employed to avoid overfitting. The proposed method was based on a deep neural network (DNN) architecture with fully connected layers of a Multilayer Perceptron (MLP). For comparison, they employed CNNs with Long Short-Term Memory (LSTM) and Bidirectional Long Short-Term Memory (BiLSTM), which are commonly used in text classification. MLP was also used as a classification module to assign labels to each input. Evaluation metrics, including average accuracy, precision, recall, and F1-score, demonstrated that the MLP model using TF-IDF outperformed other models, achieving an accuracy of 92% [4].
The authors outlined a framework for cyberbullying detection combining NLP and ML. The NLP component included various preprocessing steps, such as removing stop words, punctuation, numbers, tokenization, and stemming. For feature extraction, methods such as Bag-of-Words and TF-IDF were employed, with ML algorithms such as Decision Tree, Naïve Bayes, Random Forest, and SVM applied for classification. The findings indicated that TF-IDF yielded higher accuracy compared to Bag-of-Words, and SVM outperformed the other algorithms [9].
In another study, an annotated public dataset from Twitter and Formspring was used. The preprocessing steps included removing special characters and encoding the text into numerical form using a label encoder. Classifiers such as SVM, Naïve Bayes, Random Forest, and an ensemble approach combining these algorithms were employed for classification. The research addressed tasks such as role labeling, text classification, and sentiment analysis, with SVM achieving the highest accuracy score of 81.6%. The researchers also investigated DL algorithms, such as BiLSTM and CNN, with F1-score, recall, and precision metrics indicating that CNN achieved the highest performance. The study highlighted the challenge of detecting sarcasm in textual features [10].
A model for assessing the severity of cyberbullying on Twitter was tested using five classifiers—Naïve Bayes, KNN, Random Forest, SVM, and Decision Tree—on two data representations: Bag-of-Words and Word2Vec. Feature selection techniques, including Information Gain, Chi-Square, and Correlation, were applied in various combinations to evaluate both feature performance and classifier performance. The researchers used Pointwise Mutual Information (PMI) to calculate the semantic orientation of words in the corpus, finding that integrating PMI with predicted features improved classifier performance by 20%. SMOTE was also employed to address dataset imbalance.
The PMI between two words, word1 and word2, is defined by Eq. (1):
$P M I($word1, word2$)=\log 2\left[\frac{p(\text {word} 1 \& \text {word} 2)}{p(\text {word} 1) p(\text {word} 2)}\right]$ (1)
Researchers employed Arabic Natural Language Processing (ANLP) for cyberbullying detection, with preprocessing steps such as cleaning, normalization, tokenization, and stemming. Data representation was conducted using GloVe through the `glove_python` library. A comparison of GloVe and TF-IDF showed that GloVe achieved higher classification performance in this context. Classification was performed using a CNN optimized with a Genetic Algorithm (GA). This hybrid GA-CNN model achieved high classification accuracy on the Saudi Newspapers Articles Dataset (SNAD) and Moroccan Newspapers Articles Dataset (MNAD) [11].
Another study aimed to detect aggression in Spanish-language texts by combining lexicon-based approaches with ML algorithms to analyze emotions expressed in Twitter comments. Five lexicon-based approaches were proposed, combining Lexicon, word embedding (WE), and TF-IDF features in different configurations: Lexicon, WE_Lexicon, TF_IDF_Lexicon, WE_Lexicon_TF-IDF, and an ensemble approach. GridSearchCV was utilized to optimize the models' parameters, with the hybrid approach incorporating WordEmbedding, Lexicons, and ML classifiers outperforming the basic models. The researchers also developed a web application to test the proposed methodology's effectiveness in classifying tweets [12].
Using a custom dataset of hotel reviews, this study evaluated the polarity of Arabic texts as either positive or negative. Steps included data collection, cleaning, annotation, preprocessing, feature extraction, and classifier training and testing. Classifiers used were Logistic Regression, Naïve Bayes, Support Vector Classification (SVC), Ridge Classifier, Decision Tree, and Random Forest. The results indicated that the SVC yielded the highest accuracy, reaching a score of 95.62%. Hyperparameter tuning techniques, such as Bayesian Optimization, Grid Search, Random Search, GA, and Particle Swarm Optimization, significantly enhanced performance, particularly for Naïve Bayes [13].
Another study investigated the detection of irony and sarcasm on Twitter using a combination of ML and NLP techniques, including DL methods and CNN. The study began by clearly defining the terms "irony" and "sarcasm" to establish a consistent conceptual framework for the analysis. The first experiment compared different classification techniques and found that DL methods yielded superior results. However, a noted limitation of DL methods is their requirement for large datasets to achieve high performance. The second experiment evaluated the impact of different data preprocessing techniques when applying the CNN algorithm. The findings emphasized the importance of carefully implementing preprocessing steps to avoid removing data critical for detecting sarcasm or irony [13].
In the third experiment, the study compared irony and sarcasm detection by training models on both datasets in a cross-evaluation setup. The results showed a similarity score of 0.94, indicating a strong correlation between sarcasm and irony. The final experiment involved comparing sarcasm and cyberbullying detection by training models on sarcasm data and testing them on cyberbullying datasets. This yielded an F1-score of 0.889, suggesting that enhanced detection of irony and sarcasm can improve the accuracy of cyberbullying detection [14].
Other researchers proposed a hybrid model combining an ANN with Deep Reinforcement Learning (DRL) for the classification of cyberbullying content from raw datasets. They developed multiple frameworks capable of extracting cyberbullying instances from a comprehensive dataset, which included user comments, psychological traits, and contextual information. The ANN-DRL model improves with each iteration by leveraging the feedback mechanism of DRL. The classification results, measured in terms of accuracy, demonstrated that the ANN-DRL model achieved the highest accuracy score of 80.69%, compared to ANN alone (77.40%), Random Forest (75.55%), Logistic Regression (75.10%), Naïve Bayes (75.19%), and SVM (75.44%). The ANN-DRL model's iterative feedback process contributed significantly to its superior performance, highlighting its potential for enhancing cyberbullying detection accuracy [15].
The authors investigated whether Bidirectional Encoder Representations from Transformers (BERT)’s attention mechanisms explain why it makes certain predictions. Previous studies showed that BERT is effective at detecting cyberbullying, but the interpretability of its internal decision-making process remained unexamined. The study fine-tuned BERT (base, uncased) on five datasets (Twitter-Racism, Twitter-Sexism, Kaggle-Insults, WTP-Toxicity, and WTP-Aggression), which together cover a range of abusive language types. The fine-tuned BERT achieved the best performance against traditional DL models with an F1-score of 0.786 on the WTP-Toxicity dataset. The study demonstrated that while fine-tuned BERT outperforms LSTM and Bi-LSTM models, its attention mechanisms do not correlate with gradient-based feature importance scores, indicating that attention weights do not offer faithful explanations for model predictions. A key finding from the study is that BERT depends heavily on syntactic elements such as determiners and auxiliaries rather than on bullying-related lexical content. This means that the model relies on superficial linguistic markers rather than genuine semantic understanding. The authors recommend using gradient-based explanation techniques and training on more diverse datasets that are syntactically diverse. This combined strategy would improve interpretability, generalization, and fairness [16].
Another study proposed a semantic-enhanced marginalized denoising auto-encoder (smSDA) for text-based cyberbullying detection, addressing the challenge of learning robust representations from short and noisy social media messages. The method extends the marginalized stacked denoising auto-encoder (mSDA) with two innovations: first, semantic dropout noise assigning a higher corruption probability to bullying features, and second, sparsity constraints via L1 regularization to capture meaningful word correlations. Bullying features were automatically constructed using a predefined insulting word list (350 words) expanded via word embeddings (Word2Vec on 400 million tweets) with a cosine similarity threshold of 0.8. Subsequent layers updated bullying features using the Fisher score. Evaluated on Twitter (7,321 instances, 4,413 features) and MySpace (1,539 instances, 3,240 features) with small training sets (800 and 400 samples), smSDA outperformed BoW, LSA, LDA, and mSDA. On Twitter, smSDA achieved 84.9% accuracy and 71.9% F1-score compared to mSDA (84.1% accuracy, 70.4% F1-score). On MySpace, it achieved 89.7% accuracy and 77.6% F1-score compared to mSDA (88.0% accuracy, 76.0% F1-score). By focusing exclusively on text and ignoring word order, the model may fail to capture important syntactic patterns. Future work should incorporate sequential information to improve performance [17].
Other researchers introduced an automated DL framework called SBiGRU-BCO for cyberbullying detection on SM platforms. The model combined Stacked Bidirectional Gated Recurrent Unit (SBi-GRU) with an attention mechanism, BERT embedding, and Binary Chimp Optimization (BCO)-based feature selection. This methodology begins with data preprocessing, including stop word removal and text normalization. The model achieved strong performance with an accuracy of 99.12% and an F1-score of 93.91%. The datasets were sourced from three SM platforms: Formspring with 10,000 samples, Instagram with 12,000 samples, and MySpace with 8,500 samples. The datasets are public and are binary-annotated as cyberbullying and non-cyberbullying. The authors deployed BERT to categorize aggressive content and used attention mechanisms to improve the sequential semantic representations in textual cyberbullying detection. The authors proposed the use of Feature Density (FD) calculations to quantify dataset complexity. The feature selection process employs Binary Multi-Objective Chimp Optimization (BMCO) for identifying optimal feature subsets to improve classification performance. Based on a comparative analysis, the proposed approach significantly outperformed existing methods such as BiGRU and CNN. The research presents practical solutions enabling real-time intervention in cyberbullying incidents for online safety measures [18].
The authors introduced ELECTRA_POS as a pretraining methodology for transformer models, integrating Part-of-Speech (POS) information through a Greek-letter substitution approach. The key innovation involves replacing standard POS tags with Greek letters (e.g., 'VERB' becomes 'δ') and appending them to each word before processing with the SentencePiece Unigram tokenizer. This methodology enhances the model’s comprehension of linguistic structure and contextual nuances. The model was evaluated against a retrained baseline (ELECTRA_Vanilla) on the GLUE benchmark and a specific cyberbullying detection task. The ELECTRA_POS model demonstrated a notable gain in recall compared to ELECTRA_Vanilla, achieving 0.6209 compared to 0.5878. This indicates a superior ability to identify true positives (TPs) of harmful online behavior. The research confirms that integrating grammatical features, such as POS tags, into transformer architectures benefits both cyberbullying detection and general NLP tasks. However, the fusion of POS tags presents challenges, including increased computational load from longer sequences and a lack of standardized tagging across datasets, indicating a need for further optimization. In summary, this study demonstrates that the fusion of grammatical information can improve a model’s contextual understanding; future work should focus on hyperparameter tuning, learning rate optimization, and comparison with other transformers [19].
Researchers introduced an interpretable hybrid model for multiclass cyberbullying detection. The novel approach employs a hybrid ensemble framework integrating Bidirectional Encoder Representations from Transformers (BERT) to generate contextual sentence embeddings from social media text and SVM with grid-search optimization for discriminative multiclass classification. The model classifies tweets into five categories: Cybertalking, Doxing, Revenge Porn, Sexual Harassment, and Slut Shaming. The proposed model combines BERT’s strength in semantic understanding with SVM’s efficiency and discriminative power in high-dimensional spaces. The model demonstrated high efficacy, achieving a 90% accuracy rate on test data, outperforming individual baseline models including BERT alone (87%), BiLSTM (85%), and traditional ML baselines. The authors also deployed the Shapley Additive exPlanations (SHAP) framework to enhance model transparency by explaining the reasons behind the proposed model’s predictions. The primary contribution is a validated hybrid architecture; however, the model’s validation on a small balanced dataset (2,140 tweets) may not fully represent the noise and imbalance of real-world social media streams, which remains an open question for future research [20].
Authors explored the use of graph convolutional networks (GCNs) for the categorization of online harassment on Twitter by modeling tweets as nodes in a semantic similarity graph rather than using sequence-based DL models and analyzed the relational structure between tweets based on their semantic content. The dataset consisted of 10,622 English Twitter posts labeled for harassment across three categories: “indirect”, “sexual,” and “physical” harassment. Each tweet was transformed into a node in a single undirected graph. Edges were weighted by the cosine similarity of the tweet’s Sentence-BERT (SBERT) embeddings, connecting each node to its five most semantically similar neighbors. Nine classical machine-learning classifiers, including Logistic Regression, Random Forest, Naïve Bayes, Decision Tree, SVMs, and ensemble methods, were evaluated as baselines using TF-IDF and Word2Vec features, while the proposed two-layer GCN model used SBERT embeddings as node features, with evaluation performed via 10-fold cross-validation. In the binary classification task (harassment vs. non-harassment), the GCN model outperformed all classical models, achieving the highest accuracy. For multi-class classification into the three harassment categories, Random Forest obtained the best performance with an average accuracy of 93.5%; GCN still outperformed most other classical approaches. The study also found that TF-IDF representations were more effective than Word2Vec embeddings for this task, as the pre-trained word vectors failed to capture the informal and abusive language characteristic of tweets. An additional experiment using only 50% of the training data showed that the GCN’s accuracy decreased by just 3%, demonstrating its robustness in learning from limited labeled data. The study concludes that GCNs are an efficient and powerful tool for harassment detection, capable of learning effective representations from both text semantics and graph structure. The main limitations identified were the imbalanced class distribution and the computational cost of graph construction. Future research directions include exploring alternative graph neural architectures on larger multilingual datasets and integrating the temporal dynamics of conversations [21].
Researchers explored the use of a GCN named SOSNet for fine-grained multiclass cyberbullying detection on Twitter by building a global graph of semantically related tweets and analyzing the conceptual connections between tweets to construct a global semantic similarity graph for classification purposes. The authors created and used a novel balanced dataset of 69,767 English Twitter posts labeled for cyberbullying targeting five victim attributes: age, ethnicity, gender, religion, and other. Each tweet was represented as a node in a single undirected graph, with edges created between tweets based on a threshold cosine similarity of their embeddings. Eight tweet embedding methods, including BOW, TF-IDF, word2vec, GloVe, fastText, BERT, DistilBERT, and SBERT, were evaluated in combination with seven classifiers: Logistic Regression, Naïve Bayes, KNN, SVM, XGBoost, Multi-Layer Perceptron, and the proposed SOSNet GCN, with evaluation performed using 5-fold stratified cross-validation. The proposed two-layer SOSNet model used a similarity threshold to filter significant semantic connections when constructing the graph adjacency matrix. On the full 40,000-tweet dataset, BOW+XGBoost and TF-IDF+XGBoost achieved the highest accuracy and F1 scores, indicating that lexical features are highly discriminative for this fine-grained task. However, on a smaller 4,000-tweet dataset, SBERT+SOSNet achieved the highest accuracy and F1-score, matching or exceeding traditional classifiers and demonstrating its effectiveness with limited data. The study also found that SBERT emerged as the most robust embedding across classifiers, while Dynamic Query Expansion (DQE) successfully addressed severe class imbalance as a semi-supervised method that collects and balances natural data, unlike synthetic methods such as ADASYN or SMOTE. The study confirmed that GCNs are a powerful method for fine-grained detection, effectively leveraging semantic graph structure among tweets, especially when data is limited, and establishes DQE as a superior alternative for creating balanced social media datasets. This study’s future work should explore other GNN architectures, apply DQE to other social media data mining tasks, and test the models on multilingual and larger-scale social media datasets [22].
3.1 Term Frequency-Inverse Document Frequency
TF-IDF is a statistical method that measures the importance of a word within a document relative to a collection of documents. In classification, TF-IDF assigns greater importance to a word that occurs more frequently in the corpus. This method is more effective than assigning equal importance to each word, as in bag-of-words, for example [9].
For more details, Term Frequency (TF) is the number of times a term appears in a document divided by the total number of terms in the document, as defined in Eq. (2):
$T F($word$)=\frac{(\text { Number of times term appears in a document})}{(\text {Total number of terms in the document})}$ (2)
The Inverse Document Frequency (IDF) is the logarithm of the total number of documents divided by the number of documents containing that term, as defined in Eq. (3):
$\operatorname{IDF}($word$)=\log \frac{(\text {Total number of documents})}{(\text {Number of documents with term in it})}$ (3)
The TF-IDF score is the product of the TF and the IDF, as expressed in Eq. (4):
$T F I D F=T F($word$) \times I D F($word$)$ (4)
3.2 Graphs and graph representation
A graph in the fields of computer science and mathematics is a mathematical structure comprising a set of nodes connected by links known as edges. In general, relationships between objects, such as those in transportation networks and social networks, are modeled using graphs.
A graphical visualization is often more appropriate for understanding the relationships between nodes. Several tools can be used for this purpose, including Gephi, NetworkX, and Neo4j. In this work, Neo4j is our chosen Graph Database Management System. The choice of Neo4j was deliberate and motivated by its capabilities. This powerful platform for working with graph data can manage, retrieve, and store graph-structured data in the form of nodes, relationships, and properties. It is used in various complex domains, including social media networks, fraud detection, and recommendation systems. Neo4j uses Cypher for manipulating and querying graph data. Neo4j is a native graph processing engine that offers effective optimization for graph processing tasks, enhancing the execution of graph algorithms such as centrality and community detection. Its flexibility allows users to represent a wide range of relationships. Furthermore, Cypher is a declarative graph query language. As simple as SQL, Cypher can design a graph based on your data and retrieve data from graphs.
3.3 PageRank
Developed by Larry Page and Sergey Brin, PageRank is a foundational algorithm for ranking web pages and web information retrieval. It is also well known for its important role in search engine technology, which has made Google’s Web search process more efficient. The principle of PageRank is that it assigns more importance to web pages that have more links pointing to them. Web hyperlinks act as “votes of trust”, and they determine the ranking of web pages. PageRank plays a central role in the field of information retrieval [23].
Two main features describe the original PageRank. The first is the damping factor, which represents the probability that a web surfer randomly jumps from page to page. The damping factor is generally fixed at 0.85, which means that a web surfer has an 85% chance of following a provided link. The remaining 15% accounts for the possibility that the random surfer jumps to new pages that are not linked from the previously surfed pages. The second feature is that the original PageRank algorithm evenly distributes the PageRank score of a given node among its outbound links. Although Google’s PageRank algorithm has proven to be very successful, this even distribution of weights does not necessarily reflect real-world circumstances, because not all outbound links should have the same importance. Differences exist in the quality of web pages, researchers, and journals. Most of these domains reflect a power-law distribution pattern, which shows that a few nodes are important whereas the majority of nodes have very low importance. Therefore, the addition of weights to the PageRank algorithm to account for this observation has recently attracted increasing research interest [23].
Mathematically, PageRank is a function that provides a solution to Eq. (5):
$P R(A)=(1-d)+d\left(\frac{P R(T 1)}{C(T 1)}+\cdots+\frac{P R(T n)}{C(T n)}\right)$ (5)
where,
$A$ is a page; $A$ has pages $T 1$ to $T n$ pointing to it.
$d$ is a damping factor $\in[0,1]$. Its score is usually set to 0.85 .
$C(A)$ is the outgoing link count of page $A$.
3.4 Synthetic Minority Oversampling Technique
Multiple techniques are available to balance datasets so that each class has the same number of samples. These include under-sampling the majority class and over-sampling the minority class by duplicating existing samples.
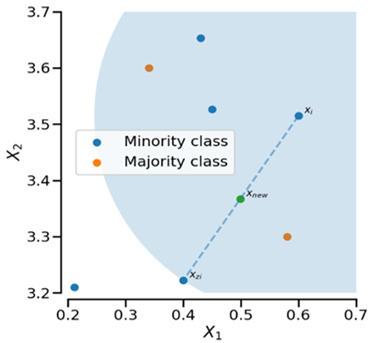
According to the study [24], SMOTE is a ML technique designed to resolve dataset imbalance by generating synthetic features. For a given sample $X i$, a synthetic copy is created using the KNN algorithm. Specifically, the algorithm examines the k nearest neighbors of $X i$ as illustrated in Figure 1 (shown within the blue circle). One of those neighbors $X z i$ is then selected and a new sample Xnew is generated following Eq. (6):
$X n e w=X i+\lambda *(X z i-X i)$ (6)
where, $\lambda$ is a random number between 0 and 1.
Figure 1. Xnew creation illustration using Synthetic Minority Over-sampling Technique (SMOTE) method [24]
3.5 Logistic Regression and Logistic Regression with cross-validation
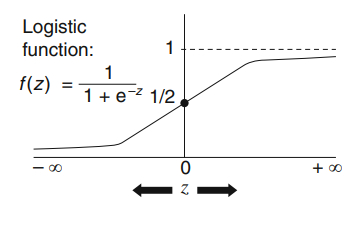
Based on the literature and epidemiological data, logistic regression is the most popular modeling procedure in use. Its popularity stems from its mathematical form (see Figure 2 and Figure 3) [25].
This form is defined by a function denoted as f(z) where: $f(z)=\frac{1}{1+e^{-z}}$. The values of this function are plotted for z ranging from −∞ to +∞.
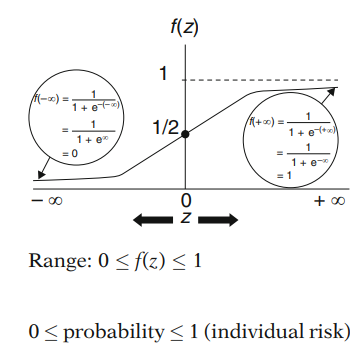
It is important to note that when z is −∞, the logistic function f(z) equals 0, and when z is +∞ f(z) equals 1. As shown in the graph, the range of the function f(z) is between 0 and 1. This is the first reason for the logistic model’s popularity. Because the problem describes a probability, the output must be a number between 0 and 1 [25].
Since the current work addresses a binary classification problem, using logistic regression as the classifier is a suitable choice. Furthermore, there is an interesting derived metric from logistic regression: logistic regression with cross-validation (LR-CV). LR-CV is a resampling method that splits the dataset into multiple subsets; the model is trained on one subset and evaluated on the remaining subset. This process is repeated until all subsets have been used for both training and evaluation. Cross-validation helps to ensure that the model achieves good performance.
Figure 2. The logistic function [25]
Figure 3. The logistic function [25]
3.6 Multinomial Naïve Bayes, Naïve Bayes Bernoulli, and Naïve Bayes complement
Based on Bayes' theorem, the Naïve Bayes technique is a powerful machine-learning algorithm. This classifier can efficiently solve multi-class classification problems, including binary ones. The underlying idea is to find the probability of an event occurring based on the probability of another event that has already occurred [9].
The Naïve Bayes function can be represented as in Eq. (7):
$(A \mid B)=\frac{P(A) * P(B \mid A)}{P(B)}$ (7)
In the Scikit-learn library, several types of Naïve Bayes algorithms are available. The suitable one must be chosen depending on the task requirements and on the dataset at hand. Understanding the use cases for each method is essential to determine which is more appropriate for the present case study. It should be noted that this specificity in algorithm type was not mentioned in previous works; this represents a limitation in the related literature.
On the other hand, a variable can be either discrete or continuous. For each feature type, an appropriate algorithm can be used. More details are provided below:
•Multinomial Naïve Bayes, imported from Scikit-learn using “from sklearn.naive_bayes import MultinomialNB”: is suitable for text classification with discrete features. This classifier requires integer feature counts. The multinomial distribution is a generalization of the binomial (Bernoulli) distribution.
•Bernoulli Naïve Bayes, imported from Scikit-learn using “from sklearn.naive_bayes import BernoulliNB”: like the multinomial method, is used when the data are discrete. Both multinomial and Bernoulli methods work with occurrence counts; Bernoulli is especially suited for binary/Boolean features. Many domains that require binary classification adopt this method, such as spam detection, text classification, and sentiment analysis.
Based on this, we can conclude that the Bernoulli Naïve Bayes algorithm is more appropriate for our case and can yield better results. However, this algorithm cannot handle dataset imbalance effectively and can lead to unsatisfactory results. In general, when dealing with an imbalanced dataset, caution is required when using an ML classification method. The results depend not only on the classifier but also on the quality of the data available.
•Gaussian Naïve Bayes, imported from Scikit-learn using “from sklearn.naive_bayes import GaussianNB”: assumes a normal distribution and is suitable for continuous random variables.
•Categorical Naïve Bayes, imported from Scikit-learn using “from sklearn.naive_bayes import CategoricalNB”: is dedicated to categorical data in which each feature has a specific discrete categorical value. This classifier is not used in text classification and cannot be applied to the present case.
•Complement Naïve Bayes, imported from Scikit-learn using “from sklearn.naive_bayes import ComplementNB”: is an adaptation of the multinomial Naïve Bayes classifier. It was implemented to handle certain severe assumptions and is especially suited for imbalanced datasets.
3.7 Random Forest classifier
The Random Forest classifier is an ensemble of multiple decision trees. Individually, each tree provides a class prediction. The final result is the class with the highest number of predictions (majority vote). The strength of the Random Forest classifier lies in its ability to consider predictions from multiple generated decision trees rather than relying on a single tree; the final output is therefore based on a combination of multiple decisions [9].
Some cyberbullying prediction models have been constructed using the Random Forest algorithm. Decision trees and ensemble learning form the foundation of the Random Forest classifier. The construction process consists of creating multiple random decision trees; the model fits several classification trees to the dataset and then combines the predictions from all of them. Each tree votes for a class; the class with the most votes is selected as the final result [7].
3.8 Support Vector Classifier
SVMs are a collection of supervised ML algorithms. They are used in classification, outlier detection, and regression. Capable of dealing with very high-dimensional spaces while maintaining optimized computational time and good efficiency, SVMs generally achieve high accuracy because they calculate probabilities using a five-fold cross-validation technique [26].
SVMs are supervised learning models defined by the separation of the data space using a hyperplane. Based on the training data, an SVM categorizes new samples by using an optimal hyperplane. This optimal hyperplane is the one that provides the largest margin of separation between two classes. SVM is robust in its ability to handle high-dimensional spaces. Consequently, it is necessary to convert categorical data values to numeric values (as in our current work). SVM is designed for only two classes, meaning that it is suitable for binary classification. It may be difficult to draw the hyperplane when the space is highly dimensional, which can make the model hard to interpret [27].
In summary, SVM is a supervised learning algorithm used in both classification and regression. It is particularly effective for classifying complex datasets in which clear separation margins exist. It can handle high-dimensional spaces even when the number of dimensions exceeds the number of samples.
3.9 Evaluation metrics: Accuracy, precision, recall and F1-score
Average accuracy (Eq. (8)), precision (Eq. (9)), recall (Eq. (10)), and F1-score (Eq. (11)) belong to the family of evaluation metrics. To understand these metrics properly, they must be broken down. True Positive (TP) is a cyber-aggressive tweet that is correctly classified. False Positive (FP) is a non-cyber-aggressive tweet that is misclassified. True Negative (TN) is a non-cyber-aggressive tweet that is correctly classified. False Negative (FN) is a cyber-aggressive tweet that is misclassified. Each metric has its own equation, and these are defined as follows [4]:
Accuracy $=\frac{T P+T N}{T P+F N+T N+F P}$ (8)
Precision $=\frac{T P}{T P+F P}$ (9)
Recall $=\frac{T P}{T P+F N}$ (10)
$F 1-$ Score $=2 * \frac{\text {Precision} * \text {Recall}}{\text {Precision}+ \text {Recall}}$ (11)
AI is a field of computer science aimed at building systems capable of performing tasks that typically require human intelligence, such as understanding human communication, problem-solving, and decision-making. Achieving this is complicated by the dynamic nature of real-world data, which affects the quality of the datasets used to train such systems.
Within this context, classification refers to the task of assigning a predefined category to a given document, a task whose complexity is governed by two factors: the accuracy of the classifier and the high dimensionality of the feature space. Feature selection addresses this issue by identifying a subset of the most pertinent features from the original dataset [27, 28].
4.1 Data collection
The dataset used in this study is a public dataset available on Kaggle [29]. It contains 60,000 tweets labeled for suspicious content related to cyberbullying, stored in a single CSV file (“suspicious tweets.csv”, 4.7 MB). The dataset contains two columns: Message, containing the tweet text, and Label, a binary indicator where 0 denotes “bullying” and 1 denotes “non-bullying”. The dataset is intended for supervised binary classification and consists of raw tweet text that may include usernames and URLs requiring preprocessing. As is typical of real-world social media data, the dataset is imbalanced. Following a balance check, bullying tweets (label 0) represent 10% of the corpus while non-bullying tweets (label 1) represent the remaining 90%.
4.2 Python libraries
The preprocessing and modeling pipeline was implemented in Python, using its standard library alongside NLTK for natural language processing and NumPy, Pandas, Matplotlib, and Scikit-learn for data manipulation, visualization, and ML.
4.3 Data pre-processing
The choice of text representation and feature selection is critical to cyberbullying detection performance. Unfortunately, multiple cyberbullying studies focus primarily on feature selection while ignoring the way the text is represented during preprocessing [30]. The following subsections describe the preprocessing pipeline applied to prepare the raw tweet data for modeling.
4.3.1 Data cleaning
Remove null values: null values impact the reliability, accuracy, and quality of data analysis, making it appropriate to handle this issue in the data preprocessing pipeline before ML modeling or statistical analysis. For our specific dataset, we utilized the dropna() function from the Pandas library in Python. This function provides an effective method for dealing with missing values within Pandas DataFrames by removing any rows containing at least one null value. We selected this approach because it is easy to implement and computationally efficient. It should be noted that after applying dropna() and inspecting the resulting DataFrame, we confirmed that there were no missing values present in our dataset. Consequently, no rows were removed, and the dataset remains intact.
Remove duplicates: duplicate entries have exact or partial identical values across the columns in a dataset. Duplicates can influence database operations, data analysis, and reporting, and they may lead to inefficiencies and inaccuracies. To address this challenge in our work, we applied the drop_duplicates() method from the Pandas library to the DataFrame. This method operates by identifying and removing rows that have identical values across all columns. By default, drop_duplicates() retains the first occurrence of each duplicated row and discards all subsequent duplicates (parameter settings: keep = ’first’). The cleaned DataFrame was then stored as a new object for downstream processing.
Fix contractions: expanding contractions is part of text standardization and language consistency. This step restores shortened forms to their original full form. To implement contraction expansion in our preprocessing pipeline, we utilized the contractions library, a specialized Python package designed for this purpose. The library’s primary function, contractions.fix(), accepts a text string as input and returns a modified string with all recognized contractions expanded to their full forms. In our specific implementation, we imported the contractions library at the beginning of our preprocessing script using the standard import contractions statement. We then applied the contractions.fix() function to the text content of each tweet in the Message column.
Remove single letters: depending on the objectives of the analysis and the context of the data, single-letter tokens may or may not need to be removed. The reasons behind this pre-processing step are several, including noise reduction, vocabulary size reduction, preventing sparsity, and enhancing readability. In our specific preprocessing pipeline, we decided to remove single-letter tokens because the majority of single-letter occurrences were typographical fragments or noise characters rather than meaningful semantic units. To implement single-letter removal, we employed regular expressions (Regex), a powerful pattern-matching tool for text manipulation. After applying this step, we verified the transformation by inspecting random samples of tweets. The resulting cleaned text was passed to subsequent preprocessing stages.
Remove URLs: removing URLs from text is an essential preprocessing step for improving text quality and reducing noise. URLs carry limited semantic value for most downstream tasks and provide limited benefit to a classification model. To implement URL removal in our preprocessing pipeline, we employed a combination of two techniques: regular expressions (Regex) and string manipulation. In addition to the Regex pattern, which can capture a wide variety of URL formats with a single pattern, we incorporated string manipulation techniques to clean the resulting text. We defined a comprehensive URL pattern as follows:
urls = re.finditer(r'http[\w]*:\/\/[\w]*\.?[\w-]+\.+[\w]+[\/\w]+', urlfree)
For the Twitter dataset analyzed in this study, we found that the vast majority of URLs followed the standard formats covered by our pattern.
Remove hashtags (#) and mentions (@): removing hashtags (denoted by the “#” symbol) and mentions (denoted by the “@” symbol) is a common preprocessing step in NLP for social media text. Both elements were removed in our preprocessing pipeline to improve text quality, reduce noise, and standardize the input for downstream modeling. To implement hashtag and mention removal, we employed a filter() function in Python combined with a custom condition to exclude tokens starting with “#” or “@”. The conceptual approach involves splitting the text string into individual tokens (words), filtering out any token that begins with either the “#” or “@” symbol, and rejoining the remaining tokens into a single string with spaces.
Remove punctuation: this step involves eliminating punctuation marks from the text. Punctuation marks are symbols such as question marks, exclamation marks, parentheses, and commas. Their role is to give structure to a sentence, indicate pauses, or express a specific tone while reading. To implement punctuation removal in our preprocessing pipeline, we utilized the string punctuation constant provided by Python’s built-in string module. This constant contains a predefined set of punctuation characters commonly used in English text. The complete content of string punctuation is:
'!"#$%&\'()*+,-./:;< = >?@[\\]^_`{|}~'
Remove digits: removing digits is a standard text preprocessing technique in many NLP pipelines. Digits are the numerical characters 0 through 9 appearing in various forms within text, including isolated numbers and multi-digit sequences. To implement digit removal in our preprocessing pipeline, we adopted a string-manipulation approach using Python’s built-in isdigit() method, which returns True if all characters in a given string are digits (0-9) and False otherwise. The conceptual approach involves splitting the text into individual tokens and checking whether each token is entirely digits; tokens that are purely numerical are removed, while tokens containing a mix of digits and other characters are preserved.
Remove repeated characters: repeated characters occur when a writer intentionally or unintentionally duplicates a character multiple times in succession, such as “Helooooooo”. Such repetitions are used in informal digital communication to convey excitement or frustration and therefore pose several challenges for NLP systems, justifying their normalization or removal. To implement repeated character removal in our preprocessing pipeline, we employed Regular Expressions (Regex). The core idea is to match any character followed by one or more consecutive repetitions of the same character and replace the entire sequence with a single instance of that character.
4.3.2 Data tokenization
Tokenization is the process of decomposing a sentence or corpus into smaller linguistic units called tokens. The tokens could be words or phrases, and tokenization is an essential step in the NLP and text analysis pipeline. Tokenization was performed using the n-gram technique encompassing both unigrams and bigrams as sequences of tokens. A unigram is the simplest type of n-gram output, consisting of a single individual token or word in a text. To implement tokenization in our preprocessing pipeline, we employed a combination of Regular Expressions (Regex) and string manipulation techniques. The Regex pattern \W+ matches non-alphanumeric characters and underscores, automatically excludes punctuation, and splits text on any non-word character. After tokenization, we converted all tokens to lowercase using Python’s built-in x.lower() method. Lowercasing ensures consistency and prevents the word appearing in different cases from being treated as distinct tokens.
4.3.3 Remove stopwords
Stopwords are frequently occurring function words that carry limited semantic content in a given language. These words add no significant meaning to the context in text analysis tasks or NLP tasks, and best practice is to remove them during the preprocessing pipeline in order to focus on the remaining text content. The list of stopwords can vary according to the language and also depends on the text’s context or domain. Stopwords are characterized by high frequency and low information content, and removing them can reduce noise, improve analysis, and increase efficiency. For our cyberbullying detection task, we determined that stopword removal was appropriate because the presence or absence of function words such as “the” was unlikely to be the primary differentiator between bullying and non-bullying tweets. The core abusive content is instead carried by lexical words such as “kill”, “hate,” or “suicide”. To implement stopword removal in our preprocessing pipeline, we utilized two Python libraries: NLTK and Scikit-learn. The decision to use both libraries stemmed from the observation that when using only one stopword list, certain English stopwords remained in the corpus after removal, requiring a complementary list. From NLTK, we retrieved the standard English stopword list using nltk.corpus.stopwords.words('english'), and from scikit-learn we used sklearn.feature_extraction.text.ENGLISH_STOP_WORDS. We then performed a manual review of the combined stopword list to customize it for our specific task.
4.3.4 Stemming
Stemming is the process of reducing words to their morphological root form by removing prefixes and/or suffixes, allowing many words with the same underlying meaning but different forms to be treated as identical. Because morphology varies widely across languages, it is necessary to select a stemming algorithm suited to the language’s specific morphological structure. According to the literature [14, 31], the Porter Stemmer from the NLTK library is one of the most widely used stemming algorithms. In our case, we instantiated the Porter stemming algorithm using NLTK.PorterStemmer() to reduce words to their root form. We selected the classic Porter stemmer for our pipeline because of its widespread use and computational efficiency. After implementing stemming, we performed validation checks to confirm the stemmer was functioning as expected, manually inspecting a random sample of 100 stemmed tokens to verify the results. Stemming was applied after stopword removal to ensure stopwords were removed before stemming, an ordering that is more efficient and prevents stopwords from being mapped to non-standard stems that might no longer be recognized as stopwords.
4.3.5 Untokenization
At this stage, the dataset has been cleaned of noise, and the next step is feature transformation or feature engineering. Directly applying this transformation to tokenized data yields poor results, with features being transformed incorrectly. The solution is to transform tokens back into sentences; that is, each set of tokens is joined to reconstruct a sentence. Untokenization refers to the process of rebuilding a sequence of tokens into its original text, so that the recombined units reconstitute a sentence with the same word order but without the noisy words or characters removed earlier. Untokenization is frequently essential after tokenizing text for NLP tasks such as summarization, machine translation, or text generation since preprocessed text may need to be restored to its original form for specific analyses. It is important to note that there is no dedicated built-in function or universal method for untokenization in standard Python or NLP libraries. In our case, a combination of basic Regular Expressions (Regex) and string manipulation methods, specifically the join() and strip() methods, was sufficient to perform the untokenization task since all tokens were already cleaned and contained no internal spaces or special characters.
4.3.6 Class imbalance
A critical challenge in developing an ML model for cyberbullying detection is the class imbalance present in the Twitter dataset. After performing a balance check on the 60,000 tweets, we observed that bullying tweets (label = 0) constitute only 10% of the dataset, while non-bullying tweets (label = 1) represent the majority at 90%. This class ratio is a characteristic feature of real-world social media data, where harmful content is far less than benign content. To address this imbalance, we employed SMOTE, a technique recognized for its effectiveness in handling imbalanced data, applying it to the training data after TF-IDF vectorization. SMOTE operates in feature space rather than in the original input space, following these steps:
•For each minority-class instance, the KNN are identified among other minority class instances (k = 5).
•One of these KNN is selected randomly.
•The difference vector between the current instance and its selected neighbor is computed.
•The difference vector is multiplied by a random number between 0 and 1.
•A new synthetic instance is generated accordingly.
SMOTE was applied to the training data following TF-IDF vectorization, ensuring that oversampling occurred in the transformed feature space rather than on raw text. SMOTE addressed the class imbalance present in this Twitter cyberbullying detection dataset.
4.4 Feature engineering/feature extraction and data representation
Feature engineering is a key factor and central task in data preparation for the success of any ML model. This process involves selecting, manipulating, and transforming raw data into features. In both supervised and unsupervised ML pipelines, features have a substantial impact on model performance. A simple transformation function can convert features from one representation to another [7, 14].
Is feature transformation, therefore, essential? Yes. ML algorithms require the feature space to be numeric. The input must be a matrix with features in columns and instances in rows. A common approach to applying a machine-learning model to text or sentiment analysis is to transform documents into vectors; this operation is called vectorization. In this study, to perform feature transformation from cleaned text strings to numerical vectors, we imported the TfidfVectorizer class from the sklearn.feature_extraction.text module. After vectorization, each word is represented as a column in the feature matrix. The resulting feature matrix can be used directly as input to any scikit-learn classifier. To verify that the transformation was performed correctly, we called the tfidf_vectorizer.get_feature_names_out() method in scikit-learn to inspect the vocabulary and confirm that the vectorization process captured the expected features.
This verification step confirmed that:
•The vocabulary size was appropriate given the corpus size and preprocessing.
•Common stop words had been successfully excluded.
•Stemming had collapsed morphological variants as expected
•The TF-IDF weights were properly computed.
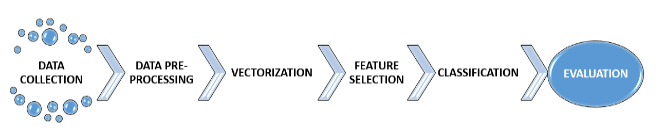
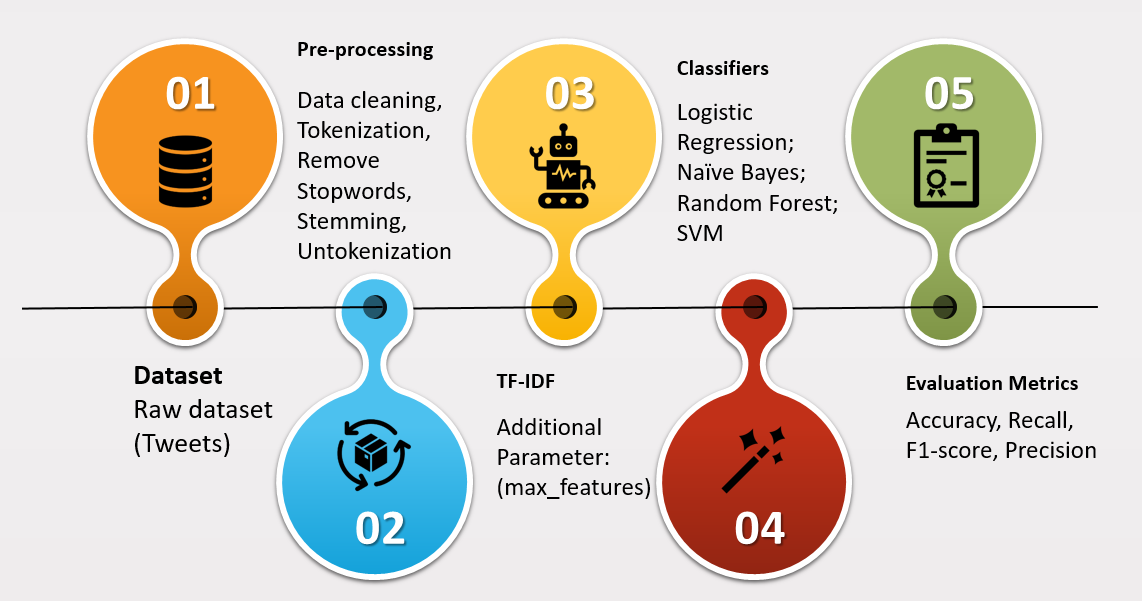
In summary, preparing a raw dataset is a crucial prerequisite for successful classification and evaluation. The essential steps in our methodology are summarized in Figure 4, which outlines the overall process of the proposed approach.
Figure 4. Our actual approach
Figure 5. Data pre-processing
Figure 6. Data cleaning
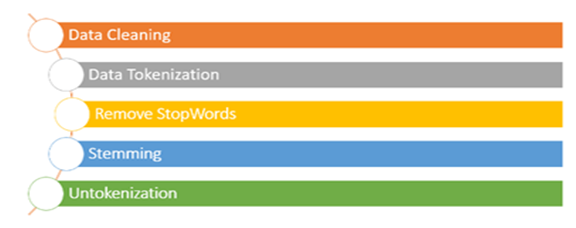
The data preprocessing stage, the second step in our approach, is further divided into five distinct steps, as illustrated in Figure 5. This segmentation ensures a structured and systematic handling of the data, enhancing the quality and reliability of the subsequent analysis.
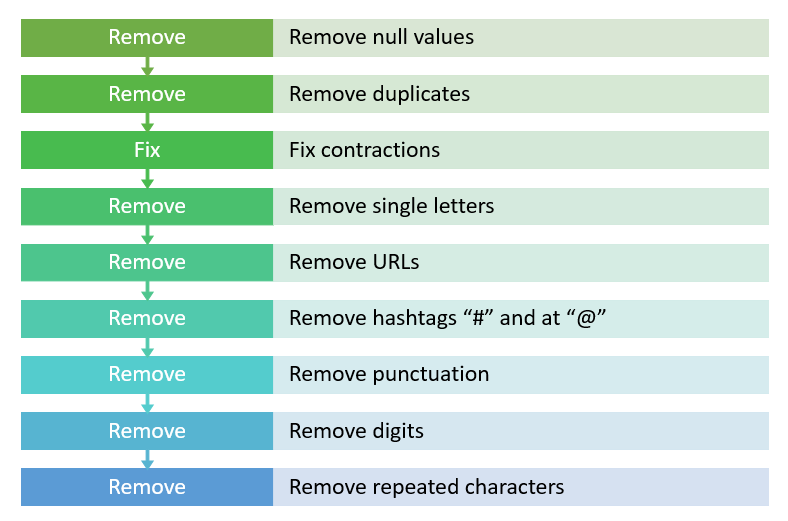
Data cleaning, a fundamental component of data preprocessing, involves several essential tasks aimed at improving data quality. The specific procedures and techniques employed are detailed in Figure 6, which highlights the critical role of this step in the preprocessing workflow.
4.5 Feature selection and feature weighting
Feature selection, also known as attribute selection, is a technique used to reduce the dimensionality of the feature space by identifying and retaining the most informative features, while eliminating irrelevant and redundant ones from the original dataset. The primary objectives of feature selection are to enhance the classification model's speed and accuracy, and to improve its overall performance. Achieving these objectives involves meeting three key goals: improving classification accuracy, accelerating the training and testing processes, and increasing the model's interpretability [32].
Feature selection methods can be broadly categorized into two main types: attribute evaluation algorithms and subset evaluation algorithms. In attribute evaluation algorithms, features are assessed individually, with each feature assigned a weight based on its relevance to the target variable. In subset evaluation algorithms, however, groups of features are selected based on evaluation criteria applied to feature subsets.
Three widely recognized categories of feature selection techniques are filter methods, wrapper methods, and embedded methods. Filter methods involve ranking features based on specific criteria, assigning a score to each feature. These methods are generally efficient and help prevent overfitting [27].
Given the social network structure, which can be represented as a graph, we propose exploring graph-based algorithms for feature ranking. One well-known technique in web information retrieval is the PageRank algorithm. However, while PageRank is effective for ranking web pages, its application to feature ranking for classification may not yield the same level of performance.
This work aims to develop a novel and comprehensive feature ranking strategy that can deliver improved classification results in sentiment analysis. Achieving this goal will involve considering factors such as the method used for graph construction, the nature of the dataset, and the traditional classification techniques employed. To validate the effectiveness of the new strategy, we plan to conduct real-world experiments using our dataset. A comparative analysis with the traditional TF-IDF filter method will be performed to evaluate the improvements in classification performance.
A more detailed explanation of the traditional TF-IDF method and the proposed approach based on the PageRank algorithm is provided in the next section.
4.5.1 First method: Term Frequency-Inverse Document Frequency
TF-IDF is commonly employed for feature extraction, text preprocessing, and tasks such as sentiment analysis and document classification. However, in classification tasks, a higher dimensionality of the feature matrix can increase the problem's complexity, leading to longer computational times and potentially hindering model performance. To address this, the `max_features` parameter can be used to limit the dimensionality of the TF-IDF matrix, thereby improving memory efficiency and model performance. This approach is especially beneficial for handling large vocabularies. In this work, we computed TF-IDF weights for each feature. By setting the `max_features` to 5,000, we limited the vocabulary to the 5,000 most frequent terms for subsequent training and testing with a ML classifier. When creating a `TfidfVectorizer` object with `max_features` set to 5,000, the vectorizer analyzes the text corpus and constructs a vocabulary of the 5,000 most frequent terms based on document frequency. During the transformation process, the TF-IDF matrix is generated using only these top 5,000 terms, while any terms outside this vocabulary are excluded. This strategy ensures that the model focuses on the most significant features, optimizing computational efficiency while retaining the most pertinent information for classification. Setting the default value of max_features from “None” to a fixed number (5,000 in our case) allows us to control the dataset size based on our main constraints. Figure 7 outlines the classification process using TF-IDF as the first method.
Figure 7. The first classification method using Term Frequency-Inverse Document Frequency (TF-IDF)
4.5.2 Second method: Proposed approach based on PageRank algorithm
The typical representation of a social media network involves modeling users as nodes and their interactions as edges connecting those nodes. This representation is displayed as a graph. In this work, we consider words as nodes and the relationships between them as edges.
Overall, representing a social media network as a graph affords a strong framework for identifying influential nodes or communities, analyzing sentiment dynamics within the network, and detecting the most valuable nodes. Many social media network analysis tasks can be addressed through this model, such as content moderation, recommendation systems, and community detection.
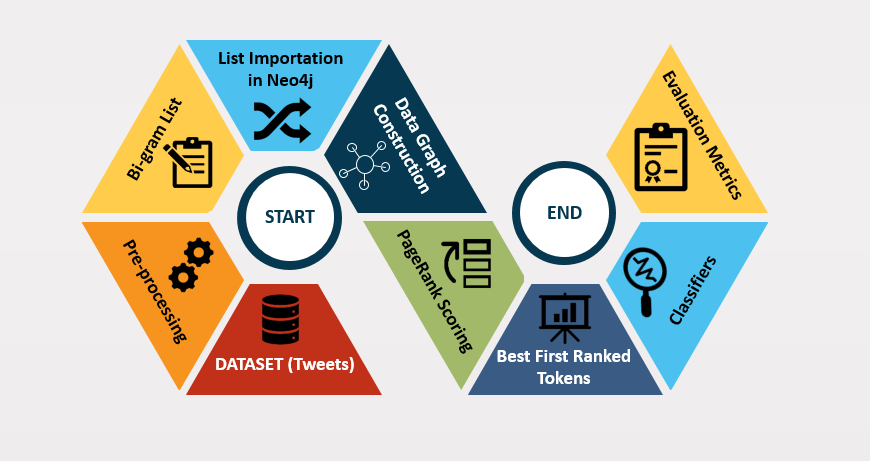
In a traditional machine-learning context, PageRank is not directly applicable to feature selection or feature weighting; however, its capabilities in structural network analysis and propagation can inspire new methods for feature weighting, especially when the data is represented as a graph. In this work, we were inspired by PageRank to address the problem of information retrieval. However, the strong performance of PageRank in web page ranking does not guarantee similar behavior in sentiment analysis. Its effectiveness depends on many factors; therefore, experimentation and validation on our dataset are essential to justify the choice of using a PageRank-inspired method for information retrieval in sentiment analysis or classification. It is also necessary to compare this inspired method to another common feature selection method; in this work, this baseline was TF-IDF as a filter method. In this work, we leveraged a modified PageRank algorithm by incorporating weights, aiming to enhance feature ranking for text classification tasks. The process began with preprocessing the dataset to extract a list of bigram tokens. This list was then imported into Neo4j as a CSV file, where we used the Cypher query language to construct a graph representing features as nodes and their relationships as edges. The size and complexity of the graph increased with the number of nodes and relationships, which in our case consisted of 34,061 nodes and 257,547 edges.
After creating the graph, various properties were assigned to each node and edge to facilitate centrality analysis. We aimed to assign a centrality score to each node using algorithms integrated into Neo4j, including PageRank. Our approach extended the traditional PageRank algorithm by weighting each token's relevance based on its connections within the graph. The PageRank score for each token was computed and ranked using Cypher queries, providing an ordered list of nodes based on their centrality scores.
Figure 8 outlines the classification process using PageRank as a second method.
Figure 8. The second proposed method based on PageRank
To maintain consistency with the approach used in the TF-IDF method, we restricted the final feature set to the top 5,000 ranked tokens. The scores and corresponding node identifiers were exported from Neo4j to a Jupyter environment for further processing. Using Python, we filtered and formatted the data, ensuring that only the top 5,000 nodes were included in the final CSV file, while the remaining data was discarded. This selection process ensured that the most relevant features were retained for subsequent ML tasks.
4.5.3 Term Frequency-Inverse Document Frequency versus PageRank
The core idea behind PageRank is that the importance of a node is determined not only by the number of links pointing to it (in-degree) but also by the importance of the nodes that provide those links. In other words, a link from a highly authoritative page contributes more to the target’s rank than a link from a low-authority page.
Traditional text classification methods such as TF-IDF + NB/SVM operate under the independence assumption. This assumption implies that each document is treated as an isolated vector in a high-dimensional space, and each term is treated independently of others. While this assumption works well in mathematical contexts, it fails to reflect linguistic reality. PageRank directly addresses these limitations by modeling the text corpus as an interconnected graph rather than a collection of independent vectors. Moreover, PageRank can be interpreted as a random walk on the graph-based terms. This probabilistic interpretation provides an intuitive understanding of why PageRank is effective for text classification. Consider a random walker who moves on the graph according to the following rules:
•With probability d (typically 0.85), the walker follows an outgoing edge from the current node.
•With probability 1-d, the walker teleports to a seed node.
The PageRank score of a node is the stationary probability that the random walker visits that node after many steps. The random walk interpretation provides a probabilistic justification for why PageRank propagates influence through the graph. A new token that shares terms with known cyberbullying tweets will have a shorter hitting time to the cyberbullying seed, resulting in a high PageRank score. In other words, term nodes receive high scores if they are frequently visited, which occurs when they co-occur with other high-importance terms.
4.6 Training and testing classifiers
The choice of classifier depends on many factors such as problem complexity, the nature of the data, and computational resources. Among the wide range of available classifiers, in this work we focus on four main ones: Logistic Regression, Naïve Bayes, Random Forest, and Support Vector Machine (SVM). The dataset was divided into 80% for training and 20% for testing. Furthermore, while experimenting with our models, we encountered issues related to the algorithmic diversity among the classifiers. Investigating these differences in depth yielded notable results.
4.7 Evaluation metrics: Accuracy, precision, recall and F1-score
In the reviewed literature, the typical evaluation metrics for assessing the performance of cyberbullying detection models are accuracy, F1-score, precision, recall (also known as true positive rate or sensitivity), and Receiver Operating Characteristic-Area Under the Curve (ROC-AUC). These metrics are calculated based on the four outcomes (TP, TN, FP, FN) that characterize a binary classification task. In contrast, only a few studies use the error rate or mean squared error (MSE) [2].
The accuracy score is one of the most common metrics used for classification. However, it is not suitable when the dataset is imbalanced, as it is generally dominated by the majority class. Indeed, some studies employing DL algorithms did not report accuracy. Conversely, F1-score is recommended as a more reliable metric due to its ability to balance recall and precision [2].
Additionally, accuracy can be misleading when the dataset is imbalanced, contains outliers, or experiences overfitting. In such cases, accuracy alone cannot fully assess model performance or reflect its true effectiveness. Therefore, additional metrics such as recall, precision, and F1-score are adopted as they capture aspects that accuracy alone may overlook.
This study aimed to evaluate the effectiveness of prevention systems in mitigating the adverse effects of cyberbullying and reducing victimization. To achieve this goal, a comprehensive literature review was conducted, focusing on studies published between 2020 and 2023. The majority of these recent studies demonstrated promising results by integrating ML and DL techniques for cyberbullying detection and prevention.
To test the theoretical hypotheses established through the literature review, a Twitter dataset was obtained from Kaggle. Several preprocessing steps, as detailed in the Approach section, were performed to prepare a clean dataset suitable for training and evaluation. Since ML algorithms require numerical inputs, the text data were converted into numerical vectors using the TfidfVectorizer. The dataset was then split, with 80% for training and 20% for testing.
To classify tweets as either "bullying" or "non-bullying," four ML algorithms were employed: Logistic Regression, Naïve Bayes, Random Forest, and SVM. The evaluation metrics were based on the four key outcomes of binary classification: TP, TN, FP, and FN. This framework provided a reliable means to assess the performance of each model.
The following section describes the dataset in greater detail and presents the results obtained from the classification experiments.
5.1 Dataset, training/testing process and class imbalance
We selected an annotated Twitter dataset from Kaggle. The dataset comprises tweets categorized into two distinct classes:
•Non-bullying tweets (also referred to as positive tweets): these contain neutral or positive language and are not intended to harm the recipient.
•Bullying tweets: these include offensive words, harassment, or any comments intended to harm the recipient and may affect them psychologically or physically, or both.
The original dataset consisted of 60,000 tweets, organized into two columns: one for the tweet text and another for the corresponding annotation or label. The annotations are Boolean, where "0" indicates a tweet containing malicious content or cyberbullying, and "1" signifies a non-cyberbullying message free of any harassment. The dataset was already annotated, which is essential for supervised ML. For datasets lacking annotations, manual labelling would be required prior to any data transformation.
The dataset exhibited significant class imbalance, with 90% of the tweets labelled as non-bullying and only 10% as bullying. This imbalance creates challenges for the supervised classification process, as it tends to bias the classifier towards the dominant class, leading to suboptimal performance in identifying instances of cyberbullying. As a result, class weighting is necessary to ensure accurate representation of the minority class. No null values were found in the dataset. However, 293 duplicate entries were identified and removed, reducing the total number of tweets to 59,707, consisting of 6,133 bullying tweets and 53,574 non-bullying tweets.
Following preprocessing, the cleaned dataset consisting of 59,707 tweets was divided into two subsets: a training set and a test set. We adopted an 80/20 split, where 80% of the data was allocated for model training and hyperparameter optimization, while the remaining 20% was reserved for final model evaluation. This split ratio was chosen based on established best practices in ML and statistical modeling. The training set contained sufficient examples for the model to learn meaningful patterns, including rare bullying instances; with 47,766 training tweets, all classifiers had adequate data to converge. The test set was large enough to provide statistically reliable performance estimates; with 11,941 tweets, confidence intervals were narrow enough for meaningful comparison.
Additionally, we ensured that the test set remained completely separate from the training set until the final evaluation. This separation prevented data leakage, which occurs when information from the test set influences model training or hyperparameter selection.
To address the class imbalance, we employed SMOTE to balance the number of instances in each class. Classification algorithms were then evaluated on both the original and balanced datasets to assess the impact of the balancing technique on model performance.
For greater clarity regarding the sample sizes used, the following details are notable:
•Imbalanced dataset: 42,859 positive tweets and 4,906 negative tweets as training data. The remainder was kept for the testing set, with 10,715 positive tweets and 1,227 negative tweets.
•Balanced dataset: 42,859 tweets as positive training data and the same number for the negative class. For the test set, there were 10,715 positive tweets and the same number for the negative class.
We selected an appropriate Python environment to support our work effectively. Our choice was the Jupyter environment, owing to its interactive notebook documents that contain live code and text. Additionally, Jupyter can execute cells separately and in any order, and it facilitates the sharing of data visualizations and outputs. A more fluent data science workflow provides better support in terms of execution time and reliability.
5.2 Results of the first method
As detailed in the Approach section, the first classification method employed is TF-IDF. Tables 1 and 2 present the accuracy, precision, recall, F1-score, and error rate achieved after applying classification to the Twitter dataset. Different ML classifiers were applied; however, the results varied depending on the data balance and the classifier used.
Table 1. Term Frequency-Inverse Document Frequency (TF-IDF) performance results with an imbalanced dataset
|
First Method (using TF-IDF) |
Classifier |
Accuracy (%) |
Precision (%) |
Recall (%) |
F1-Score (%) |
Error Rate (Confusion Matrix) |
|
Balanced dataset (1: non-bullying: 53,574 tweets) (0: bullying: 53,574 tweets) |
Logistic Regression |
0.930 |
0.935 |
0.935 |
0.935 |
0.065 |
|
Logistic Regression with cross-validation (LR-CV) |
0.950 |
0.950 |
0.945 |
0.950 |
0.053 |
|
|
Multinomial Naïve Bayes |
0.890 |
0.890 |
0.890 |
0.890 |
0.109 |
|
|
Bernoulli Naïve Bayes |
0.910 |
0.910 |
0.910 |
0.910 |
0.092 |
|
|
Complement Naïve Bayes |
0.890 |
0.890 |
0.890 |
0.890 |
0.109 |
|
|
Random Forest classifier |
0.970 |
0.975 |
0.975 |
0.970 |
0.027 |
|
|
Support Vector Classifier (SVC) |
0.980 |
0.985 |
0.985 |
0.980 |
0.016 |
Table 2. Term Frequency-Inverse Document Frequency (TF-IDF) performance results with a balanced dataset
|
First Method (using TF-IDF) |
Classifier |
Accuracy (%) |
Precision (%) |
Recall (%) |
F1-Score (%) |
Error Rate (Confusion Matrix) |
|
Imbalanced dataset (1: non-bullying: 53,574 tweets) (0: bullying: 6,133 tweets) |
Logistic Regression |
0.960 |
0.498 |
0.603 |
0.558 |
0.044 |
|
Logistic Regression with cross-validation (LR-CV) |
0.980 |
0.504 |
0.544 |
0.526 |
0.024 |
|
|
Multinomial Naïve Bayes |
0.930 |
0.487 |
0.720 |
0.645 |
0.073 |
|
|
Bernoulli Naïve Bayes |
0.970 |
0.524 |
0.545 |
0.533 |
0.034 |
|
|
Complement Naïve Bayes |
0.830 |
0.681 |
0.488 |
0.607 |
0.168 |
|
|
Random Forest classifier |
0.980 |
0.506 |
0.533 |
0.521 |
0.021 |
|
|
Support Vector Classifier (SVC) |
0.970 |
0.500 |
0.560 |
0.531 |
0.029 |
Figure 9. Confusion matrix using Term Frequency-Inverse Document Frequency (TF-IDF) with an imbalanced dataset
For the imbalanced dataset as shown in Figure 9, we present several analytical perspectives as follows:
•Comparing LR-CV and standard Logistic Regression, the former achieved the best scores with an accuracy of 98% and an error rate of 2.4%.
•Comparing Multinomial, Bernoulli, and Complement Naïve Bayes, Bernoulli attained the best scores with an accuracy of 97% and an error rate of 3.4%. However, the Complement model achieved the best precision, reaching 68.1%. Since the dataset is imbalanced, high precision for the Complement model is desirable, as we aim to minimize FP.
Overall, LR-CV and the Random Forest classifier performed better with an accuracy of 98%. On the other hand, the Random Forest classifier achieved an error rate of 2.1%, followed by the LR-CV with an error rate of 2.4%. The SVC also achieved competitive performance with an accuracy of 97% and an error rate of 2.9%.
For the balanced dataset as shown in Figure 10, we present several analytical perspectives as follows:
•Comparing the performance of LR-CV and standard Logistic Regression, the former achieved the best performance, as expected theoretically. LR-CV attained 95% for accuracy, precision, and F1-score, and 94.5% for recall. Furthermore, its error rate was lower than that of standard Logistic Regression, at 5.3%.
•Comparing Multinomial, Bernoulli, and Complement Naïve Bayes, Bernoulli was theoretically expected to achieve the best performance as it is suited for binary classification problems with a balanced dataset. Empirically, this was confirmed. Bernoulli achieved 91% for accuracy, precision, recall, and F1-score. In terms of error rate, Bernoulli achieved 9.2%, which is smaller than that of the other Naïve Bayes classifiers.
Overall, the best-performing classifiers across all metrics were Random Forest and SVC. The Random Forest classifier achieved 97% for accuracy and F1-score and 97.5% for precision and recall. The SVM achieved 98% for accuracy and F1-score and 98.5% for precision and recall.
Figure 10. Confusion matrix using Term Frequency-Inverse Document Frequency (TF-IDF) with a balanced dataset
5.3 Results of the second method
As detailed in Section 4, the second method, inspired by PageRank, is used for information retrieval in sentiment analysis or classification. Table 3 and Table 4 present the accuracy, precision, recall, F1-score, and error rate achieved after applying this algorithm. Different ML classifiers were used; however, the results varied depending on the data balance and the classifier.
Table 3. PageRank performance results with an imbalanced dataset
|
Second Method (inspired by PageRank) |
Classifier |
Accuracy (%) |
Precision (%) |
Recall (%) |
F1-Score (%) |
Error Rate (Confusion Matrix) |
|
Imbalanced dataset (1: non-bullying: 53,574 tweets) (0: bullying: 6,133 tweets) |
Logistic Regression |
0.950 |
0.494 |
0.616 |
0.565 |
0.048 |
|
Logistic Regression with cross-validation (LR-CV) |
0.970 |
0.504 |
0.547 |
0.528 |
0.026 |
|
|
Multinomial Naïve Bayes |
0.920 |
0.487 |
0.761 |
0.686 |
0.082 |
|
|
Bernoulli Naïve Bayes |
0.970 |
0.521 |
0.542 |
0.531 |
0.032 |
|
|
Complement Naïve Bayes |
0.830 |
0.685 |
0.486 |
0.611 |
0.172 |
|
|
Random Forest classifier |
0.980 |
0.508 |
0.530 |
0.521 |
0.020 |
|
|
Support Vector Classifier (SVC) |
0.970 |
0.500 |
0.562 |
0.533 |
0.030 |
Table 4. PageRank performance results with a balanced dataset
|
Second Method (inspired by PageRank) |
Classifier |
Accuracy (%) |
Precision (%) |
Recall (%) |
F1-Score (%) |
Error Rate (Confusion Matrix) |
|
Balanced dataset (1: non-bullying: 53,574 tweets) (0: bullying: 53,574 tweets) |
Logistic Regression |
0.930 |
0.925 |
0.930 |
0.930 |
0.074 |
|
Logistic Regression with cross-validation (LR-CV) |
0.940 |
0.945 |
0.945 |
0.940 |
0.056 |
|
|
Multinomial Naïve Bayes |
0.890 |
0.890 |
0.890 |
0.890 |
0.112 |
|
|
Bernoulli Naïve Bayes |
0.900 |
0.905 |
0.905 |
0.905 |
0.095 |
|
|
Complement Naïve Bayes |
0.890 |
0.890 |
0.890 |
0.890 |
0.111 |
|
|
Random Forest classifier |
0.980 |
0.975 |
0.975 |
0.980 |
0.025 |
|
|
Support Vector Classifier (SVC) |
0.980 |
0.975 |
0.975 |
0.980 |
0.024 |
For the imbalanced dataset in Figure 11, we analyze the results from multiple perspectives as follows:
•When comparing LR-CV and standard Logistic Regression, the former achieved the best scores, with an accuracy of 97% and an error rate of 2.6%.
•When comparing Multinomial Naïve Bayes, Bernoulli, and Complement, Bernoulli achieved the best scores with an accuracy of 97% and an error rate of 3.2%. However, the Complement model achieved the best precision with a score of 68.5%. Precision is particularly important when dealing with an imbalanced dataset, as we aim to avoid false positives (FP) that misclassify bullying messages as positive tweets. Therefore, the most appropriate model in this case is Complement Naïve Bayes, as it is well suited to imbalanced datasets.
•While accuracy is a key metric for evaluating ML algorithms, it performs poorly when the dataset is imbalanced. Moreover, the Random Forest classifier performed better than the other models, with an accuracy of 98% and an error rate of 2%.
For the balanced dataset in Figure 12, we analyze the results from multiple perspectives as follows:
•When comparing the performance of LR-CV and standard Logistic Regression, the former performs best, as theoretical considerations suggest. LR-CV reaches 94% for both accuracy and F1-score; it also achieves 94.5% for both precision and recall. In addition, its error rate is better than that of Logistic Regression, at 5.6%.
•When comparing Multinomial Naïve Bayes, Bernoulli, and Complement, Bernoulli was expected to achieve the best performance as it is designated for binary classification and the dataset is balanced. Empirically, this was confirmed. Bernoulli achieved an accuracy of 90%. In addition, it achieved 90.5% for precision, recall, and F1-score. In terms of error rate, Bernoulli achieved 9.5%, which is lower than the error rates of the other Naïve Bayes classifiers.
Overall, the best-performing classifiers across all metrics were Random Forest and SVC, both achieving the best performance across all metrics. Both achieved an accuracy of 98%, a precision of 97.5%, a recall of 97.5%, and an F1-score of 98%.
Furthermore, as previously detailed, the Random Forest classifier’s final output is based not on a single decision but on multiple decisions. This factor reduces the error rate automatically and increases other metrics, especially accuracy and F1-score. Comparing the results obtained by this classifier using the first and second methods, PageRank clearly outperforms TF-IDF with an accuracy and F1-score of 98%. With TF-IDF, the accuracy and F1-score are 97%. In terms of error rate, PageRank achieves 2.5% compared to TF-IDF’s 2.7%.
Figure 11. Confusion matrix using PageRank with an imbalanced dataset
Figure 12. Confusion matrix using PageRank with a balanced dataset
5.4 Analysis of the experimental results
Empirically, TF-IDF multiplies term frequency by IDF, meaning that words appearing in many documents receive lower weights. For cyberbullying detection, this is problematic because common insults such as “stupid” may appear across many bullying documents, causing TF-IDF to downweight them even when they are highly indicative of the target class. The PageRank approach does the opposite: words that appear frequently in bullying contexts tend to form densely connected subgraphs with high internal PageRank, so they receive high weights regardless of their overall frequency.
Furthermore, TF-IDF is computed on a per-document basis and cannot leverage relationships between words across documents, whereas our token graph aggregates information from the entire corpus simultaneously. When we computed PageRank once on the global successor graph and then used those fixed weights for all tokens, we performed a form of transductive learning in which knowledge about word relationships propagates through the entire dataset. This transformation from tokens to PageRank scores is mathematically elegant because it maps a discrete set of vocabulary items onto a continuous importance scale. A document that reads “I really really really like you” will have many repetitions of “really”. In contrast, “You are a stupid stupid idiot” will have high PageRank tokens concentrated around the abusive words, and the repetition of “stupid” creates self-loops in the successor statistics, providing a strong signal for the classifier.
The PageRank damping factor (0.85) has a subtle interpretation in our context. This indicates that a reader moving through the token graph has an 85% chance of continuing to read the next token in the sequence and a 15% chance of jumping to a random token anywhere in the vocabulary. This models the way humans process language: most of the time we follow the natural flow of text, but occasionally we mentally jump to unrelated concepts. For bullying detection, this damping factor ensures that our PageRank scores are not overly dominated by long chains of insults; even a long chain of abusive tokens will be interrupted by teleportation, preventing any single token from absorbing all importance.
The elegance of our solution lies in its simplicity and interpretability. We did not train a large neural network with millions of parameters or require thousands of labelled examples for fine-tuning. Instead, we observed that bullying leaves traces in the sequential structure of language that can be modelled as a directed graph; PageRank successfully identifies the important nodes in that graph. By importing our token-successor lists into Neo4j and extracting PageRank weights back into Python, we created a pipeline that is both computationally efficient and conceptually transparent. We successfully transformed a text classification problem into a graph centrality problem, solved it with a well-understood algorithm, and mapped it to standard ML classifiers. Recognizing the isomorphism between linguistic sequence and directed graphs opens a new direction in graph-based NLP.
Our work has implications far beyond cyberbullying detection. For many text classification tasks, the sequential structure of language can be captured through graph centrality metrics and used as features for ML. This suggests a new paradigm in which documents are represented as nodes in a global linguistic graph. Sentiment analysis, spam detection, fake news identification, and authorship attribution could all benefit from this approach. In each case, the key insight is the same: word transition patterns reveal latent properties of the text that are not captured by frequency-based methods. Moreover, our approach bridges two communities that rarely interact: graph theorists who study network centrality and NLP researchers who focus on sequential models. By showing that a simple graph algorithm can compete with sophisticated DL methods on a challenging social problem, we invite both communities to explore the common ground.
[1] Topcu-Uzer, C., Tanrıkulu, İ. (2018). Technological solutions for cyberbullying. In Reducing Cyberbullying in Schools, Elsevier, pp. 33-47. https://doi.org/10.1016/b978-0-12-811423-0.00003-1
[2] Elsafoury, F., Katsigiannis, S., Pervez, Z., Ramzan, N. (2021). When the timeline meets the pipeline: A survey on automated cyberbullying detection. IEEE Access, 9: 103541-103563. https://doi.org/10.1109/access.2021.3098979
[3] Aliyu, S., Salehzadeh Niksirat, K., Huguenin, K., Cherubini, M. (2023). On the role and form of personal information disclosure in cyberbullying incidents. Proceedings on Privacy Enhancing Technologies, 2023(4): 468-483. https://doi.org/10.56553/popets-2023-0120
[4] Sadiq, S., Mehmood, A., Ullah, S., Ahmad, M., Choi, G.S., On, B.W. (2021). Aggression detection through deep neural model on Twitter. Future Generation Computer Systems, 114: 120-129. https://doi.org/10.1016/j.future.2020.07.050
[5] Bokaee Nezhad, Z., Deihimi, M.A. (2022). Twitter sentiment analysis from Iran about COVID 19 vaccine. Diabetes & Metabolic Syndrome: Clinical Research & Reviews, 16(1): 102367. https://doi.org/10.1016/j.dsx.2021.102367
[6] Al-Ajlan, M.A., Ykhlef, M. (2018). Optimized Twitter cyberbullying detection based on deep learning. In 2018 21st Saudi Computer Society National Computer Conference (NCC), Riyadh, Saudi Arabia, pp. 1-5. https://doi.org/10.1109/ncg.2018.8593146
[7] Al-Garadi, M.A., Hussain, M.R., Khan, N., et al. (2019). Predicting cyberbullying on social media in the big data era using machine learning algorithms: Review of literature and open challenges. IEEE Access, 7: 70701-70718. https://doi.org/10.1109/access.2019.2918354
[8] Perera, A., Fernando, P. (2021). Accurate cyberbullying detection and prevention on social media. Procedia Computer Science, 181: 605-611. https://doi.org/10.1016/j.procs.2021.01.207
[9] Islam, M.M., Uddin, M.A., Islam, L., Akter, A., Sharmin, S., Acharjee, U.K. (2020). Cyberbullying detection on social networks using machine learning approaches. In 2020 IEEE Asia-Pacific Conference on Computer Science and Data Engineering (CSDE), Gold Coast, Australia, pp. 1-6. https://doi.org/10.1109/csde50874.2020.9411601
[10] Ali, A., Syed, A.M. (2022). Cyberbullying detection using machine learning. Pakistan Journal of Engineering and Technology, 3(2): 45-50. https://doi.org/10.51846/vol3iss2pp45-50
[11] Alsaleh, D., Larabi-Marie-Sainte, S. (2021). Arabic text classification using convolutional neural network and genetic algorithms. IEEE Access, 9: 91670-91685. https://doi.org/10.1109/access.2021.3091376
[12] Lepe-Faúndez, M., Segura-Navarrete, A., Vidal-Castro, C., Martínez-Araneda, C., Rubio-Manzano, C. (2021). Detecting aggressiveness in tweets: A hybrid model for detecting cyberbullying in the Spanish language. Applied Sciences, 11(22): 10706. https://doi.org/10.3390/app112210706
[13] Elgeldawi, E., Sayed, A., Galal, A.R., Zaki, A.M. (2021). Hyperparameter tuning for machine learning algorithms used for Arabic sentiment analysis. Informatics, 8(4): 79. https://doi.org/10.3390/informatics8040079
[14] Chia, Z.L., Ptaszynski, M., Masui, F., Leliwa, G., Wroczynski, M. (2021). Machine learning and feature engineering-based study into sarcasm and irony classification with application to cyberbullying detection. Information Processing & Management, 58(4): 102600. https://doi.org/10.1016/j.ipm.2021.102600
[15] Yuvaraj, N., Srihari, K., Dhiman, G., et al. (2021). Nature-inspired-based approach for automated cyberbullying classification on multimedia social networking. Mathematical Problems in Engineering, 2021: 6644652. https://doi.org/10.1155/2021/6644652
[16] Elsafoury, F., Katsigiannis, S., Wilson, S.R., Ramzan, N. (2021). Does BERT pay attention to cyberbullying? In Proceedings of the 44th International ACM SIGIR Conference on Research and Development in Information Retrieval, Canada, pp. 1900-1904. https://doi.org/10.1145/3404835.3463029
[17] Zhao, R., Mao, K. (2016). Cyberbullying detection based on semantic-enhanced marginalized denoising auto-encoder. IEEE Transactions on Affective Computing, 8(3): 328-339. https://doi.org/10.1109/TAFFC.2016.2531682
[18] Mali, M.K., Pawar, R.R., Shinde, S.A., et al. (2025). Automatic detection of cyberbullying behaviour on social media using Stacked Bi-Gru attention with BERT model. Expert Systems with Applications, 262: 125641. https://doi.org/10.1016/j.eswa.2024.125641
[19] Azmi, N.S.A.B.N., Ptaszynski, M., Masui, F., Eronen, J., Nowakowski, K. (2025). Token and part-of-speech fusion for pretraining of transformers with application in automatic cyberbullying detection. Natural Language Processing Journal, 10: 100132. https://doi.org/10.1016/j.nlp.2025.100132
[20] Aggarwal, P., Mahajan, R. (2024). Shielding social media: BERT and SVM unite for cyberbullying detection and classification. Journal of Information Systems and Informatics, 6(2): 607-623. https://doi.org/10.51519/journalisi.v6i2.692
[21] Orhan, O., Swamy, V.N., Tetzlaff, T., Nassar, M., Nikopour, H., Talwar, S. (2021). Connection management xAPP for O-RAN RIC: A graph neural network and reinforcement learning approach. In 2021 20th IEEE International Conference on Machine Learning and Applications (ICMLA), Pasadena, CA, USA, pp. 936-941. https://doi.org/10.1109/icmla52953.2021.00154
[22] Garg, P., Villasenor, J., Foggo, V. (2020). Fairness metrics: A comparative analysis. In 2020 IEEE International Conference on Big Data, Atlanta, GA, USA, pp. 3662-3666. https://doi.org/10.1109/bigdata50022.2020.9378025
[23] Ding, Y., Yan, E., Frazho, A., Caverlee, J. (2009). PageRank for ranking authors in co-citation networks. Journal of the American Society for Information Science and Technology, 60(11): 2229-2243. https://doi.org/10.1002/asi.21171
[24] Imbalanced Learn (2026). Over-sampling methods. https://imbalanced-learn.org/stable/over_sampling.html, accessed on September 4, 2026.
[25] Kleinbaum, D.G., Klein, M. (2010). Logistic Regression. Springer New York. https://doi.org/10.1007/978-1-4419-1742-3
[26] Scikit Learn. Support Vector Machines. https://scikit-learn.org/stable/modules/svm.html#svm-outlier-detection.
[27] Kumbhar, P., Mali, M. (2016). A survey on feature selection techniques and classification algorithms for efficient text classification. International Journal of Science and Research, 5(5): 1267-1275. https://doi.org/10.21275/v5i5.nov163675
[28] Sarker, I.H. (2022). AI-based modeling: Techniques, applications and research issues towards automation, intelligent and smart systems. SN Computer Science, 3: 158. https://doi.org/10.1007/s42979-022-01043-x
[29] Suspicious Tweets. https://www.kaggle.com/datasets/syedabbasraza/suspicious-tweets.
[30] Talpur, B.A., O'Sullivan, D. (2020). Multi-class imbalance in text classification: A feature engineering approach to detect cyberbullying in Twitter. Informatics, 7(4): 52. https://doi.org/10.3390/informatics7040052
[31] Vijayarani, S., Ilamathi, M.J., Nithya, M. (2015). Preprocessing techniques for text mining—An overview. International Journal of Computer Science & Communication Networks, 5(1): 7-16.
[32] DeySarakar, S., Goswami, S. (2013). Empirical study on filter based feature selection methods for text classification. International Journal of Computer Applications, 81(6): 38-43. https://doi.org/10.5120/14018-2173