Andi Nurul Aulia Trimulia* | Agus Suharyanto | Yatnanta Padma Devia
© 2026 The authors. This article is published by IIETA and is licensed under the CC BY 4.0 license (http://creativecommons.org/licenses/by/4.0/).
OPEN ACCESS
The construction industry has the highest occupational accident rates due to complex, dynamic, and hazardous working conditions. In Indonesia, the construction sector accounts for more than 30% of national occupational injuries, representing the highest safety burden across industries. Despite this, occupational safety and health (OSH) studies in Kupang City, East Nusa Tenggara, Indonesia remain scarce, as the region presents distinct operational conditions, limited OSH implementation, and insufficient safety resource support. This study aims to analyze OSH risks in a building construction project using Failure Mode and Effects Analysis (FMEA), Analytic Hierarchy Process (AHP), and Fault Tree Analysis (FTA). Risk identification involved field observations, interviews, literature review, and questionnaires. FMEA evaluated risks using Severity, Occurrence, and Detection parameters; AHP produced Weighted Risk Priority Number (WRPN) values; and FTA traced root causes. The study identified 61 OSH risks across 29 construction work types, with the highest Risk Priority Number (RPN) of 48 and Detection weight of 0.623. Extreme fatigue in excavation and concrete casting (WRPN = 3.787) was the dominant high-risk category, driven by human, managerial, technical, and environmental factors. Mitigation strategies include schedule regulation, job rotation, safety briefings, and fatigue detection technology. These findings advance OSH management in Kupang City, East Nusa Tenggara, Indonesia, underrepresented in empirical research.
construction risk, Fault Tree Analysis, FMEA-AHP, occupational safety health, worker fatigue, Weighted Risk Priority Number
The construction industry remains one of the most hazardous sectors worldwide, despite sustained advances in occupational safety regulations, technology, and risk management practices. In 2022, the United States Bureau of Labor Statistics recorded 1,069 fatalities among construction workers, with a fatality rate of 9.6 deaths per 100,000 full-time workers [1]. At the global level, the International Labour Organization estimated that occupational accidents and work-related diseases caused approximately 2.93 million deaths in 2019, an increase of more than 5% from 2015. The Asia-Pacific region accounted for nearly 63% of these deaths [2]. These figures show that occupational safety and health (OSH) failures are not isolated events. They reflect persistent weaknesses in hazard recognition, risk prioritization, supervision, and preventive control, particularly in industries characterized by dynamic work environments and multiple interacting hazards.
Indonesia faces a similar and increasingly serious pattern. BPJS Ketenagakerjaan recorded 221,740 occupational accident cases in 2020 and 234,370 cases in 2021. The number rose sharply to 370,747 cases in 2023 [3, 4]. Construction contributes substantially to this burden because project activities involve work at height, heavy equipment, temporary structures, electrical installations, material movement, and continuously changing site conditions. The study [5] reported that the Indonesian construction sector accounts for more than 30% of national occupational injuries. Yet empirical research on construction safety in Indonesia remains insufficient relative to the scale and complexity of the problem. Existing studies also reveal recurring weaknesses, including an underdeveloped safety culture, inconsistent use of personal protective equipment, inadequate supervision, and limited implementation of formal OSH management systems [5, 6].
These problems require closer examination in regional construction settings. Safety risks do not arise solely from technical hazards. They are also shaped by organizational capacity, workforce competence, regulatory enforcement, project scale, contractor characteristics, and local operating conditions. Construction projects in Kupang City, East Nusa Tenggara, operate within a developing regional context that differs from major Indonesian construction centres in terms of infrastructure, access to skilled labour, institutional capacity, safety resources, and project management practices. These contextual differences may influence both the probability of an accident and the effectiveness of existing control measures. However, empirical evidence on OSH risks in building construction projects in Kupang City remains limited [5]. This lack of location-specific evidence restricts the ability of contractors and project managers to identify priority hazards and design controls that respond to the actual conditions of regional construction projects.
A rigorous assessment framework is therefore needed to distinguish critical risks from routine hazards and to explain why priority accidents occur. Failure Mode and Effects Analysis (FMEA) offers a structured approach for identifying potential failure modes and ranking them through the Risk Priority Number (RPN), which combines severity, occurrence, and detection scores [7, 8]. Despite its practical value, conventional FMEA contains important methodological weaknesses. It assigns equal importance to severity, occurrence, and detection, although their relative significance may differ across projects and accident types. It also allows different combinations of severity, occurrence, and detection to produce identical RPN values. Consequently, risks with different implications may receive the same ranking, reducing the discriminatory power of the assessment [9].
The Analytic Hierarchy Process (AHP) can address part of this limitation by assigning relative weights to risk criteria through systematic pairwise comparisons and expert judgment [10, 11]. Integrating AHP with FMEA produces a Weighted Risk Priority Number (WRPN), which reflects the contextual importance of severity, occurrence, and detection rather than treating them as equally influential [12]. This integration strengthens risk prioritization, particularly when project experts possess relevant contextual knowledge that cannot be captured through unweighted numerical scoring. However, FMEA-AHP remains primarily a prioritization instrument. It identifies which failure modes require attention but does not adequately explain the combination of technical, human, and organizational events that produce those failures.
Fault Tree Analysis (FTA) complements FMEA-AHP by tracing a priority accident from the top event to its underlying basic events through logical AND and OR relationships [13]. FTA therefore shifts the analysis from ranking symptoms to examining causal mechanisms. This distinction is essential because effective risk control depends not only on identifying a high-risk event but also on understanding the conditions that allow it to occur. A risk assessment that stops at ranking may lead to generic controls, whereas root cause analysis can support more targeted interventions related to equipment, procedures, supervision, worker behaviour, and organizational systems.
Previous research supports the value of integrating complementary risk assessment methods. An integrated fuzzy FMEA-FTA-AHP model developed for the steel industry demonstrated the analytical value of combining risk weighting with causal analysis [14]. Similarly, integrating FMEA and FTA was found to provide a more complete assessment than applying either method separately [15]. Within the construction sector, falls from height have been identified as a dominant top event in Indonesian building projects [13]. Other studies have also identified falls from height, workers struck by materials, and vehicle-related incidents as major accident categories in Indonesian construction [16]. These findings confirm the recurring nature of critical construction hazards. However, they do not eliminate the need for project-specific analysis because the causes, exposure conditions, and control weaknesses associated with these accidents may differ across regions and projects.
Most Indonesian construction safety studies continue to rely on standalone methods such as Hazard Identification, Risk Assessment, and Risk Control (HIRARC) or Job Safety Analysis (JSA) [6, 17]. These methods are useful for identifying hazards and defining initial control measures, but their analytical scope is often limited. They generally do not assign differentiated weights to risk criteria, resolve the ranking ambiguities of conventional RPN, or model the causal structure of priority accidents. Consequently, the existing literature reveals a clear methodological gap. Few studies have integrated weighted risk prioritization and root cause analysis within a single framework, particularly for building construction projects in developing regional contexts such as Kupang City.
This study addresses that gap by developing an integrated OSH risk assessment framework that combines FMEA, AHP, and FTA for a building construction project in Kupang City, East Nusa Tenggara, Indonesia. The study first identifies potential hazards and associated failure modes. It then uses AHP to determine the relative importance of severity, occurrence, and detection, and applies these weights to calculate the WRPN. Finally, it uses FTA to trace the root causes of the highest-priority risks. This sequential integration is important because each method serves a distinct analytical function: FMEA structures hazard identification, AHP strengthens contextual weighting, WRPN improves risk discrimination, and FTA explains causal pathways.
The study contributes to construction safety research in three respects. First, it provides empirical evidence from Kupang City, a regional construction setting that remains underrepresented in the Indonesian OSH literature. Second, it addresses the limitations of conventional FMEA by incorporating expert-based criterion weighting. Third, it links risk prioritization with root cause analysis, allowing control recommendations to target the mechanisms that generate priority accidents rather than merely responding to their observable outcomes. The resulting framework offers a more systematic, context-sensitive, and evidence-based basis for improving OSH decision-making in regional building construction projects.
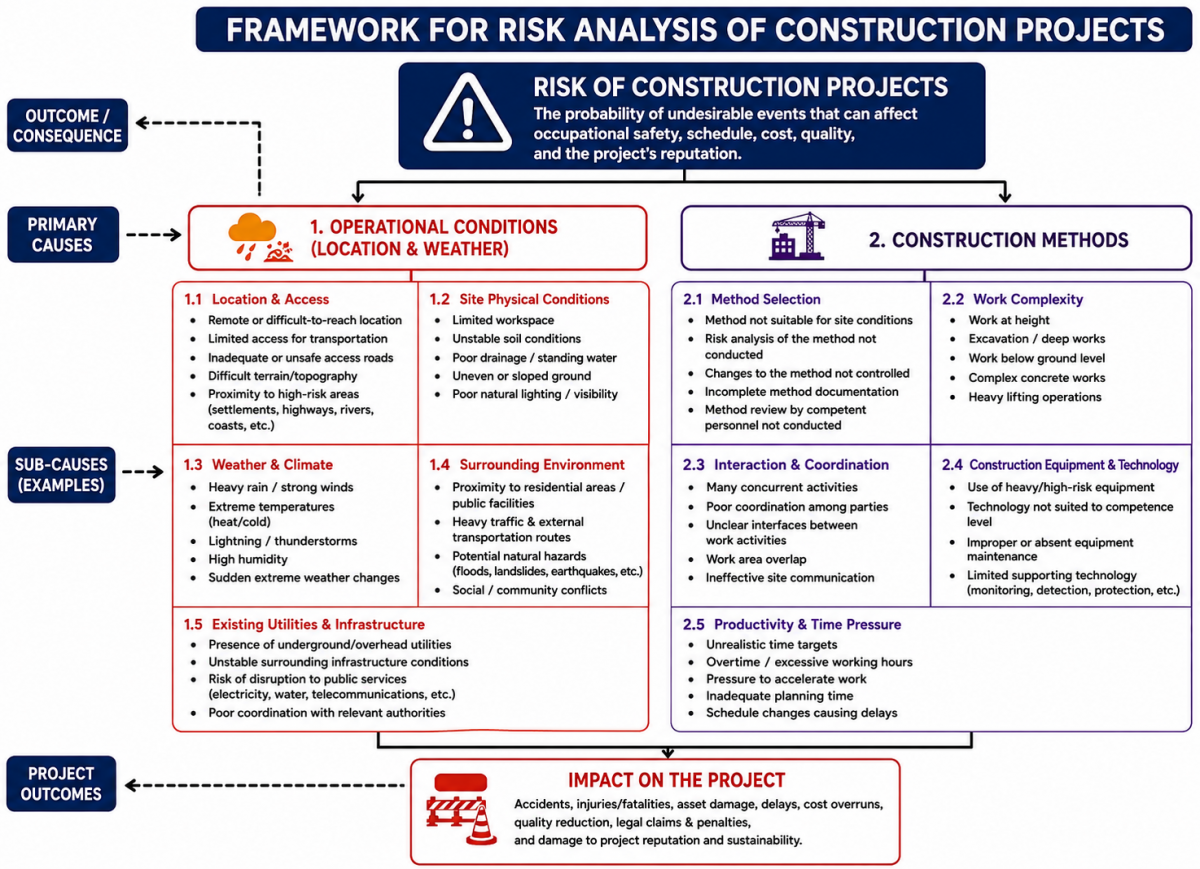
This study develops a risk analysis framework based on the specific characteristics of construction projects in developing regions, encompassing two main categories of risk sources: operational site conditions and construction methods. Operational conditions include location and accessibility, physical site conditions, weather and climate, surrounding environment, as well as existing utilities and infrastructure. Construction methods include method selection, work complexity, inter-party coordination, equipment and technology readiness, and productivity and time pressures. These two categories were identified as the most relevant risk dimensions considering the limitations in OSH implementation, limited safety resources, and different operational site conditions compared with construction projects in urban areas [5, 6, 16]. The accumulation of these risk factors may potentially affect occupational safety, project schedule, cost, quality, and project reputation [18].
2.1 Risk identification
OSH hazard identification was conducted through field observations, interviews with OSH personnel and site supervisors, literature review, and examination of the Construction Safety Plan (RKK) documents in accordance with the Indonesian Ministry of Public Works and Housing Regulation No. 10 of 2021 to obtain comprehensive hazard identification across all project work stages. The population consisted of 81 project workers representing 14 job positions, ranging from managerial personnel to field workers. The sample was determined using disproportional stratified random sampling due to the unequal number of workers in each job category. The sample size was determined using the Slovin formula with a margin of error of 10%, calculated as follows:
$n=\frac{N}{1+N(e)^2}=\frac{81}{1+81(0,1)^2}=44,75 \approx 45$ (1)
Based on the calculation above, the number of workers selected as the sample in this study was 45 respondents, consisting of 2 field supervisors, 1 OSH specialist, 1 structural civil engineer, 1 architect, 1 site engineer, 1 field implementer, 1 safety officer, 1 technical manager, 1 project manager, 2 foremen, 3 head craftsmen, 6 ACP installers, 10 masons, and 14 laborers (helpers). This composition represented various levels of involvement in construction activities, including managerial, technical, supervisory, and operational roles. All 45 respondents participated in the FMEA assessment to evaluate construction safety risks based on the Severity (S), Occurrence (O), and Detection (D) criteria. Among these respondents, five individuals occupying key managerial, technical, and safety-related positions were purposively selected to complete the AHP pairwise comparison questionnaire. These experts consisted of the Project Manager, Site Engineer, OSH Specialist, Safety Officer, and Technical Manager. Therefore, the five experts participated in both FMEA and AHP assessments, while the remaining respondents participated only in the FMEA assessment.
The five experts were selected based on their direct involvement in construction project management, a minimum of five years of relevant professional experience in construction or OSH, and their expertise in safety risk management. The project manager contributed expertise in overall project planning, scheduling, coordination, and risk related decision making, with 15–20 years of relevant experience. The site engineer provided insights into daily construction execution, technical supervision, and field coordination, with 15–20 years of experience. The OSH specialist contributed knowledge related to hazard identification, risk assessment, and occupational safety program implementation, with 10–15 years of experience. The safety officer provided practical perspectives on safety monitoring, routine inspections, and personal protective equipment (PPE) compliance enforcement, with 5–10 years of experience. Meanwhile, the technical manager contributed expertise in technical planning, construction method selection, and quality control, with 15–20 years of experience.
All experts held formal K3 (OSH) professional certification and had direct involvement in construction project management, ensuring that their pairwise comparison judgments reflected substantial field-based expertise relevant to the risk criteria evaluated. This expert composition ensured that the AHP assessment incorporated complementary perspectives from project management, engineering, and occupational safety functions. Since these experts were also included in the FMEA respondent group, the AHP weighting process was based on the same project context evaluated through the FMEA assessment.
Before data collection, the questionnaire instrument was tested to ensure measurement quality and consistency. Validity testing was conducted using Pearson Product-Moment Correlation with the criterion of r-calculated > r-table at a significance level of α = 0.05 (n = 45; r-table = 0.2876), while reliability testing used Cronbach’s Alpha with a minimum value of 0.7. All statistical analyses were performed using SPSS v.25.
2.2 Research location
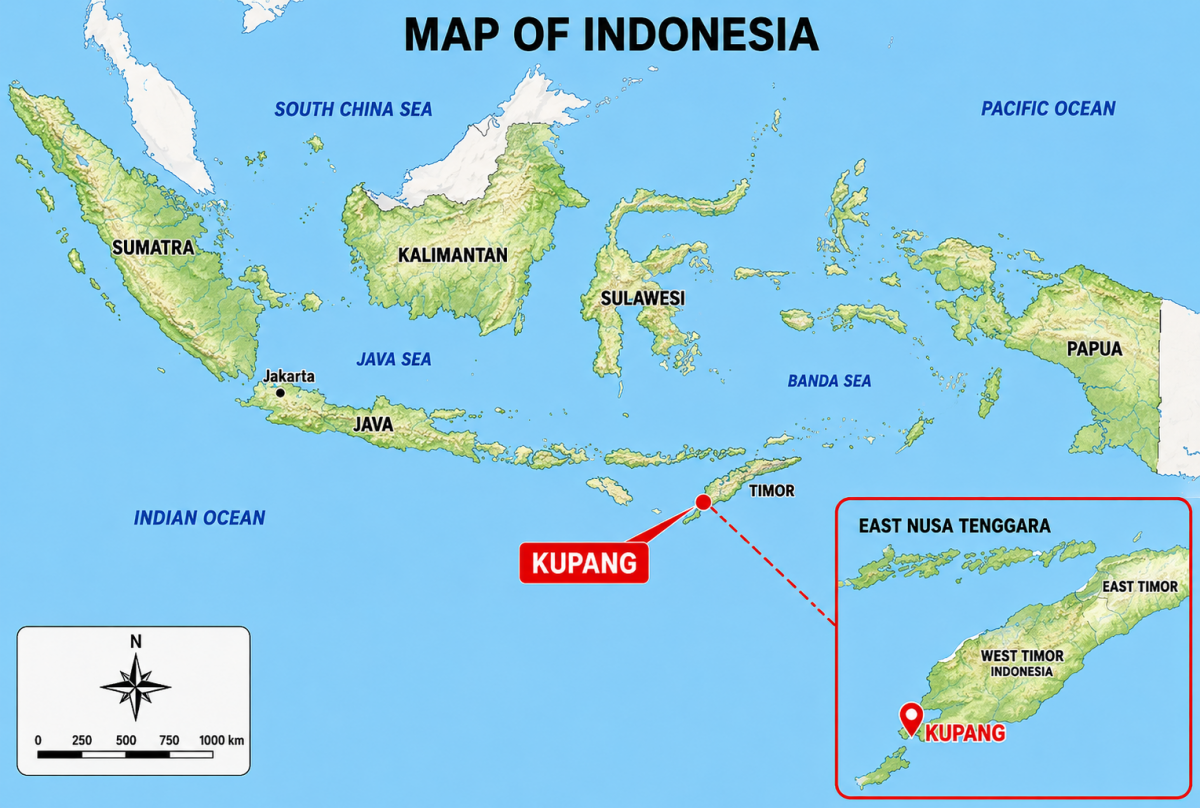
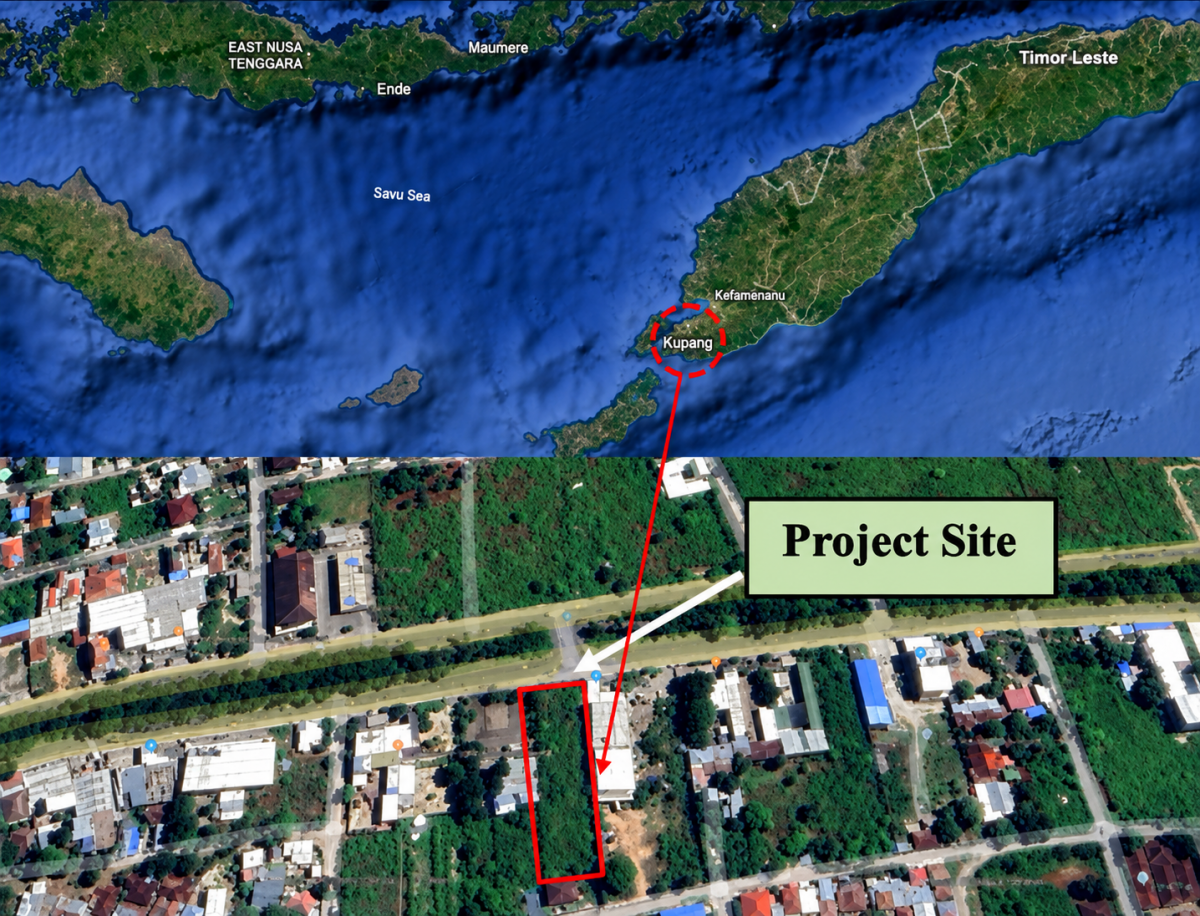
This research was conducted at the construction project of the Pension Fund Office Building in Kupang City, East Nusa Tenggara, Indonesia, which is characterized by a dry tropical climate with average annual temperatures ranging from 27.9–30.7 ℃ and can reach approximately 36.7 ℃ during the dry season, with relative humidity ranging from 69–79% [19]. These conditions create distinct construction project operational characteristics compared to projects in western Indonesia. Furthermore, research related to OSH risk analysis in construction projects in eastern Indonesia remains relatively limited [5, 6, 16]. The map of research location is shown in Figure 1.
Figure 1. Map of research location
2.3 Risk assessment with Failure Mode and Effects Analysis
FMEA was selected as the primary risk assessment method for its ability to simultaneously identify failure modes, their effects, and detection levels within a single structured framework, a capability absent in conventional HIRARC or checklist methods that only evaluate likelihood and impact [8]. Each of the 45 respondents assessed 61 risk scenarios using three ordinal criteria (scale 1–5): Severity (S), Occurrence (O), and Detection (D). The assessment scales are presented in Tables 1–3.
Table 1. Severity rating scale
|
Effect |
Level/Impact |
Value |
|
Very High |
Death, very large material loss |
5 |
|
High |
Serious injury, possibly causing disability or loss of bodily function, large material loss |
4 |
|
Medium |
Moderate injury, lost workdays, requires medical treatment, substantial material loss |
3 |
|
Low |
Minor injury, moderate material loss |
2 |
|
Very Low |
Very minor injury, small material loss |
1 |
Table 2. Occurrence rating scale
|
Occurrence Level |
Rate |
Value |
|
Very high and nearly unavoidable |
1 in 3 |
5 |
|
High and frequently occurring |
1 in 20 |
4 |
|
Moderate and occasionally occurring |
1 in 400 |
3 |
|
Low and rarely occurring |
1 in 15,000 |
2 |
|
Very low and almost never occurring |
1 in 1,500,000 |
1 |
Table 3. Detection rating scale
|
Detection |
Detection Level |
Value |
|
Very Low |
Controls almost cannot detect the failure |
5 |
|
Low |
Controls have very little ability to detect failure |
4 |
|
Moderate |
Controls can sometimes detect failure, but not always |
3 |
|
High |
Controls have a high probability of detecting failure |
2 |
|
Very High |
Controls can detect the form and cause of failure with certainty |
1 |
The Severity (S), Occurrence (O), and Detection (D) scores obtained from the 45 respondents were averaged using the arithmetic mean. To quantify the variability of the respondents’ assessments, the sample standard deviation (SD) was calculated using the equation:
$S D=s=\sqrt{\frac{\sum_{i=1}^n\left(X_i-\bar{x}\right)^2}{n-1}}$ (2)
where, Xᵢ denotes the score assigned by respondent i, x̄ represents the arithmetic mean of all respondents’ scores, and n is the total number of respondents involved in the FMEA assessment. In this study, the FMEA assessment involved 45 respondents who were directly engaged in the construction project and possessed operational knowledge of the identified OSH risks. The respondents comprised project managers, technical managers, site engineers, OSH specialists, safety officers, supervisors, and other technical personnel whose responsibilities were directly related to project execution and workplace safety control.
The FMEA assessment involved 45 project respondents who evaluated the severity, occurrence, and detection dimensions of each identified risk. From these 45 respondents, five individuals were purposively selected as an expert subsample to conduct the AHP pairwise comparison. Thus, the five AHP experts were not additional participants but were included within the original group of 45 FMEA respondents. These five experts participated in both the FMEA and AHP assessments, whereas the remaining 40 respondents participated only in the FMEA assessment.
The five experts were selected based on relevant professional experience, decision-making responsibilities, technical knowledge of construction safety, and recognised OSH certification. Although the same five individuals contributed to both assessments, their roles differed according to the analytical requirements of each method. In the FMEA stage, they contributed to the assessment of the operational characteristics of identified risks together with the other respondents. In the AHP stage, they provided expert judgments regarding the relative importance of the severity, occurrence, and detection criteria. Therefore, the distinction between the FMEA respondent group and the AHP expert subsample refers to their analytical roles rather than to two independent samples.
The weights generated through AHP should therefore be interpreted as expert-derived judgmental weights rather than objective weights. AHP does not produce weights that are independent of human judgment. Instead, it systematically transforms expert preferences expressed through pairwise comparisons into numerical priority weights. Its methodological strength lies not in eliminating subjectivity, but in structuring expert judgment within a transparent decision hierarchy and evaluating the logical consistency of those judgments through the consistency ratio. Accordingly, the resulting weights represent a systematic synthesis of expert judgments rather than purely objective measurements.
For the FMEA assessment, the arithmetic mean was calculated separately for the severity, occurrence, and detection scores of each identified risk. The mean summarised the central tendency of the assessments provided by the 45 respondents. However, the risk matrix adopted in this study follows the discrete ordinal scale of 1 to 5 specified by the Indonesian Ministry of Public Works and Housing [18]. Because this scale classifies risks into ordered integer categories, decimal mean values cannot be directly represented within the categorical risk matrix.
To maintain compatibility with the adopted risk matrix, the calculated mean scores were converted into integer values before the conventional RPN and weighted risk calculations were performed. The initial procedure applied upward rounding, in which each non-integer mean was converted to the next higher integer. This approach was adopted as a precautionary procedure intended to reduce the possibility of underestimating OSH risks by assigning borderline assessments to the higher risk category [20, 21].
For this reason, rounded scores were treated as conservative categorical representations for risk screening and prioritisation rather than as exact empirical measurements. The original arithmetic means and item-specific standard deviations were therefore retained and reported alongside the upward-rounded scores to preserve information concerning the central tendency and variability of respondents’ assessments.
A sensitivity analysis was conducted to evaluate whether upward rounding materially affected the resulting risk prioritisation. Two calculation procedures were compared: (1) WRPN values calculated using the original unrounded mean Severity, Occurrence, and Detection scores, and (2) WRPN values calculated using the corresponding upward-rounded scores. The resulting WRPN values and ranking positions were compared to identify risks whose priority remained stable and those whose relative ranking was sensitive to the upward-rounding procedure.
The final FMEA interpretation therefore considered four complementary elements: the original arithmetic mean, the item-specific standard deviation, the upward-rounded score, and the sensitivity-analysis result. This approach allows the effect of conservative upward rounding to be evaluated transparently while avoiding the interpretation of rounded categorical scores as exact empirical measurements.
After which the conventional RPN value was computed using the equation:
$R P N=S \times O \times D$ (3)
However, as critiqued by the study [9], this approach has a fundamental limitation: of 1,000 possible value combinations, only 120 can be produced by the S × O × D multiplication, severely restricting discrimination between risks. This limitation is addressed by the integration of AHP in the subsequent stage.
2.4 Integrated risk prioritization, causal analysis, and mitigation development
The conventional FMEA assigns equal importance to severity, occurrence, and detection when calculating the Risk Priority Number. This assumption may produce misleading rankings because the three criteria do not necessarily contribute equally to occupational safety and health risk. In construction projects, severity may require greater attention because an event with a low probability can still cause fatalities, permanent disability, substantial financial losses, or major project disruption. Therefore, the Analytic Hierarchy Process was incorporated into the FMEA framework to derive criterion weights from structured expert judgments rather than assuming equal importance among the criteria.
Five experts with relevant knowledge and practical experience in construction risk management evaluated the relative importance of severity, occurrence, and detection. The experts conducted three pairwise comparisons using Saaty’s fundamental scale, as presented in Table 4 [8, 9]. A score of 1 indicated equal importance, while scores of 3, 5, 7, and 9 represented progressively stronger levels of preference. Values of 2, 4, 6, and 8 expressed intermediate judgments. Reciprocal values were assigned when criterion j was considered more important than criterion i. This procedure produced an individual pairwise comparison matrix for each expert.
AHP weights were integrated with FMEA scores to compute the Weighted Risk Priority Number:
$W R P N=\left(w_S \times S_i\right)+\left(w_O \times O_i\right)+\left(w_D \times D_i\right)$ (4)
All 61 risks were ranked by descending WRPN, and simultaneously mapped onto the PUPR Risk Matrix [18] using S and O values to classify risks into Very Low, Low, Medium, High, or Very High categories. The dual-ranking approach provides cross-validation, increasing confidence when both methods yield consistent classifications.
FTA was selected as the root cause analysis method for its ability to deductively trace causal pathways from the top event to basic events using AND/OR logic gates, something that FMEA-AHP cannot do as it only produces risk rankings without causal explanation [22]. FTA was applied to the two risks with the highest WRPN as top events. The FTA procedure begins with defining the top event, then identifying intermediate events through field observation and in-depth interviews. Based on the findings from these interviews, the logical relationships among events were established to determine whether a higher-level event could be caused by any single lower level event (OR gate) or required the simultaneous occurrence of multiple lower level events (AND gate). This process was followed by the identification of basic events. All events were then arranged in an FTA diagram using standard symbols. Finally, minimal cut sets were identified using Boolean algebraic expansion to determine the smallest combination of basic events sufficient to trigger the top event.
Table 4. Analytic Hierarchy Process (AHP) comparison scale
|
Intensity |
Definition |
Description |
|
1 |
Equally important |
Both elements are equally important |
|
3 |
Slightly more important |
One element is slightly more important than the other |
|
5 |
More important |
One element is clearly more important than the other |
|
7 |
Much more important |
One element is very clearly more important |
|
9 |
Absolutely more important |
One element is absolutely more important |
|
2,4,6,8 |
Intermediate values |
Compromise values between two judgments |
|
Reciprocal (1/x) |
Reciprocal value when activity i compared to j becomes reciprocal when j compared to i |
|
The criterion weights obtained through AHP were subsequently integrated with the FMEA scores to calculate the Weighted Risk Priority Number. This integration addresses a major limitation of the conventional RPN, which treats severity, occurrence, and detection as equally important. Under the weighted approach, each criterion contributes to the final score according to its empirically derived priority. Consequently, a criterion regarded by the experts as more critical exerts a greater influence on the final risk ranking.
Mitigation strategies were developed based on integrated results from all three analytical stages: all risks from FMEA are considered in general OSH program development; High Risk risks from WRPN and the PUPR matrix become priority handling focus; and basic events from FTA become specific targets for mitigation interventions at the human, managerial, technical, and environmental factor levels.
3.1 Conceptual framework
Based on the risk analysis framework shown in Figure 2, risk identification in this study was conducted systematically across all construction activities. The framework classifies construction risks into two main aspects, namely operational conditions and construction methods, which collectively influence occupational safety risks and project performance. Operational conditions include location, weather, workspace limitations, and surrounding environmental factors, while construction methods involve work execution, coordination, equipment use, and productivity pressure.
The framework also illustrates the interrelationship between contributing factors and their impacts on accidents, delays, cost overruns, and productivity decline. Therefore, this framework was used as the basis for risk identification, FMEA-AHP analysis, and the development of mitigation strategies for dominant risks in the project.
Figure 2. Conceptual framework
3.2 Occupational safety and health risk identification
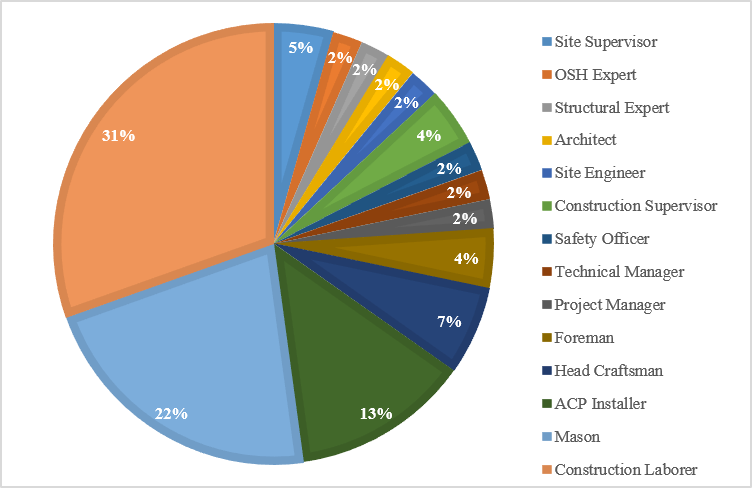
Based on the research conducted, respondent profiles were obtained. Respondent identities based on job positions were taken from the PT. Bank NTT Pension Fund Office Building Construction Project as shown in Figure 3.
In this section, risks encountered during the building construction process were identified through observation, interviews, and occupational accident history data from the project. The risks identified during the building construction process were evaluated using the FMEA method, considering the influence of severity level, occurrence frequency, and detection system. After the values were determined, the RPN was calculated for each hazard. The identified risks are presented in Table 5.
Figure 3. Respondent profile by job position
Across the 61 identified risks, the average standard deviations of the respondents’ raw scores before rounding were 0.64 for Severity, 0.73 for Occurrence, and 0.72 for Detection. These values indicate a moderate overall dispersion in the assessments provided by the 45 respondents. However, an overall average standard deviation alone is insufficient to establish the reliability or consistency of individual risk scores because it may conceal substantial differences in respondent agreement across risk items. A low standard deviation for one risk may coexist with a high standard deviation for another, even when the overall average appears moderate. Therefore, Table 5 reports the arithmetic mean and standard deviation separately for the Severity, Occurrence, and Detection dimensions of each of the 61 risks. This item-level reporting enables a more precise evaluation of the central tendency, dispersion, and degree of respondent agreement associated with each risk score.
The mean values reported in Table 5 represent the original scores obtained from the 45 respondents, whereas the integer values of Severity, Occurrence, and Detection represent the scores generated through upward rounding for the conventional RPN calculation. This distinction is methodologically important. Although upward rounding was adopted as a conservative procedure to reduce the possibility of underestimating OSH risks, it is not statistically neutral. Upward rounding systematically assigns every non-integer mean to the next higher category, regardless of its proximity to the lower or upper integer. For example, mean values of 2.01 and 2.99 are both converted to 3, although they reflect substantially different distributions of respondent judgments. Consequently, the procedure may inflate the input scores and alter the resulting RPN and WRPN values.
Table 5. Risk identification
|
No |
Risk Description |
S |
Mean S |
SD S |
O |
Mean O |
SD O |
D |
Mean D |
SD D |
RPN |
Reference |
|
1 |
Site Clearing |
|
|
|
|
|
|
|
|
|
|
|
|
1.1 |
Struck by demolition debris during site clearing |
2 |
1.533 |
0.505 |
3 |
2.200 |
0.694 |
4 |
3.044 |
0.737 |
24 |
[23-25] |
|
1.2 |
Exposed to dust and extreme heat during clearing |
2 |
1.978 |
0.657 |
4 |
3.533 |
0.869 |
4 |
3.111 |
0.573 |
32 |
[25-27] |
|
1.3 |
Hit by heavy equipment during grading/material transfer |
3 |
2.356 |
0.679 |
2 |
1.556 |
0.503 |
4 |
3.289 |
0.727 |
24 |
[23-25] |
|
2 |
Project Board Installation |
|
|
|
|
|
|
|
|
|
|
|
|
2.1 |
Tool injury during project board fabrication |
2 |
1.800 |
0.786 |
2 |
1.867 |
0.757 |
3 |
2.844 |
0.737 |
12 |
[24, 25] |
|
2.2 |
Struck by board/frame during lifting and installation |
3 |
2.133 |
0.757 |
2 |
1.622 |
0.490 |
3 |
2.978 |
0.583 |
18 |
[23-25] |
|
3 |
Mobilization and Demobilization |
|
|
|
|
|
|
|
|
|
|
|
|
3.1 |
Traffic accident during equipment mobilization |
3 |
2.822 |
0.684 |
2 |
1.844 |
0.706 |
4 |
3.244 |
0.645 |
24 |
[24, 25] |
|
3.2 |
Run over by vehicle/heavy equipment during loading |
3 |
2.378 |
0.576 |
3 |
2.067 |
0.654 |
3 |
2.200 |
0.757 |
27 |
[23-25] |
|
3.3 |
CO gas inhalation from fuel-powered equipment |
2 |
1.578 |
0.499 |
3 |
2.489 |
0.589 |
3 |
2.089 |
0.874 |
18 |
[25-27] |
|
4 |
Construction of Site Office, Workshop, and Warehouse |
|
|
|
|
|
|
|
|
|
|
|
|
4.1 |
Tool injury during site office assembly |
2 |
1.844 |
0.737 |
3 |
2.156 |
0.796 |
3 |
2.467 |
0.588 |
18 |
[24, 25] |
|
4.2 |
Electric shock from non-standard temporary wiring |
2 |
1.556 |
0.503 |
3 |
2.089 |
0.763 |
3 |
2.444 |
0.659 |
18 |
[25, 28, 29] |
|
5 |
Bouwplank Installation |
|
|
|
|
|
|
|
|
|
|
|
|
5.1 |
Struck by material during bouwplank lifting/alignment |
3 |
2.444 |
0.785 |
2 |
2.000 |
0.769 |
3 |
2.578 |
0.543 |
18 |
[23-25] |
|
5.2 |
Exposed to heat and dust during open-area surveying |
2 |
1.578 |
0.657 |
4 |
3.489 |
0.506 |
4 |
3.644 |
0.609 |
32 |
[25-27] |
|
6 |
Excavation (Strip, Foot Plate, Pile Cap, Bore Pile) |
|
|
|
|
|
|
|
|
|
|
|
|
6.1 |
Tool/equipment injury during foundation excavation |
2 |
1.822 |
0.716 |
3 |
2.111 |
0.775 |
3 |
2.311 |
0.668 |
18 |
[23-25] |
|
6.2 |
Struck by material/soil collapse at excavation walls |
2 |
1.933 |
0.720 |
2 |
2.000 |
0.798 |
3 |
2.556 |
0.503 |
12 |
[23-25] |
|
6.3 |
Extreme fatigue from heat in confined excavation area |
3 |
2.244 |
0.773 |
4 |
3.644 |
0.773 |
4 |
3.511 |
0.506 |
48 |
[25] |
|
7 |
Backfilling |
|
|
|
|
|
|
|
|
|
|
|
|
7.1 |
Dry soil dust inhalation during compaction |
2 |
2.089 |
0.668 |
3 |
2.978 |
0.783 |
4 |
3.133 |
0.757 |
24 |
[25-27] |
|
7.2 |
Tool injury (plate compactor) during backfilling |
2 |
1.644 |
0.484 |
2 |
1.978 |
0.723 |
3 |
2.267 |
0.751 |
12 |
[24, 25] |
|
8 |
Rebar Installation (Foundation, Beam, Column, Slab, Top Floor) |
|
|
|
|
|
|
|
|
|
|
|
|
8.1 |
Sprain/trip while arranging or moving rebar |
2 |
1.978 |
0.753 |
3 |
2.067 |
0.720 |
3 |
2.578 |
0.866 |
18 |
[24, 25, 30] |
|
8.2 |
Struck by heavy rebar/material during installation |
3 |
2.933 |
0.751 |
2 |
1.911 |
0.668 |
3 |
2.556 |
0.693 |
18 |
[23, 25, 30] |
|
8.3 |
Fall from height during rebar work due to wind |
3 |
2.556 |
0.503 |
2 |
1.956 |
0.737 |
3 |
2.400 |
0.720 |
18 |
[25, 31, 32] |
|
9 |
Formwork Installation (Foundation, Beam, Column, Slab, Top Floor) |
|
|
|
|
|
|
|
|
|
|
|
|
9.1 |
Struck/pinched by beam or board during installation |
3 |
2.022 |
0.723 |
3 |
2.067 |
0.751 |
2 |
1.978 |
0.753 |
18 |
[23-25] |
|
9.2 |
Fall from height due to unstable scaffolding |
2 |
2.000 |
0.739 |
2 |
1.956 |
0.638 |
3 |
2.333 |
0.640 |
12 |
[25, 31, 32] |
|
10 |
Concrete Casting (Foundation, Beam, Column, Slab, Top Floor) |
|
|
|
|
|
|
|
|
|
|
|
|
10.1 |
Struck by concrete/equipment during casting |
2 |
1.689 |
0.468 |
2 |
1.911 |
0.733 |
2 |
1.933 |
0.720 |
8 |
[23, 25, 30] |
|
10.2 |
Extreme fatigue during casting due to extreme heat |
3 |
2.356 |
0.609 |
4 |
3.511 |
0.506 |
4 |
3.378 |
0.576 |
48 |
[25] |
|
11 |
Formwork Removal |
|
|
|
|
|
|
|
|
|
|
|
|
11.1 |
Hand pinched/lacerated while removing boards |
2 |
1.844 |
0.737 |
3 |
2.756 |
0.933 |
3 |
2.689 |
0.925 |
18 |
[24, 25, 30] |
|
11.2 |
Struck by falling formwork material during removal |
2 |
1.956 |
0.737 |
3 |
2.222 |
0.704 |
3 |
2.111 |
0.745 |
18 |
[23, 25, 30] |
|
12 |
Concrete Chipping |
|
|
|
|
|
|
|
|
|
|
|
|
12.1 |
Struck by concrete fragments during chipping |
3 |
2.222 |
0.795 |
3 |
2.067 |
0.751 |
3 |
2.400 |
0.720 |
27 |
[23-25] |
|
12.2 |
Eye injury from concrete fragments during breaking |
2 |
1.956 |
0.767 |
3 |
2.289 |
0.695 |
3 |
2.400 |
0.720 |
18 |
[24-26] |
|
13 |
Brick Wall Construction |
|
|
|
|
|
|
|
|
|
|
|
|
13.1 |
Struck by falling bricks during placement |
3 |
2.044 |
0.767 |
3 |
2.244 |
0.712 |
3 |
2.178 |
0.716 |
27 |
[23-25] |
|
13.2 |
Scaffold collapse injury during brick wall work |
3 |
2.111 |
0.682 |
3 |
2.222 |
0.765 |
3 |
2.533 |
0.588 |
27 |
[25, 31, 32] |
|
14 |
Plastering and Finishing |
|
|
|
|
|
|
|
|
|
|
|
|
14.1 |
Fall from height during wall plastering |
2 |
1.933 |
0.654 |
3 |
2.089 |
0.763 |
3 |
2.533 |
0.505 |
18 |
[25, 31, 32] |
|
14.2 |
Skin/eye irritation from cement mortar splatter |
2 |
1.756 |
0.570 |
3 |
2.600 |
0.580 |
3 |
2.422 |
0.892 |
18 |
[24-26] |
|
15 |
Door, Window, and Vent Installation |
|
|
|
|
|
|
|
|
|
|
|
|
15.1 |
Trip on cable or electric shock during installation |
2 |
1.844 |
0.601 |
3 |
2.133 |
0.757 |
3 |
2.178 |
0.777 |
18 |
[25, 28, 29] |
|
15.2 |
Dust/wood particle inhalation during cutting |
2 |
1.733 |
0.618 |
3 |
2.933 |
0.780 |
3 |
2.422 |
0.657 |
18 |
[24-26] |
|
16 |
Acoustic Ceiling Installation |
|
|
|
|
|
|
|
|
|
|
|
|
16.1 |
Fall from ladder during ceiling panel installation |
2 |
1.667 |
0.477 |
3 |
2.133 |
0.694 |
3 |
2.511 |
0.991 |
18 |
[25, 31, 32] |
|
16.2 |
Inhaling dust/fibers from acoustic panels |
2 |
1.667 |
0.477 |
3 |
2.800 |
0.991 |
3 |
2.533 |
0.505 |
18 |
[24-26] |
|
17 |
Granite Floor Installation |
|
|
|
|
|
|
|
|
|
|
|
|
17.1 |
Cutting tool injury during granite sizing |
3 |
2.200 |
0.694 |
3 |
2.089 |
0.793 |
3 |
2.022 |
0.783 |
27 |
[23-25] |
|
17.2 |
Chemical exposure on skin/hands during finishing |
3 |
2.111 |
0.647 |
3 |
2.267 |
0.720 |
3 |
2.356 |
0.679 |
27 |
[24-26] |
|
18 |
Wall Painting |
|
|
|
|
|
|
|
|
|
|
|
|
18.1 |
Paint/solvent fume inhalation (dizziness, breathing issues) |
2 |
1.844 |
0.673 |
3 |
2.933 |
0.751 |
3 |
3.000 |
0.769 |
18 |
[25, 26] |
|
18.2 |
Fall from height during wall painting |
3 |
2.067 |
0.688 |
3 |
2.067 |
0.688 |
3 |
2.422 |
1.033 |
27 |
[25, 31, 32] |
|
19 |
Cubicle Partition Installation |
|
|
|
|
|
|
|
|
|
|
|
|
19.1 |
Dust/particle inhalation during cutting/installation |
2 |
1.778 |
0.735 |
4 |
3.022 |
0.753 |
3 |
2.200 |
0.894 |
24 |
[24-26] |
|
19.2 |
Fall from ladder during partition installation |
2 |
1.867 |
0.694 |
3 |
2.178 |
0.806 |
3 |
2.400 |
0.780 |
18 |
[25, 31, 32] |
|
20 |
Facade Installation |
|
|
|
|
|
|
|
|
|
|
|
|
20.1 |
Struck by falling facade panel during installation |
3 |
2.022 |
0.723 |
3 |
2.089 |
0.793 |
3 |
2.244 |
0.645 |
27 |
[23-25] |
|
20.2 |
Fall from height during facade panel installation |
2 |
1.867 |
0.625 |
3 |
2.067 |
0.720 |
3 |
2.422 |
0.723 |
18 |
[25, 31, 32] |
|
21 |
Pipe Installation |
|
|
|
|
|
|
|
|
|
|
|
|
21.1 |
Welding spatter burns during pipe joining |
3 |
2.044 |
0.673 |
3 |
2.111 |
0.775 |
3 |
2.311 |
0.733 |
27 |
[25, 32] |
|
21.2 |
Hand scratch/pinch during pipe cutting/joining |
2 |
1.844 |
0.562 |
3 |
2.333 |
0.603 |
3 |
2.200 |
0.726 |
18 |
[24, 25] |
|
22 |
Wiring |
|
|
|
|
|
|
|
|
|
|
|
|
22.1 |
Eye injury from cable dust during conduit drilling |
2 |
1.933 |
0.539 |
4 |
3.067 |
0.688 |
3 |
2.333 |
0.707 |
24 |
[24-26] |
|
22.2 |
Fall from height during cable/electrical installation |
2 |
1.667 |
0.477 |
3 |
2.133 |
0.694 |
3 |
2.511 |
0.991 |
18 |
[25, 31, 32] |
|
23 |
Connecting |
|
|
|
|
|
|
|
|
|
|
|
|
23.1 |
Slip/trip on scattered materials during connecting |
2 |
1.756 |
0.435 |
3 |
2.933 |
0.939 |
2 |
1.956 |
0.706 |
12 |
[24, 25] |
|
23.2 |
Fall from height during connection work |
2 |
1.800 |
0.625 |
3 |
2.044 |
0.706 |
3 |
2.244 |
0.773 |
18 |
[25, 31, 32] |
|
24 |
Welding |
|
|
|
|
|
|
|
|
|
|
|
|
24.1 |
Hand burn/laceration from direct welding spatter |
2 |
1.889 |
0.647 |
3 |
2.200 |
0.842 |
3 |
2.289 |
0.661 |
18 |
[25, 28, 29] |
|
24.2 |
Electric shock from contact with welding equipment |
2 |
1.778 |
0.735 |
3 |
2.178 |
0.716 |
3 |
2.333 |
0.603 |
18 |
[25, 28, 29] |
|
25 |
Armature Installation |
|
|
|
|
|
|
|
|
|
|
|
|
25.1 |
Electric shock during live cable/armature installation |
2 |
1.733 |
0.447 |
3 |
2.289 |
0.695 |
3 |
2.578 |
0.543 |
18 |
[25, 28, 29] |
|
26 |
Sanitary Installation |
|
|
|
|
|
|
|
|
|
|
|
|
26.1 |
Musculoskeletal injury lifting sanitary fixtures |
2 |
1.778 |
0.420 |
3 |
2.089 |
0.763 |
3 |
2.378 |
0.650 |
18 |
[23-25] |
|
26.2 |
Trip on scattered tools/materials during installation |
2 |
1.756 |
0.435 |
3 |
2.933 |
0.939 |
2 |
1.956 |
0.706 |
12 |
[24, 25] |
|
27 |
Plumbing |
|
|
|
|
|
|
|
|
|
|
|
|
27.1 |
Hand scratch cutting/bending/joining pipes |
2 |
1.844 |
0.562 |
3 |
2.333 |
0.603 |
3 |
2.200 |
0.726 |
18 |
[24, 25] |
|
27.2 |
Fall from height during elevated pipe installation |
2 |
1.822 |
0.614 |
3 |
2.044 |
0.706 |
3 |
2.244 |
0.773 |
18 |
[25, 31, 32] |
|
28 |
ACP Installation |
|
|
|
|
|
|
|
|
|
|
|
|
28.1 |
Hand cut when trimming ACP sheet edges |
2 |
1.800 |
0.405 |
3 |
2.222 |
0.765 |
3 |
2.333 |
0.769 |
18 |
[24, 25] |
|
28.2 |
Electric shock from ungrounded ACP cutting tool |
2 |
1.778 |
0.735 |
3 |
2.178 |
0.716 |
3 |
2.333 |
0.603 |
18 |
[25, 28] |
|
29 |
Glass Installation |
|
|
|
|
|
|
|
|
|
|
|
|
29.1 |
Scaffold collapse during glass installation (wind/overload) |
3 |
2.378 |
0.650 |
2 |
1.889 |
0.682 |
3 |
2.578 |
0.965 |
18 |
[25, 31, 32] |
|
29.2 |
Hand cut/laceration during glass lifting/cutting |
2 |
1.800 |
0.694 |
3 |
2.689 |
0.848 |
3 |
2.578 |
0.892 |
18 |
[24, 25] |
The potential effect of rounding is particularly important because FMEA combines Severity, Occurrence, and Detection scores multiplicatively. A one-point increase in a single parameter may produce a disproportionate change in the final risk score, especially when the other parameters are already high. The resulting ranking may therefore reflect not only the respondents’ assessments but also the mathematical consequences of the selected rounding rule. For this reason, the rounded values should be interpreted as conservative categorical representations for risk prioritization rather than exact measurements of the underlying risk magnitude.
To assess the robustness of the risk ranking, a sensitivity analysis was conducted by recalculating the WRPN values using the original unrounded mean scores for Severity, Occurrence, and Detection. These results were then compared with the WRPN values and ranking positions generated from the upward-rounded scores. The comparison showed that several risks changed their relative ranking positions, particularly those with similar WRPN values. This finding confirms that upward rounding can influence the ordering of risks when the differences between their original mean scores are small.
Despite these changes, the risks identified as the highest priorities remained unchanged under both calculation procedures. This result indicates that the identification of the most critical OSH risks was reasonably robust to the rounding assumption. Nevertheless, the stability of the highest-ranked risks should not be interpreted as evidence that rounding has no methodological consequence. The observed changes among risks with closely spaced scores demonstrate that the procedure can affect secondary prioritization and may influence decisions concerning the allocation of limited safety resources.
Accordingly, the risk-ranking results were interpreted using four complementary elements: the original arithmetic mean, the item-specific standard deviation, the upward-rounded score, and the sensitivity-analysis result. This approach provides a more transparent basis for distinguishing risks that remain consistently critical from those whose rankings depend strongly on the scoring procedure. It also prevents conservative rounding from being presented as an empirically exact representation of risk and strengthens the methodological credibility of the FMEA-AHP integration.
3.3 Failure Mode and Effects Analysis-Analytic Hierarchy Process analysis results
As the second step in this study, the identified risks were prioritized using the AHP method based on pairwise comparison assessments by five expert respondents (project manager, site engineer, OSH specialist, safety officer, technical manager). The AHP consistency test produced a Consistency Ratio (CR) = 0.013, which is below the required threshold (CR < 0.10), so the comparison matrix was declared consistent [11]. The weight scores for each criterion are shown in Table 6.
Table 6. Priority weight values
|
Criterion |
AHP Weight |
Interpretation |
|
Detection |
0.623 |
The ability to detect potential risks before they occur is the most dominant factor in determining risk priority |
|
Severity |
0.213 |
The severity of impact has influence but not as significant as the detection factor |
|
Occurrence |
0.164 |
The frequency of risk occurrence has the smallest influence compared to other criteria |
Note: AHP = Analytic Hierarchy Process
The AHP results indicate that Detection received the highest weight (0.623), followed by Severity (0.213) and Occurrence (0.164). Based on these weights, risks were prioritized according to their relative importance, with the Detection criterion considered by the experts to be the most important factor in OSH risk control for the studied construction project. This finding indicates that the experts emphasized the importance of early hazard detection to enable preventive actions before potential failures develop into occupational accidents. It should be noted, however, that in the FMEA rating scale, a higher Detection score indicates that a potential failure is more difficult to detect before its consequences occur. Therefore, failure modes with higher Detection ratings require greater attention because they represent lower detectability and consequently a greater need for preventive control measures. This emphasis on Detection reflects the characteristics of the project, where most activities were performed in open areas under high ambient temperatures and involved physically demanding work. Under these conditions, the ability to identify potential hazards and unsafe conditions at an early stage is essential to enable timely implementation of control measures before risks develop into occupational accidents. Therefore, the experts considered that strengthening hazard detection through more effective site supervision, routine safety inspections, continuous monitoring of workers’ compliance with personal protective equipment (PPE) requirements, and early identification of unsafe conditions would provide greater opportunities for accident prevention than relying solely on the severity of potential consequences or the likelihood of occurrence. This interpretation is consistent with the principles of proactive safety management, which emphasize the use of safety leading indicators to identify conditions that may contribute to incidents and support preventive actions before accidents occur [33]. Furthermore, this finding is consistent with the study [34], who identified weak OSH detection and monitoring systems as one of the major shortcomings of construction safety culture in Indonesia, particularly among subcontractors and specialized work units.
Although the FMEA and AHP assessments were conducted within the same construction project, the resulting risk priorities differed because the two methods served different analytical purposes. The FMEA assessment evaluated failure modes based on respondents' ratings of Severity, Occurrence, and Detection, whereas AHP was used to determine the relative importance of these criteria through pairwise comparisons performed by selected experts. Therefore, the integration of FMEA and AHP was achieved by incorporating expert-derived criterion weights into the FMEA analysis, thereby improving the reliability and robustness of the resulting risk prioritization for decision-making [10]. The WRPN calculation results are presented in Table 7. In addition to determining risk priorities based on WRPN values, risk mapping was also performed to illustrate the risk level based on the combination of Severity and Occurrence values. Each risk was plotted onto the risk matrix according to its severity level and frequency of occurrence, resulting in risk classifications of very low, low, medium, high, and very high. The risk classification used in this study followed the criteria established in the Regulation of the Minister of Public Works and Housing (PUPR) Number 10 of 2021, where risk levels are represented by different colors in the matrix: dark green for very low risk, light green for low risk, yellow for medium risk, orange for high risk, and red for very high risk.
For example, the risk of extreme fatigue in a confined excavation area (heat) obtained a Severity value of 3 and an Occurrence value of 4. Based on these values, the risk was plotted on the risk matrix at the intersection of severity level 3 and occurrence level 4. This position corresponds to the orange zone with a risk score of 16, indicating a high-risk category according to the criteria established in the Regulation of the Minister of Public Works and Housing (PUPR) Number 10 of 2021. The risk mapping results provide a visual representation of the distribution of identified risk levels and support the evaluation process in determining appropriate risk control strategies. The risk mapping results are presented in Table 8.
The two risks with the highest WRPN (3.787) in this study are extreme fatigue due to heat exposure in narrow foundation excavation areas and extreme fatigue during concrete pouring in open areas, both classified as High Risk under the risk matrix of Ministerial Regulation PUPR No. 10 of 2021, with a matrix value of 16 (Severity = 3, Occurrence = 4). This dominance of heat-induced fatigue as the top priority diverges from the majority of construction studies in Indonesia, which typically report falls from height, struck-by-material incidents, and heavy equipment accidents as dominant risks [6, 16, 17]. This distinction is attributable to Kupang City's dry tropical climate, characterized by average daily temperatures of 28–33 ℃ and high solar radiation intensity, particularly during the dry season [19], conditions that directly amplify the heat load on workers operating in open areas and confined excavation zones.
These findings are consistent with a body of literature examining the effects of heat exposure on construction worker safety. The study [35] reported that elevated ambient temperatures significantly increase the risk of injury among construction workers (RR = 1.216; 95% CI: 1.095–1.350), particularly in tasks involving intense physical activity and direct heat exposure, conditions directly analogous to the excavation and concrete pouring work examined in this study. At a broader geographic scale, heat-related injury risk tends to be substantially higher in tropical and subtropical regions than in temperate climates [36]. Ambient temperature and exposure duration have also been identified as primary determinants of heat stress, potentially causing dehydration, physical fatigue, diminished concentration, and an elevated risk of accidents [37]. Within the Indonesian construction context, the combination of extended working hours, high physical workload, and hot working environments has consistently been associated with increased worker fatigue levels [38-40]. Collectively, these findings suggest that thermal environmental factors warrant more explicit consideration in construction OSH risk assessments, particularly for projects situated in Kupang City, Indonesia.
Table 7. Risk priority and risk mapping results
|
No |
Risk Description |
RPN |
WRPN |
Risk Map |
Level |
|
1 |
Extreme fatigue in confined excavation area (heat) |
48 |
3.787 |
16 |
High Risk |
|
2 |
Extreme fatigue during concrete casting (extreme heat) |
48 |
3.787 |
16 |
High Risk |
|
3 |
Dust and extreme heat exposure during site clearing |
32 |
3.573 |
12 |
Medium Risk |
|
4 |
Heat exposure during open-area surveying/bouwplank |
32 |
3.573 |
12 |
Medium Risk |
|
5 |
Hit by heavy equipment during grading/material transfer |
24 |
3.459 |
10 |
Low Risk |
|
6 |
Traffic accident during equipment mobilization |
24 |
3.459 |
10 |
Low Risk |
|
7 |
Struck by demolition debris during site clearing |
24 |
3.409 |
8 |
Low Risk |
|
8 |
Dry soil dust inhalation during backfill compaction |
24 |
3.409 |
8 |
Low Risk |
|
9 |
Run over by vehicle/equipment during material loading |
27 |
3 |
14 |
Medium Risk |
|
10 |
Struck by concrete fragments during chipping |
27 |
3 |
14 |
Medium Risk |
|
11 |
Struck by falling bricks during placement |
27 |
3 |
14 |
Medium Risk |
|
12 |
Scaffold collapse injury during brick wall work |
27 |
3 |
14 |
Medium Risk |
|
13 |
Cutting tool injury during granite sizing |
27 |
3 |
14 |
Medium Risk |
|
14 |
Chemical exposure on skin during granite finishing |
27 |
3 |
14 |
Medium Risk |
|
15 |
Fall from height during wall painting |
27 |
3 |
14 |
Medium Risk |
|
16 |
Struck by falling facade panel during installation |
27 |
3 |
14 |
Medium Risk |
|
17 |
Welding spatter burns during pipe joining |
27 |
3 |
14 |
Medium Risk |
|
18 |
Dust inhalation during cubicle partition installation |
24 |
2.950 |
12 |
Medium Risk |
|
19 |
Eye injury from cable dust during conduit drilling |
24 |
2.950 |
12 |
Medium Risk |
|
20 |
Struck by board/frame during project board installation |
18 |
2.836 |
10 |
Low Risk |
|
21 |
Struck by material during bouwplank lifting/alignment |
18 |
2.836 |
10 |
Low Risk |
|
22 |
Struck by heavy rebar/material during installation |
18 |
2.836 |
10 |
Low Risk |
|
23 |
Fall from height during rebar work due to wind |
18 |
2.836 |
10 |
Low Risk |
|
24 |
Scaffold collapse during glass installation (wind/overload) |
18 |
2.836 |
10 |
Low Risk |
|
25 |
CO gas inhalation from fuel-powered equipment |
18 |
2.787 |
8 |
Low Risk |
|
26 |
Tool injury during site office assembly |
18 |
2.787 |
8 |
Low Risk |
|
27 |
Electric shock from non-standard temporary wiring |
18 |
2.787 |
8 |
Low Risk |
|
28 |
Tool/equipment injury during foundation excavation |
18 |
2.787 |
8 |
Low Risk |
|
29 |
Sprain/trip while arranging or moving rebar |
18 |
2.787 |
8 |
Low Risk |
|
30 |
Hand pinched/lacerated while removing boards |
18 |
2.787 |
8 |
Low Risk |
|
31 |
Struck by falling formwork material during removal |
18 |
2.787 |
8 |
Low Risk |
|
32 |
Eye injury from concrete fragments during breaking |
18 |
2.787 |
8 |
Low Risk |
|
33 |
Fall from height during wall plastering |
18 |
2.787 |
8 |
Low Risk |
|
34 |
Skin/eye irritation from cement mortar splatter |
18 |
2.787 |
8 |
Low Risk |
|
35 |
Trip on cable or electric shock during installation |
18 |
2.787 |
8 |
Low Risk |
|
36 |
Dust/wood particle inhalation during cutting |
18 |
2.787 |
8 |
Low Risk |
|
37 |
Fall from ladder during ceiling panel installation |
18 |
2.787 |
8 |
Low Risk |
|
38 |
Inhaling dust/fibers from acoustic panels |
18 |
2.787 |
8 |
Low Risk |
|
39 |
Paint/solvent fume inhalation (dizziness, breathing issues) |
18 |
2.787 |
8 |
Low Risk |
|
40 |
Fall from ladder during partition installation |
18 |
2.787 |
8 |
Low Risk |
|
41 |
Fall from height during facade panel installation |
18 |
2.787 |
8 |
Low Risk |
|
42 |
Hand scratch/pinch during pipe cutting/joining |
18 |
2.787 |
8 |
Low Risk |
|
43 |
Fall from height during cable/electrical installation |
18 |
2.787 |
8 |
Low Risk |
|
44 |
Fall from height during connection work |
18 |
2.787 |
8 |
Low Risk |
|
45 |
Hand burn/laceration from direct welding spatter |
18 |
2.787 |
8 |
Low Risk |
|
46 |
Electric shock from contact with welding equipment |
18 |
2.787 |
8 |
Low Risk |
|
47 |
Electric shock during live cable/armature installation |
18 |
2.787 |
8 |
Low Risk |
|
48 |
Musculoskeletal injury lifting sanitary fixtures |
18 |
2.787 |
8 |
Low Risk |
|
49 |
Hand scratch cutting/bending/joining pipes |
18 |
2.787 |
8 |
Low Risk |
|
50 |
Fall from height during elevated pipe installation |
18 |
2.787 |
8 |
Low Risk |
|
51 |
Hand cut when trimming ACP sheet edges |
18 |
2.787 |
8 |
Low Risk |
|
52 |
Electric shock from ungrounded ACP cutting tool |
18 |
2.787 |
8 |
Low Risk |
|
53 |
Hand cut/laceration during glass lifting/cutting |
18 |
2.787 |
8 |
Low Risk |
|
54 |
Tool injury during project board fabrication |
12 |
2.623 |
7 |
Low Risk |
|
55 |
Struck by material/soil collapse at excavation walls |
12 |
2.623 |
7 |
Low Risk |
|
56 |
Tool injury (plate compactor) during backfilling |
12 |
2.623 |
7 |
Low Risk |
|
57 |
Fall from height due to unstable scaffolding |
12 |
2.623 |
7 |
Low Risk |
|
58 |
Struck/pinched by beam or board during installation |
18 |
2.377 |
14 |
Medium Risk |
|
59 |
Slip/trip on scattered materials during connecting |
12 |
2.164 |
8 |
Low Risk |
|
60 |
Trip on scattered tools/materials during installation |
12 |
2.164 |
8 |
Low Risk |
|
61 |
Struck by concrete/equipment during casting |
8 |
2 |
7 |
Low Risk |
Table 8. Risk level matrix
|
Risk Level Matrix 5 × 5 |
Severity Level |
|||||
|
Very Low Impact |
Low Impact |
Moderate Impact |
High Impact |
Very High Impact |
||
|
Occurrence Level |
Almost Certain |
11 |
15 |
18 |
23 |
25 |
|
Frequent |
6 |
12 4 Risks |
16 2 Risks |
19 |
24 |
|
|
Occasional |
4 |
8 33 Risks |
14 10 Risks |
17 |
22 |
|
|
Rare |
2 |
7 5 Risks |
10 7 Risks |
13 |
21 |
|
|
Very Rare |
1 |
3 |
5 |
9 |
20 |
|
Note: Risk scores range from 1 to 25 and are classified into five categories: 1–5 = very low risk; 6–10 = low risk; 11–15 = moderate risk; 16–20 = high risk; and 21–25 = very high risk. A higher score indicates a higher priority for risk mitigation.
From a methodological standpoint, this study reinforces prior evidence on the effectiveness of integrating multi-criteria methods in risk assessment. The integration of FMEA-AHP has been shown to yield more objective risk prioritization than conventional RPN [10, 12], while the combination of FMEA-FTA-AHP enhances identification accuracy by tracing causal relationships among accident contributors [14]. This study extends those contributions by applying an integrated FMEA-AHP and FTA framework to explicitly model heat stress-induced fatigue as a failure mode, as an aspect that has largely been overlooked in risk assessments for building construction projects in Kupang City, Indonesia. This approach enables more contextually sensitive risk prioritization and root cause tracing down to the level of basic events, ultimately producing control recommendations that are both operationally grounded and adaptive to actual field conditions.
3.4 Fault Tree Analysis results
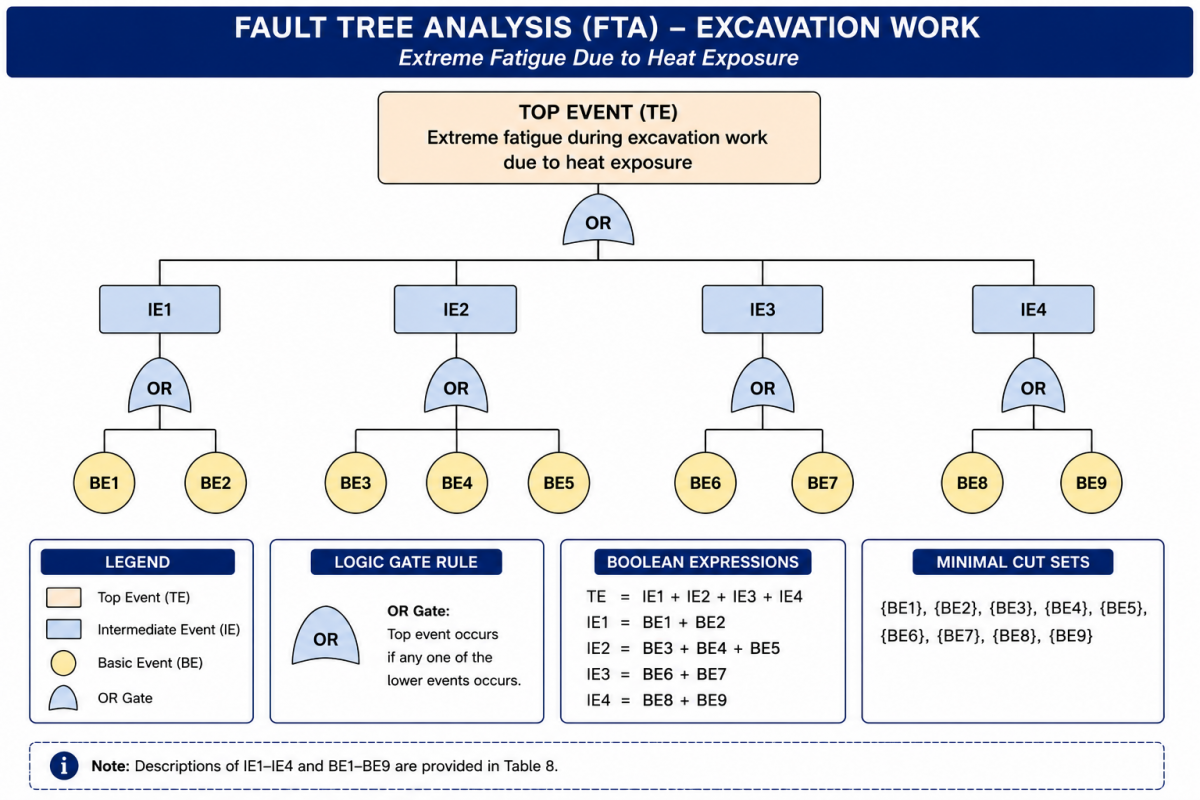
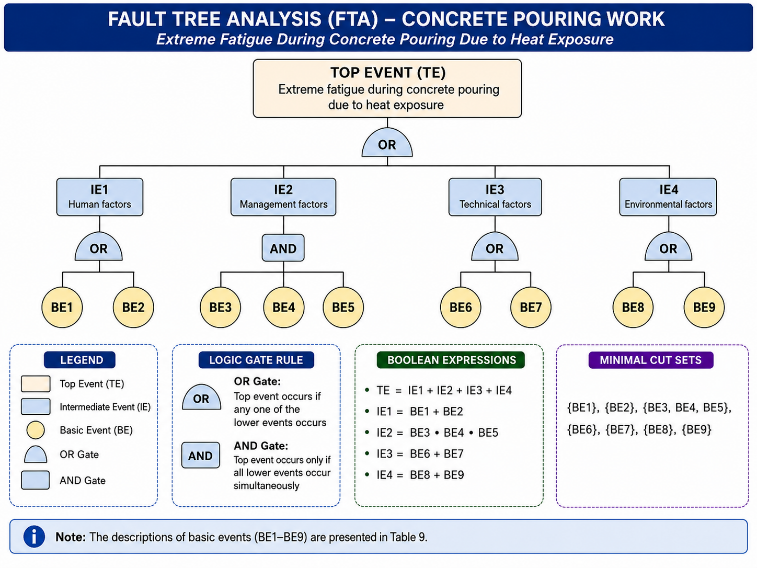
After identifying the dominant risks based on the FMEA-AHP method, the next step is to create a Fault Tree diagram that explains the causes of problems in the form of a tree diagram using standard logic symbols [22]. The resulting fault trees are presented as diagrams in Figures 4 and 5, and the FTA results for each dominant risk are further summarized in Tables 9 and 10 by explicitly presenting the corresponding top event, intermediate events, basic events, logic gates, Boolean expressions, and minimal cut sets.
Based on the FTA results presented in Tables 9 and 10, each top event was associated with nine basic events categorized into four intermediate events. Within the human factors category, dehydration and reduced workers’ physical condition were consistently identified as fundamental root causes contributing to both top events. Personal factors, such as physical condition and hydration, combined with environmental heat exposure, have been shown to synergistically increase construction worker fatigue [41]. Within the management factors category, excessive work duration, workload imbalance, and inadequate supervision were consistently identified as contributing basic events. Dynamic work-rest scheduling has been highlighted as an effective intervention for heat stress management, consistent with the managerial control strategies proposed in this study [37]. Periodic fatigue evaluation using both subjective and physiological approaches is also important for supporting responsive OSH management systems [42]. Within the technical factors category, repetitive manual activities, prolonged heavy equipment operation, and vibration exposure contributed to fatigue accumulation. Human factors were more dominant in this study’s FTA than in previous research, which may be attributed to dry-season conditions involving direct exposure to high temperatures and the tendency of some workers to consume energy drinks instead of water, thereby accelerating dehydration and fatigue. This finding is further supported by evidence that higher heat pressure index (WBGT) values are associated with higher fatigue levels among construction workers [40].
Table 9. Fault Tree Analysis results for extreme fatigue during excavation work
|
Item |
Description |
|
Top Event |
Extreme fatigue during excavation work |
|
Intermediate Events |
IE1 = Human factors; IE2 = Management factors; IE3 = Technical factors; IE4 = Environmental factors |
|
Basic Events |
Human factors (IE1): Decreased worker stamina (BE1), Dehydration during work (BE2) |
|
|
Management factors (IE2): Imbalance between workload and workers (BE3), Number of workers not adequate (BE4), Lack of supervision regarding work conditions (BE5) |
|
|
Technical factors (IE3): Use of heavy equipment for a long period (BE6), Heat emitted from heavy equipment (BE7) |
|
|
Environmental factors (IE4): Heat trapped in narrow excavation area (BE8), Difficult air circulation (BE9) |
|
Logic Gates |
All intermediate events are connected using OR gates |
|
Boolean Expression |
TE = IE1 + IE2 + IE3 + IE4 IE1 = BE1 + BE2 IE2 = BE3 + BE4 + BE5 IE3 = BE6 + BE7 IE4 = BE8 + BE9 |
|
Expanded Boolean Expression |
TE = BE1 + BE2 + BE3 + BE4 + BE5 + BE6 + BE7 + BE8 + BE9 |
|
Minimal Cut Sets |
{BE1}, {BE2}, {BE3}, {BE4}, {BE5}, {BE6}, {BE7}, {BE8}, {BE9} |
Table 10. Fault Tree Analysis results for extreme fatigue during concrete pouring due to heat exposure
|
Item |
Description |
|
Top Event |
Extreme fatigue during concrete pouring due to heat exposure |
|
Intermediate Events |
IE1 = Human factors; IE2 = Management factors; IE3 = Technical factors; IE4 = Environmental factors |
|
Basic Events |
Human factors (IE1): Decreased worker stamina (BE1), Reduced awareness of fatigue symptoms (BE2) |
|
Management factors (IE2): Work duration exceeds normal limit (BE3), High work pressure/deadline (BE4), Work system without adequate rest breaks (BE5) |
|
|
Technical factors (IE3): Heat exposure mitigation not properly implemented (BE6), Physically demanding activities within a short time (BE7) |
|
|
Environmental factors (IE4): High ambient temperature in the work area (BE8), Work area without adequate shading (BE9) |
|
|
Logic Gates |
The top event is connected to all intermediate events through OR gates. The human, technical, and environmental branches use OR gates, whereas the management branch is connected through an AND gate. |
|
Boolean Expression |
TE = IE1 + IE2 + IE3 + IE4 IE1 = BE1 + BE2 IE2 = BE3 · BE4 · BE5 IE3 = BE6 + BE7 IE4 = BE8 + BE9 |
|
Expanded Boolean Expression |
TE = BE1 + BE2 + (BE3 · BE4 · BE5) + BE6 + BE7 + BE8 + BE9 |
|
Minimal Cut Sets |
{BE1}, {BE2}, {BE3, BE4, BE5}, {BE6}, {BE7}, {BE8}, {BE9} |
3.5 Risk mitigation strategy
Mitigation strategies were developed based on FMEA-AHP and FTA findings, considering the highest Detection weighting value from AHP. Therefore, in addition to preventive measures, strategies also include early fatigue detection systems. The risk mitigation strategy is shown in Table 11.
Table 11. Risk mitigation strategy
|
No. |
Control Measure |
Fatigue Checking Method |
Method Type |
Reference |
|
1 |
Increase worker awareness through safety briefings (safety talk) and regular fluid intake to reduce dehydration and work fatigue risk. |
Self-assessment and observation of fatigue symptoms such as dizziness, weakness, and decreased concentration. |
Manual (Subjective) |
[42, 43] |
|
2 |
Regulate working hours, limit work duration, and provide adequate rest breaks to control fatigue from excessive working hours. |
Monitoring of work duration and direct supervision by field supervisors. |
Manual (Observational) |
[43, 44] |
|
3 |
Regulate work methods through job rotation and division of work stages to reduce repetitive workload. |
Observation of work errors, decreased concentration, and changes in worker behavior. |
Manual (Observational) |
[44, 45] |
|
4 |
Adjust working hours based on ambient temperature conditions to minimize heat stress exposure. |
Measurement of working environment temperature using temperature gauges. |
Instrumental |
[46] |
|
5 |
Use ambient temperature monitoring tools and conduct physiological checks on workers before working or after rest breaks to help control working conditions in high heat exposure areas. |
Heat index monitoring, thermal scanners, or periodic body temperature monitoring of workers. |
Semi-Automated |
[41, 47] |
|
6 |
Develop worker monitoring systems to help detect potential work fatigue in the field. |
CCTV-based fatigue detection system to help periodically monitor worker activities. |
Automated |
[41, 47] |
Based on the integrated FMEA-AHP and FTA results, extreme fatigue emerged as the most critical OSH risk in soil excavation and concrete casting activities. In soil excavation, fatigue was primarily associated with a high physical workload, limited monitoring of workers’ physical condition, and prolonged heat exposure within excavation areas where air circulation and worker mobility were restricted [41]. These conditions increased physiological strain and reduced workers’ ability to maintain concentration and safe work performance.
A similar risk pattern was identified during concrete casting. Workers were required to perform continuous manual activities, including concrete distribution, compaction, and surface levelling, often under high ambient temperatures in open work areas [41, 44]. The combination of repetitive physical exertion, prolonged work duration, and heat exposure increased the likelihood of dehydration, declining stamina, slower responses, and reduced situational awareness. Extreme fatigue should therefore not be treated merely as an individual worker condition. It represents the cumulative effect of workload design, staffing adequacy, supervisory practices, work scheduling, equipment use, and environmental exposure.
The proposed mitigation measures focused on reducing the sources of physical and thermal strain rather than relying solely on workers’ ability to recognize and manage fatigue. The main measures included balancing workloads, limiting continuous work duration, establishing structured work-rest cycles, implementing job rotation, providing adequate staffing, and strengthening supervisory monitoring during high-risk activities. These measures are particularly important during excavation and casting because both activities require sustained physical effort and often allow limited flexibility once the work process has begun.
Early fatigue detection should combine behavioural, physiological, and environmental indicators. Field supervisors can identify early warning signs through direct observation, including reduced coordination, slower movement, loss of concentration, excessive sweating, and changes in worker responsiveness. Periodic physiological checks can support this process by monitoring indicators such as heart rate, body temperature, hydration status, and blood pressure. Environmental monitoring using thermal scanners or other heat-monitoring devices can also help determine when workplace temperatures exceed safe operational thresholds [41, 47].
In the longer term, digital monitoring systems may strengthen preventive control. A CCTV-based fatigue detection system could support continuous observation by identifying unusual posture, reduced movement, loss of balance, or other behavioural signs associated with fatigue. However, such a system should complement rather than replace direct supervision, adequate staffing, rest arrangements, and environmental controls. Its implementation would also require clear operating procedures, reliable detection criteria, trained personnel, and appropriate safeguards for worker privacy.
These findings underline the importance of data-supported monitoring in construction safety management. The integration of FMEA, AHP, and FTA provided a structured sequence for identifying hazards, weighting risk criteria, ranking priority risks, and tracing their underlying causes. This approach generated a more analytically complete assessment than methods that focus only on hazard identification or numerical risk ranking. More importantly, it provided a stronger basis for designing OSH interventions that respond to the actual technical, managerial, human, and environmental conditions of the project.
This study identified 61 potential OSH risks across 29 construction activities in the PT Bank NTT Pension Fund Office Building Project. The number and distribution of the identified risks demonstrate that construction safety cannot be managed through isolated controls. It requires a systematic assessment that connects work activities, failure modes, risk priorities, causal mechanisms, and preventive measures.
The FMEA-AHP results showed that Detection had the highest criterion weight at 0.623, followed by Severity at 0.213 and Occurrence at 0.164. This result indicates that the ability to recognize early warning signs and detect unsafe conditions was considered the most influential factor in controlling risk within the studied project. The finding does not imply that Severity and Occurrence are unimportant. Rather, it indicates that weak detection capacity can allow hazardous conditions to persist until they develop into incidents with serious consequences.
The conventional FMEA assessment identified two dominant risks with an RPN value of 48: extreme fatigue caused by heat exposure during soil excavation and extreme fatigue during concrete casting activities. After incorporating the AHP-derived criterion weights, both risks remained the highest priorities, with a WRPN value of 3.787 and a high-risk classification. The consistency of these results indicates that heat-related extreme fatigue remained a critical concern under both conventional and weighted risk-prioritisation procedures.
The FTA results showed that the causal structure of extreme fatigue cannot be interpreted as a collection of uniformly independent basic events. Each fault tree comprised nine basic events classified into four categories: human, managerial, technical, and environmental factors. However, the logical relationships among these events differed between the two dominant risks. For extreme fatigue during excavation, the minimal cut sets consisted of individual basic events connected through OR-gate relationships, indicating that each corresponding event could independently activate a causal pathway toward the top event. In contrast, the concrete-pouring fault tree contained both independent and combinatorial causal pathways. In particular, the management-related events BE3, BE4, and BE5 formed the combinatorial minimal cut set {BE3, BE4, BE5}, indicating that excessive work duration, high work pressure, and the absence of adequate rest breaks must occur jointly to activate this management-related pathway.
This distinction has direct implications for risk control. Basic events represented by singleton minimal cut sets require targeted interventions because each can independently contribute to the top event. By contrast, the management-related combination {BE3, BE4, BE5} requires an integrated intervention that simultaneously addresses working duration, work pressure, and rest arrangements. Treating these three management factors as independent causes would misrepresent the AND-gate logic identified in the FTA.
Across the two fault trees, human-related factors included declining stamina, dehydration, and reduced awareness of fatigue symptoms. Managerial factors included workload imbalance, inadequate supervision, excessive working duration, high work pressure, inadequate staffing, and insufficient rest arrangements. Technical factors included prolonged heavy-equipment operation, heat generated by equipment, insufficient heat-exposure mitigation, and physically demanding activities. Environmental factors included high ambient temperatures, restricted air circulation in excavation areas, and inadequate shading in open workspaces. These findings show that occupational fatigue results from interacting conditions within the work system rather than from worker behaviour alone.
Effective fatigue prevention therefore requires interventions directed at the underlying human, managerial, technical, and environmental conditions. Measures focusing solely on personal protective equipment or worker discipline are unlikely to provide sufficient protection when excessive workloads, inadequate staffing, prolonged heat exposure, and ineffective work-rest arrangements remain unresolved. The proposed mitigation strategies include strengthening worker awareness through focused safety talks, regulating working hours, establishing structured rest periods, applying job rotation, improving workload allocation, strengthening supervision, and controlling occupational heat exposure. Direct observation by field supervisors, periodic physiological examinations, and environmental temperature monitoring were also proposed as practical early-detection measures. These interventions provide an operational basis for reducing fatigue risk during excavation and concrete casting activities.
A CCTV-based fatigue detection system may be considered as a future development to support real-time monitoring. However, its effectiveness should be evaluated before large-scale implementation. Such a system requires validation of detection accuracy, operational reliability, false-alarm rates, worker acceptance, data governance, and integration with existing supervisory procedures. Digital monitoring should complement, rather than replace, adequate staffing, reasonable working hours, safe work design, structured recovery periods, and active field supervision.
Methodologically, this study demonstrates the analytical value of integrating FMEA, AHP, and FTA. FMEA enabled systematic hazard and failure-mode identification. AHP introduced differentiated expert-derived weights for Severity, Occurrence, and Detection rather than assuming equal criterion importance. WRPN provided a weighted basis for risk prioritisation, while FTA revealed the causal structure underlying the highest-ranked risks. The combined framework therefore distinguishes between risk magnitude and causal logic, which is important because a high-priority risk may arise from either independent basic events or combinations of events that must occur simultaneously.
Contextually, the study provides empirical evidence from a building construction project in Kupang City, Indonesia, a regional setting that remains underrepresented in construction OSH research. The results indicate that local project conditions, particularly heat exposure, workforce organisation, supervision, and manual work intensity, substantially shape the observed construction risk profile. This finding reinforces the need for OSH assessment models that account for actual regional and project-level conditions rather than relying exclusively on general construction risk classifications.
Future research should evaluate the effectiveness of the proposed mitigation measures after implementation. Such evaluation should examine changes in fatigue indicators, worker behaviour, incident frequency, productivity, and compliance with work-rest arrangements. Further studies should also include construction projects with different scales, contractual arrangements, workforce profiles, and environmental conditions across East Nusa Tenggara and other comparable regions. Comparative research would help determine whether the identified risk structure is project-specific or reflects a broader pattern in construction activities conducted under hot-climate and resource-constrained conditions.
[1] Bureau of Labor Statistics. (2026). Census of fatal occupational injuries summary, 2024. U.S. Department of Labor. https://www.bls.gov/news.release/cfoi.nr0.htm.
[2] International Labour Organization. (2023). Nearly 3 million people die of work-related accidents and diseases. https://www.ilo.org/resource/news/nearly-3-million-people-die-work-related-accidents-and-diseases.
[3] Kementerian Ketenagakerjaan Republik Indonesia. (2024). National occupational accident statistics 2023. https://satudata.kemnaker.go.id/data/kumpulan-data/1728.
[4] BPJS Ketenagakerjaan. (2023). Laporan tahunan terintegrasi 2022: Adaptif dan inovatif [In Indonesian]. https://www.bpjsketenagakerjaan.go.id/laporan-terintegrasi.html.
[5] Lestari, F., Sunindijo, R.Y., Loosemore, M., Kusminanti, Y., Widanarko, B. (2020). A safety climate framework for improving health and safety in the Indonesian construction industry. International Journal of Environmental Research and Public Health, 17(20): 7462. https://doi.org/10.3390/ijerph17207462
[6] Maddeppungeng, A., Asyiah, S., Intari, D.E., Putro, M.A., Setiawati, D.N. (2023). Occupational health and safety (K3) risk management analysis on building construction projects in Indonesia: Literature review. Fondasi: Jurnal Teknik Sipil, 12(2): 260-270. https://doi.org/10.36055/fondasi.v12i2.21986
[7] Saputra, P.D., Fansuri, M.H., Laksmi, A.A., Ragil, M., Simbolon, M.N.B. (2025). Construction safety risk assessment for underground structures in military hospital projects using activity-based failure mode and effects analysis (FMEA). Engineering Proceedings, 84(1): 33. https://doi.org/10.3390/engproc2025084033
[8] Albasyouni, W., Abotaleb, I., Nassar, K. (2023). Proposing the use of failure mode and effect analysis (FMEA) as risk assessment tool in construction. International Journal of Innovative Technology and Exploring Engineering, 12(12): 6-14. https://doi.org/10.35940/ijitee.l9750.11121223
[9] Zheng, H.X., Tang, Y.C. (2020). Deng entropy weighted risk priority number model for failure mode and effects analysis. Entropy, 22(3): 280. https://doi.org/10.3390/e22030280
[10] Çeliker, S., Saraç Eşsiz, E., Oturakcı, M. (2021). Integrated AHP-FMEA risk assessment method to stainless tank production process. Turkish Journal of Engineering, 5(3): 118-122. https://doi.org/10.31127/tuje.702369
[11] Aladayleh, K.J., Aladaileh, M.J. (2024). Applying analytical hierarchy process (AHP) to BIM-based risk management for optimal performance in construction projects. Buildings, 14(11): 3632. https://doi.org/10.3390/buildings14113632
[12] Heydari, A., Fallah-Aliabadi, S. (2021). Application of FMEA and AHP in elevated highway construction project risk assessment. Archives of Occupational Health, 5(2): 988-992. https://doi.org/10.18502/aoh.v5i2.6194
[13] Opu, A.B., Devia, Y.P., Suryo, E.A. (2024). A high risk identification of occupational safety and health management systems (OSHMS) at building construction projects using the fault tree analysis (FTA) method. AIP Conference Proceedings, 3043: 040013. https://doi.org/10.1063/5.0206592
[14] Zokaei, M., Abbasi, M., Falahati, M., Abbasi, J., Zand Salimi, F., Zarie, M. (2025). Safety risk assessment by creating a combined model of FMEA, FTA and AHP fuzzy methods: Case study: Steel industry exploitation phase. Iran Occupational Health, 21(2): 52-72. https://doi.org/10.66224/ioh.21.2.52
[15] Mutlu, N.G., Altuntas, S. (2019). Risk analysis for occupational safety and health in the textile industry: Integration of FMEA, FTA, and BIFPET methods. International Journal of Industrial Ergonomics, 72: 222-240. https://doi.org/10.1016/j.ergon.2019.05.013
[16] Bria, T.A., Chen, W.T., Muhammad, M., Rantelembang, M.B. (2024). Analysis of fatal construction accidents in Indonesia—A case study. Buildings, 14(4): 1010. https://doi.org/10.3390/buildings14041010
[17] Wibowo, D.E., Wahyuni, I., Hastutiningsih, A.D., Nurshefa, I.M., Rimbawati, D.D. (2023). Occupational safety and health risk analysis using HIRARC and JSA methods in building projects construction. AIP Conference Proceedings, 2629: 040011. https://doi.org/10.1063/5.0128851
[18] Republik Indonesia. (2021). Peraturan menteri pekerjaan umum dan perumahan rakyat republik Indonesia No. 10 tahun 2021 tentang pedoman sistem manajemen keselamatan konstruksi. Jakarta, Indonesia: Kementerian Pekerjaan Umum dan Perumahan Rakyat. https://jdih.pu.go.id/detail-dokumen/PermenPUPR-nomor-10-tahun-2021-Pedoman-Sistem-Manajemen-Keselamatan-Konstruksi.
[19] Badan Meteorologi, Klimatologi, dan Geofisika. (2025). Data suhu udara Kota Kupang. https://www.bmkg.go.id/cuaca/prakiraan-cuaca/53.71.
[20] Jensen, R.C., Bird, R.L., Nichols, B.W. (2022). Risk assessment matrices for workplace hazards: Design for usability. International Journal of Environmental Research and Public Health, 19(5): 2763. https://doi.org/10.3390/ijerph19052763
[21] Aven, T. (2023). A risk and safety science perspective on the precautionary principle. Safety Science, 165: 106211. https://doi.org/10.1016/j.ssci.2023.106211
[22] Signoret, J.P., Leroy, A. (2021). Fault tree analysis (FTA). In Reliability Assessment of Safety and Production Systems. Springer Series in Reliability Engineering. Springer, Cham, pp. 209-225. https://doi.org/10.1007/978-3-030-64708-7_16
[23] Hussain, R., Zaidi, S.F.A., Pedro, A., Lee, H., Park, C. (2024). Exploring construction workers' attention and awareness in diverse virtual hazard scenarios to prevent struck-by accidents. Safety Science, 175: 106526. https://doi.org/10.1016/j.ssci.2024.106526
[24] Alvand, A., Mirhosseini, S.M., Ehsanifar, M., Zeighami, E., Mohammadi, A. (2023). Identification and assessment of risk in construction projects using the integrated FMEA-SWARA-WASPAS model under fuzzy environment: A case study of a construction project in Iran. International Journal of Construction Management, 23(3): 392-404. https://doi.org/10.1080/15623599.2021.1877875
[25] PT. Bank NTT. (2025). Rencana Keselamatan Konstruksi (RKK) Proyek Pembangunan Gedung Kantor Dana Pensiun PT. Bank NTT. Kupang, Indonesia: PT. Bank NTT.
[26] Sekhavati, E., Yengejeh, R.J. (2023). Particulate matter exposure in construction sites is associated with health effects in workers. Frontiers in Public Health, 11: 1130620. https://doi.org/10.3389/fpubh.2023.1130620
[27] Nazneen, S., Choi, S.D., Ibarra-Mejia, G. (2025). Extreme heat exposure in the construction industry: A scoping review on risk factors and heat-related health consequences. International Journal of Environmental Research and Public Health, 22(11): 1651. https://doi.org/10.3390/ijerph22111651
[28] Kpakpo, J.N.A., Martey, A.K., Antwi, N.K.A., Maduka, C.C., Mahoney, B. (2026). Electrocution in the construction industry: A systematic review. Discover Public Health, 23: 8. https://doi.org/10.1186/s12982-025-01336-5
[29] Casey, T.W., Mason, H.M., Huang, J., Franklin, R.C. (2021). Shaping frontline practices: A scoping review of human factors implicated in electrical safety incidents. Safety, 7(4): 76. https://doi.org/10.3390/safety7040076
[30] Lim, J., Cho, J., Kim, J., Kang, S. (2024). Workers' injury risks focusing on body parts in reinforced concrete construction projects. International Journal of Environmental Research and Public Health, 21(12): 1655. https://doi.org/10.3390/ijerph21121655
[31] Oliveira, S.S., Soares, W.A., Vasconcelos, B.M. (2023). Fatal fall-from-height accidents: Statistical treatment using the Human Factors Analysis and Classification System – HFACS. Journal of Safety Research, 86: 118-126. https://doi.org/10.1016/j.jsr.2023.05.004
[32] Darwis, A.M., Nai’em, M.F., Thamrin, Y., Noviponiharwani, Rahmadani, S., Amin, F. (2021). Safety risk assessment in construction projects at Hasanuddin University. Gaceta Sanitaria, 35: S385-S387. https://doi.org/10.1016/j.gaceta.2021.10.057
[33] Xu, J., Cheung, C., Manu, P., Ejohwomu, O. (2021). Safety leading indicators in construction: A systematic review. Safety Science, 139: 105250. https://doi.org/10.1016/j.ssci.2021.105250
[34] Siregar, W.R., Machfudiyanto, R.A., Prasetyo, B., Suraji, A. (2024). Enhancing safety culture among subcontractors to improve safety performance in the Indonesian construction industry. International Journal of Safety and Security Engineering, 14(6): 1913-1919. https://doi.org/10.18280/ijsse.140625
[35] Gariazzo, C., Taiano, L., Bonafede, M., et al. (2023). Association between extreme temperature exposure and occupational injuries among construction workers in Italy: An analysis of risk factors. Environment International, 171: 107677. https://doi.org/10.1016/j.envint.2022.107677
[36] Fatima, S.H., Rothmore, P., Giles, L.C., Varghese, B.M., Bi, P. (2021). Extreme heat and occupational injuries in different climate zones: A systematic review and meta-analysis of epidemiological evidence. Environment International, 148: 106384. https://doi.org/10.1016/j.envint.2021.106384
[37] Torbat Esfahani, M., Awolusi, I., Hatipkarasulu, Y. (2024). Heat stress prevention in construction: A systematic review and meta-analysis of risk factors and control strategies. International Journal of Environmental Research and Public Health, 21(12): 1681. https://doi.org/10.3390/ijerph21121681
[38] Sihotang, K.M.S., Amalia, R., Hardy, F.R., Maharani, F.T. (2021). Hubungan faktor pekerjaan dengan kelelahan kerja pada pekerjaan lapangan proyek pembangunan gedung PT.X di Jakarta Pusat tahun 2020. Jurnal Kesehatan Masyarakat, 9(5): 681-687. https://doi.org/10.14710/jkm.v9i5.30709
[39] Wicaksono, H.P., Lestantyo, D., Setyaningsih, Y. (2024). Kelelahan yang terjadi pada pekerja konstruksi: Fatigue occurring in construction workers. Media Publikasi Promosi Kesehatan Indonesia (MPPKI), 7(5): 1254-1258. https://doi.org/10.56338/mppki.v7i5.5143
[40] Hartanindya, R.L., Ramdhan, D.H. (20222). Analisis hubungan indeks tekanan panas dengan tingkat kelelahan kerja di proyek konstruksi Light Rail Transit (LRT) Jabodebek Depo Jatimulya. PREPOTIF: Jurnal Kesehatan Masyarakat, 6(1): 486-494. https://doi.org/10.31004/prepotif.v6i1.3629
[41] Zong, H.Y., Yi, W., Antwi-Afari, M.F., Yu, Y.T. (2024). Fatigue in construction workers: A systematic review of causes, evaluation methods, and interventions. Safety Science, 176: 106529. https://doi.org/10.1016/j.ssci.2024.106529
[42] Heng, P.P., Mohd Yusoff, H., Hod, R. (2024). Individual evaluation of fatigue at work to enhance the safety performance in the construction industry: A systematic review. PLoS ONE, 19(2): e0287892. https://doi.org/10.1371/journal.pone.0287892
[43] Seong, S., Park, S., Ahn, Y.H., Kim, H. (2022). Development of an integrated fatigue measurement system for construction workers: A feasibility study. BMC Public Health, 22: 1593. https://doi.org/10.1186/s12889-022-13973-5
[44] Priatisda, M.R. (2025). Analisis faktor yang berhubungan dengan kelelahan kerja di Indonesia pada pekerja konstruksi (Systematic Literature Review 2019–2024). Jurnal Kesehatan Tambusai, 6(1): 31-36. https://doi.org/10.31004/jkt.v6i1.41657
[45] Bangaru, S.S., Wang, C., Aghazadeh, F. (2022). Automated and continuous fatigue monitoring in construction workers using forearm EMG and IMU wearable sensors and recurrent neural network. Sensors, 22(24): 9729. https://doi.org/10.3390/s22249729
[46] Lee, G., Bae, J., Jacob, J.V., Lee, S. (2024). Wearable heart rate sensing and critical power-based whole-body fatigue monitoring in the field. Applied Ergonomics, 121: 104358. https://doi.org/10.1016/j.apergo.2024.104358
[47] Kim, B., Preethaa, K.R.S., Song, S., et al. (2024). Internet of Things and ensemble learning-based mental and physical fatigue monitoring for smart construction sites. Journal of Big Data, 11: 115. https://doi.org/10.1186/s40537-024-00978-7