Esi Putri Silmina* | Sunardi | Anton Yudhana
© 2026 The authors. This article is published by IIETA and is licensed under the CC BY 4.0 license (http://creativecommons.org/licenses/by/4.0/).
OPEN ACCESS
Real-time beef freshness assessment supports food safety inspection by helping prevent unsafe meat distribution and strengthening supply-chain monitoring. This study proposes Adaptive Stochastic YOLO (AS-YOLO), a lightweight post-detection refinement framework designed to stabilize YOLO detection outputs without modifying model architecture or retraining. The method adds a Stochastic Refinement Layer (SRL) after baseline YOLO inference. SRL generates detection hypotheses through confidence-score perturbation and Gaussian bounding-box perturbation, groups them using class-constrained Intersection over Union (IoU)-based clustering, and fuses them by confidence-weighted voting. YOLOv5, YOLOv8, and YOLOv11 were evaluated on a two-class beef freshness dataset containing fresh and non-fresh beef images, with preliminary external testing on independently collected primary images. On the internal testing dataset, the selected conservative SRL configuration preserved high performance, with AS-YOLOv11 reaching 100.00% mAP@0.5, 97.52% mAP@0.5:0.95, 100.00% precision, and 100.00% recall. Primary-data testing showed stable detection behavior, but the observed metric changes were not statistically significant. All AS-YOLO variants maintained real-time feasibility above 30 frames per second (FPS). The results indicate that AS-YOLO is a practical output-level refinement approach for beef freshness inspection, while broader validation under diverse market, camera, lighting, and storage conditions is still required.
beef freshness detection, confidence-weighted voting, food safety inspection, IoU-based clustering, post-detection refinement, real-time detection, stochastic refinement, YOLO
Animal protein sources are essential for health, as they help fulfil dietary requirements needed to prevent and treat stunting [1-4]. Beef is one of the most commonly consumed animal protein sources [5]. Beef freshness serves as a key quality indicator because spoilage can negatively impact both human health and the meat processing industry [6, 7]. Therefore, the accurate and real-time detection of beef freshness is very important for not only the quality maintenance of the products but also the food safety and security engineering in the meat supply chain.
Timely, reliable detection of beef freshness is crucial for beef quality assurance and for food safety and security within the meat supply chain. If quality degradation goes undetected before distribution or consumption, the meat may become unsafe. The World Health Organization (WHO) reports that foodborne diseases affect about 866 million people and cause 1.52 million deaths each year, with children under five bearing a substantial portion of the burden [8]. Food safety is a key component of food security: unsafe food threatens public health, erodes consumer confidence, and disrupts trade and supply-chain reliability [8].
Microbiological contamination is still a critical problem in beef and beef products. A recent systematic review and meta-analysis showed a pooled prevalence of 9.73% for Salmonella in over 106,000 beef samples, with a higher rate of contamination in processed beef products than in raw beef [9]. These results indicate the necessity of rapid, accurate and non-destructive inspection systems that can help in early detection and prevent potentially unsafe meat from reaching the food supply chain.
From a safety and security engineering perspective, automated beef freshness inspection serves as a risk-control mechanism in food production and distribution systems. The proposed system supports food safety inspection by identifying visual signs of freshness degradation before meat products reach consumers. It also contributes to hazard prevention by reducing the possibility of spoiled or unsafe meat entering distribution channels. When integrated into digital monitoring platforms, automated inspection can support supply-chain monitoring, traceability, quality assurance, regulatory compliance, and operational decision-making in food processing, storage, retail, and distribution environments [10]. Thus, beef freshness detection is not merely an image analysis task, but an engineering problem related to the design of safer, more reliable, and more secure food inspection workflows.
To date, beef freshness is mainly assessed by manual inspection (visual appearance, odor, and texture), which is subjective, inconsistent, and not scalable for large volumes [11-13]. Chemical or thermal sensors offer alternatives but are costly and complex. Therefore, automatic and scalable solutions are needed for beef freshness assessment, particularly for beef products.
Rapid developments in deep learning and computer vision in the last decade have opened new opportunities for image-based (non-destructive) automated food quality inspection. Deep Learning-based approaches have shown strong potential in extracting visual information for freshness detection [11, 14-16]. Image-based beef inspection is appealing because it can be implemented using conventional cameras without specialised sensors, while supporting real-time processing. Yet visual inspection of beef appearance faces challenges due to lighting variations, capture angles, temperature- and time-induced color changes, and surface reflections.
Among single-stage object detectors, You Only Look Once (YOLO) was introduced by Redmon [17] and stands out for its speed and accuracy. The architecture of YOLO has been continuously improved from YOLOv1 to YOLOv11 [17-24]. The main advantage of YOLO is its capability to detect objects in images and videos while keeping high inference speed [17, 25, 26]. This efficiency makes it the first choice for real-time visual inspection in the food-safety field to detect beef freshness. The suitability of YOLO for safety-critical real-time systems has been further confirmed in non-food domains, where it has been successfully deployed for nighttime surveillance [27].
YOLOv11, though presented as the latest model with strong performance in controlled environments, is essentially deterministic: a given image yields a single prediction. Under non-ideal real-world conditions, such as changing lighting, extreme camera viewpoints, or reflections, this deterministic prediction can become unstable or inaccurate. The lack of a mechanism to stabilize predictions across visual variations represents a critical limitation, especially for food-safety applications that are highly sensitive to errors.
This work proposes Adaptive Stochastic YOLO (AS-YOLO) to address these limitations through a stochastic refinement approach that operates after the YOLO detection stage. AS-YOLO does not alter the internal architecture or training process of YOLO; instead, it functions as an inference-time post-detection refinement mechanism. The core idea is to generate multiple prediction hypotheses from a single YOLO output through controlled stochastic perturbations and refine them using clustering and confidence-weighted fusion to obtain more stable detection outputs.
This study introduces a Stochastic Refinement Layer (SRL) to implement the proposed approach as a post-processing module consisting of four main steps. First, confidence-score perturbation is applied to generate controlled variations in detection confidence. Second, Gaussian bounding-box perturbation introduces small-scale spatial variations around the predicted bounding boxes. Third, class-constrained Intersection over Union (IoU)-based clustering groups overlapping prediction hypotheses with the same predicted class based on their IoU values, allowing detections that represent the same object to be identified. Finally, confidence-weighted voting combines multiple hypotheses within each cluster into a single refined detection, in which hypotheses with higher confidence scores contribute more strongly to the final output. The approach is stochastic because it applies controlled perturbations to the detection outputs during inference. However, it does not implement standard Monte Carlo Dropout, because it does not perform stochastic forward passes through the full YOLO network. The stochastic process is applied only at the detection-output level, keeping the computation lightweight and preserving real-time feasibility. Therefore, the resulting spatial variation should be interpreted as an output-level bounding-box variance indicator rather than full epistemic uncertainty estimation.
The main contributions are delineated as follows:
This study proposes the development of the SRL as a lightweight post-detection refinement framework that can be integrated with existing YOLO detectors without modifying the backbone, neck, or detection head. The proposed SRL operates entirely at the detection-output level and does not require additional training or fine-tuning, making it practical for real-time inspection scenarios where architectural modification and retraining are not always feasible.
This study introduces a stochastic perturbation mechanism that combines confidence-score perturbation and Gaussian bounding-box perturbation. This mechanism generates multiple prediction hypotheses from a single YOLO inference, allowing the detection output to be refined without repeated network forward passes.
This study employs class-constrained IoU-based clustering and confidence-weighted voting to aggregate multiple prediction hypotheses into a final refined detection. The process is designed to maintain class consistency and bounding-box stability, while the resulting spatial variation is treated as a bounding-box variance indicator rather than full epistemic uncertainty estimation.
The AS-YOLO framework has been tested on three variants of YOLO, namely YOLOv5, YOLOv8, and YOLOv11, using a beef image dataset comprising fresh and non-fresh classes. Model performance evaluation was conducted using standard evaluation metrics for object detection, including mean Average Precision (mAP), precision, recall, and inference speed, to assess detection performance and real-time feasibility.
This study provides preliminary external testing using independently collected primary images to examine the behavior of AS-YOLO beyond the internal dataset. This evaluation is used to assess detection stability under independent acquisition conditions, while avoiding overgeneralization beyond the tested data.
In summary, the proposed AS-YOLO framework contributes to real-time beef freshness inspection by offering a lightweight output-level refinement mechanism that supports detection stability and real-time feasibility. Its relevance to safety and security engineering lies in its potential application for automated food quality inspection, hazard prevention, and supply-chain monitoring, while broader validation on larger and more diverse real-world datasets remains necessary.
Various approaches based on deep learning, machine learning, and computer vision have been developed to support non-destructive food quality inspection, including fish freshness [28, 29], beef freshness [15, 30, 31], and chicken egg viability [32]. These methods demonstrate that digital images can effectively reveal visual changes related to the degradation process of food, such as color shifts, texture changes, and surface patterns.
However, most prior studies formulate the classification task based on static images, which do not provide direct information about object location or support real-time inspection. In addition, most models yield deterministic predictions and do not explicitly account for prediction uncertainty that can arise from environmental variations, such as lighting variations, changes in camera viewpoints, and surface reflections [33]. Research on probabilistic object detection has shown that modeling spatial and semantic uncertainty can improve detection reliability, especially in environments with noise and visual ambiguity [34].
Several previous studies have applied YOLO in real-time applications because of its ability to achieve high inference speed with competitive accuracy. The YOLO variants are used for visual detection of shrimp freshness [35], fish freshness classification [36, 37], fish sorting [38], beef quality inspection [39, 40], and fresh beef and thawed beef classification [41]. These results indicate that YOLO is a highly effective architecture for fast and accurate image-based food inspection. Parallel studies published in safety and security engineering have similarly demonstrated YOLO’s robustness under challenging real-world conditions, including low-light nighttime surveillance [27]. This work provides an empirical basis for YOLO as a reliable real-time detector in safety-critical domains, supporting the design choices made in the present study.
Nevertheless, most YOLO deployments in food quality inspection still rely on deterministic predictions. In real operating conditions, these models can produce unstable predictions or false detections when confronted with visual variations such as light reflections, storage-induced color changes, complex backgrounds, and different image-capture angles. Moreover, many existing studies have not provided an explicit mechanism to generate multiple prediction hypotheses and combine them into more robust detection results. In short, there remains a need for lightweight yet effective post-processing approaches to improve prediction stability without sacrificing inference speed.
To enhance the reliability of deep learning models, especially in safety-critical applications, many uncertainty estimation methods have been proposed [42]. One of the most popular methods is Monte Carlo Dropout (MC-Dropout) [42], where dropout is applied at inference time to derive stochastic predictions [43]. This method has been widely applied for uncertainty estimation in classification, regression and object detection tasks [44, 45]. Furthermore, the work on Stochastic-YOLO has shown that stochastic inference can increase the reliability of YOLO predictions under data distribution shifts [46]. Confidence-based aggregation methods, such as Weighted Boxes Fusion, have been shown to improve at merging multiple predicted bounding boxes into a single, more stable and accurate detection [47]. Nevertheless, many of these approaches target more complex probabilistic modeling or have not specifically addressed YOLO-based food inspection systems that require real-time performance.
Unlike these approaches, this study neither modifies the internal YOLO architecture nor applies full Bayesian inference across the entire network. Instead, it introduces a post-detection mechanism referred to as Stochastic Refinement that operates at the detection output level. This approach yields several prediction variations through Dropout-based stochastic perturbation and Gaussian perturbation on normalized bounding boxes, then groups overlapping predictions using IoU-based clustering, and combines them via confidence-weighted voting. With this strategy, detection-output stability can be supported without retraining the model or altering the core YOLO structure.
Previous research has explored a variety of deep learning, machine learning, and computer vision approaches for non-destructive food quality inspection. These studies show that digital images can capture visual cues such as color changes, texture variations, and surface patterns that indicate food degradation. However, most prior studies formulate this problem as a static image classification task, lack explicit modeling of prediction uncertainty, and do not fully support real-time detection. Although YOLO has been successfully applied to real-time food inspection tasks and has demonstrated strong performance, deterministic predictions remain sensitive to environmental variations, including lighting, camera viewpoints, and surface reflections. Probabilistic approaches, such as Monte Carlo Dropout, Weighted Boxes Fusion, and Stochastic-YOLO, have improved detection reliability, but these approaches target complex modeling challenges or are not specifically designed for YOLO-based real-time food inspection.
Table 1. Comparison of previous Deep Learning studies in freshness detection and the Adaptive Stochastic YOLO (AS-YOLO) framework proposed
|
Study |
Domain |
Model |
Real-Time |
Post-Processing Stochastic |
|
Hasan et al. (2024) [11] |
Fish |
Mask R-Convolutional Neural Network (CNN) |
- |
- |
|
Abd Elfattah et al. (2025) [15] |
Beef |
VGG19 |
- |
- |
|
Hou et al. (2025) [35] |
Shrimp |
YOLO |
✓ |
- |
|
Yudhana et al. (2025) [39] |
Beef |
YOLOv5 |
✓ |
- |
|
Silmina et al. (2025) [40] |
Beef |
YOLOv11 |
✓ |
- |
|
This Work |
Beef |
AS-YOLO |
✓ |
✓ |
This gap motivates the present study, which proposes AS-YOLO as a solution. This post-processing refinement framework combines confidence-score stochastic perturbation, Gaussian bounding-box perturbation, IoU-based clustering, and confidence-weighted voting to support detection-output stability in YOLO-based real-time beef freshness detection tasks. Table 1 presents a summary of previous studies and shows the contributions of this study.
3.1 YOLO Architecture
The YOLO architecture consists of three main components: Backbone, Neck, and Head [48]. The Backbone, a Convolutional Neural Network (CNN), extracts and fuses representations. For instance, certain YOLO variants employ CSPDarknet53 and incorporate an RFE module at the P5 layer to realize multi-scale fusion. The Neck is a pyramidal feature extractor that improves generalization and scale-invariant detection performance and optimizes the detection of small, medium, and large scales. The Head, the final stage of detection, uses anchor boxes on the features to generate outputs such as class probabilities, objectness scores, and bounding boxes [48].
3.2 Stochastic Refinement Layer
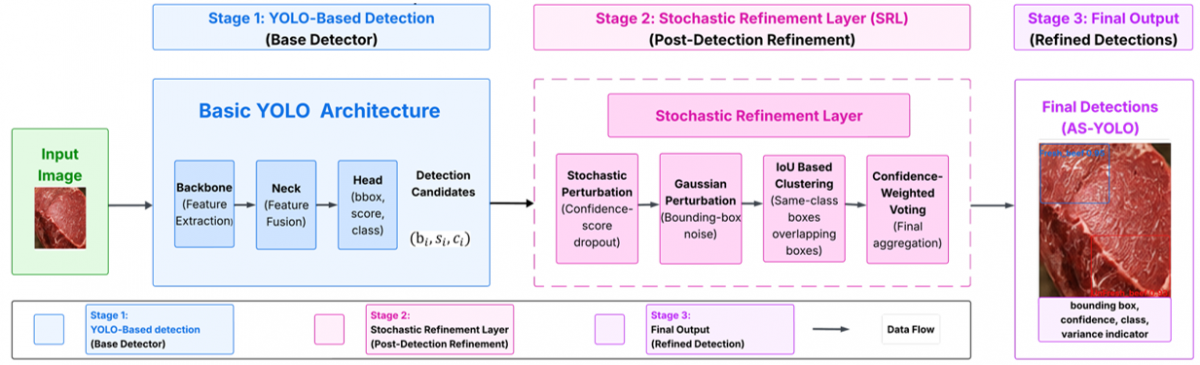
Unlike standard YOLO inference, which yields a single deterministic prediction per object, SRL generates several stochastic variants of each detection and refines them through clustering and weighted voting. SRL operates entirely on the detection outputs (bounding box coordinates, confidence score, and class label) produced by the YOLO detection head. SRL does not require multiple forward passes through the entire backbone and does not alter the training process. Figure 1 shows the proposed AS-YOLO framework architecture. SRL is applied after the YOLO detection head as a post-detection refinement module. With this approach, YOLO predictions that were initially deterministic become more stable and consistent, while the model’s foundational architecture and training regimen remain intact.
Figure 1. Proposed Adaptive Stochastic YOLO (AS-YOLO) framework with Stochastic Refinement Layer (SRL) applied as a post-detection inference refinement module
SRL consists of four steps:
Stochastic Perturbation
The first stage generates multiple prediction variations through output-level stochastic perturbation. In this implementation, stochastic perturbation is applied to the confidence score of each YOLO detection output, not to the normalized bounding-box coordinates. Inspired by Monte Carlo Dropout [43], this study does not perform stochastic sampling across the entire YOLO network. Instead, dropout is applied only at the detection-output level to introduce controlled variation in the confidence score. Therefore, this stage is implemented as a dropout-based confidence-score perturbation.
By restricting the stochastic process to the detection-output level, SRL should not be interpreted as a full epistemic uncertainty estimation method. Unlike conventional Monte Carlo Dropout, SRL does not perform repeated stochastic forward passes through the YOLO backbone, neck, or detection head. Instead, it generates output-level candidate variations that are later combined with Gaussian bounding-box perturbation, IoU-based clustering, and confidence-weighted voting. This setup enables SRL to generate multiple prediction hypotheses for each YOLO detection without modifying or retraining the model.
Gaussian Perturbation
After the stochastic perturbation stage, Gaussian perturbation is applied to the normalized bounding-box coordinates to generate controlled spatial variations around the original YOLO detection output. While stochastic perturbation is applied to the confidence score, Gaussian perturbation is applied only to the bounding-box coordinates. This perturbation is intended to support the refinement process in handling small spatial variations in detection outputs, which may occur due to differences in lighting conditions, camera angles, surface reflections, and meat texture appearance [49]. The class label remains unchanged from the original YOLO prediction.
Unlike more complex probabilistic approaches, this study uses a fixed Gaussian noise scale in each experimental configuration. This provides a simple output-level mechanism for generating spatial candidate variations without modifying or retraining the YOLO architecture. The Gaussian perturbation does not aim to estimate full predictive uncertainty; instead, it produces candidate bounding boxes around the initial YOLO detection for subsequent clustering and aggregation.
The Gaussian perturbation complements the confidence-score stochastic perturbation stage by generating multiple output-level candidate hypotheses. These candidates are then grouped using class-constrained IoU-based clustering and aggregated through confidence-weighted voting. Therefore, Gaussian perturbation is used as part of the SRL post-detection refinement process to support more stable and consistent detection outputs.
IoU Clustering
The outputs from the perturbation stages are grouped using an IoU-based clustering mechanism. This process is conceptually similar to Non-Maximum Suppression (NMS) [50]. However, in SRL, IoU-based clustering is used to group perturbed detection candidates before final aggregation, rather than to directly suppress overlapping predictions.
In this implementation, clustering is constrained by both spatial overlap and class consistency. Two prediction candidates are placed into the same cluster only if their IoU value is greater than or equal to the predefined threshold and they have the same predicted class label. This class-consistency constraint prevents candidates from different classes from being merged into the same cluster, even when their bounding boxes overlap.
By grouping overlapping candidates with the same class label, this stage reduces redundant hypotheses and prepares a more consistent candidate set for the confidence-weighted voting stage.
Confidence-Weighted Voting
After each cluster is formed, SRL applies confidence-weighted voting to generate the final prediction. Each candidate in a cluster is assigned a weight based on its confidence score, so candidates with higher confidence contribute more strongly to the final bounding-box estimate [47]. The final bounding box is calculated as the confidence-weighted average of all bounding boxes in the cluster, while the final confidence score is determined as the average confidence score of the clustered candidates. The final class label is determined from the class labels within the cluster.
In addition to producing the final bounding box, confidence score, and class label, SRL computes the spatial variance of bounding boxes within the cluster. This variance is used as a bounding-box variance indicator to describe the internal consistency of the clustered candidates. A lower variance value indicates that the perturbed candidates are spatially more consistent, whereas a higher variance value indicates larger variation among candidates. In this study, the bounding-box variance indicator is not used as a prediction rejection threshold and should not be interpreted as a full uncertainty estimation measure.
3.3 Mathematical formulation
The mathematical formulation in the SRL is designed to refine YOLO detection candidates by generating output-level stochastic perturbations, grouping overlapping predictions, and aggregating the final detection results through confidence-weighted voting. In this implementation, SRL is applied after a single YOLO inference and does not require repeated forward passes through the YOLO backbone, neck, or detection head.
Let the i-th detection candidate output from YOLO be defined as in Eq. (1):
$d_i=\left(b_i, s_i, c_i\right)$ (1)
where, $b_i$ is bounding box, $s_i$ is the confidence score, and $c_i$ is the class label [17]. The bounding box is expressed as Eq. (2):
$\mathrm{b}_i=\left(x_i, y_i, w_i, h_i\right)$ (2)
where, $x_i, y_i$ are the bounding box's normalized center coordinates, and $w_i$ and $h_i$ are the bounding box's normalized width and height, respectively.
3.3.1 Stochastic output perturbation iterations
Initial YOLO predictions are filtered by applying the confidence threshold $s_i>s_{\text {th }}$, where $s_{\text {th }}$ is the detection confidence threshold used in the corresponding experimental configuration. For each retained YOLO detection output, SRL generates $K$ stochastic output-level candidates as formulated in Eq. (3):
$\mathrm{d}_i^{(k)}=\left(b_i^{(k)}, s_i^{(k)}, c_i\right), k=1,2, \ldots, K$ (3)
where, $\bar{b}_i^{(k)}$ denotes the perturbed bounding box, $\widetilde{s}_i^{(k)}$ denotes the perturbed confidence score, and $c_i$ remains unchanged from the original YOLO prediction. Thus, SRL perturbs only the bounding-box coordinates and confidence scores at the output level, while the predicted class label is preserved during the stochastic candidate generation process.
The number of stochastic perturbation iterations was set to K = 10. This value was selected to provide a sufficient number of perturbed detection candidates for class-constrained IoU-based clustering and confidence-weighted voting, while maintaining computational efficiency during inference. Prior studies on MC Dropout-based uncertainty estimation have shown that prediction distributions tend to stabilize after several stochastic passes, commonly within the range of 10-20 iterations, with diminishing performance gains beyond that range [51]. Although SRL is not implemented as full MC Dropout, this range provides a useful empirical reference for determining the number of stochastic samples. In SRL, stochasticity is applied only at the detection-output level rather than through repeated stochastic forward passes across the entire YOLO network. Therefore, K = 10 was considered sufficient to generate diverse candidate variations around the initial YOLO detections without introducing excessive computational overhead. A smaller number of iterations may limit candidate diversity for reliable clustering, whereas a substantially larger number may increase inference latency and reduce suitability for real-time food safety inspection. Thus, K = 10 was used as a fixed sampling setting to ensure a fair comparison across SRL configurations, while the ablation study focused on Gaussian perturbation scale, confidence-score dropout probability, IoU threshold, and confidence threshold.
3.3.2 Stochastic perturbation
In this subsection, stochastic perturbation refers to dropout-based perturbation applied only to the confidence score of each YOLO detection output. It is not applied to the normalized bounding-box coordinates, nor to the full YOLO network. The bounding-box coordinates are perturbed separately using Gaussian perturbation, while dropout is used to introduce controlled stochastic variation in the detection confidence score at the output level.
Let si denote the original confidence score of the i-th YOLO detection candidate. For the k-th stochastic perturbation iteration, the perturbed confidence score is formulated as Eq. (4):
$\tilde{s}_j^{(k)}=\operatorname{Dropout}\left(s_i ; p\right)$ (4)
where p denotes the dropout probability. Since dropout is applied only at the detection-output level, this process should not be interpreted as full MC Dropout uncertainty estimation or Bayesian inference across the entire YOLO network. Instead, it is used as a confidence-score stochastic perturbation mechanism to generate variations among detection candidates before class-constrained IoU-based clustering and confidence-weighted voting.
The initial SRL configuration used p = 0.3 as an aggressive confidence-score perturbation setting. This value was selected by referring to prior MC Dropout-based studies that commonly evaluate dropout probabilities within the range of 0.2–0.5 [43]. In addition, Stochastic-YOLO-related work has investigated dropout rates of 25%, 50%, and 75%, indicating that moderate dropout settings can provide a practical balance between stochasticity and prediction stability in YOLO-based object detection systems [46]. Based on these references, p = 0.3 was used as the initial setting to provide sufficient stochastic variation in confidence scores.
However, because SRL applies dropout only to detection confidence scores rather than to full network activations or bounding-box coordinates, the effect of p may differ from conventional MC Dropout. Therefore, the dropout probability was further examined through the ablation study. In the ablation configurations, confidence-score dropout was removed in the Gaussian-only setting (p = 0), while lower dropout probabilities (p = 0.05 and p = 0.02) were evaluated to analyze whether reduced confidence-score perturbation could improve detection stability. Thus, p = 0.3 represents the initial aggressive configuration, whereas the lower dropout probabilities are treated as ablation settings for evaluating the sensitivity of SRL to confidence-score perturbation.
3.3.3 Gaussian perturbation
Gaussian perturbation is applied to the normalized bounding-box coordinates to generate controlled spatial variations around the original YOLO detection output. Unlike stochastic perturbation in the previous subsection, which is applied only to the confidence score, Gaussian perturbation is applied only to the bounding-box coordinates. The class label remains unchanged from the original YOLO prediction.
Let bi denote the normalized bounding box of the i-th YOLO detection candidate. For the k-th stochastic perturbation iteration, the perturbed bounding box is formulated as Eq. (5):
$\bar{b}_i^{(k)}=\operatorname{clip}\left(b_i+\epsilon_i^{(k)}, 0,1\right), \epsilon_i^{(k)} \sim N\left(0, \sigma^2 I\right)$ (5)
where, $\epsilon_i^{(k)}$ represents Gaussian noise, $\sigma$ is the perturbation scale, and $I$ denotes the identity matrix for the four boundingbox components $(x, y, w, h)$ The clipping operation constrains the perturbed normalized bounding-box coordinates to the range $[0,1]$.
This perturbation is intended to support the refinement process in handling small spatial variations in detection outputs, which may occur due to differences in lighting conditions, camera angles, surface reflections, and meat texture appearance [49]. The use of Gaussian distributions is also consistent with previous studies that model spatial variation in bounding-box predictions [52]. In addition, perturbing bounding-box predictions has been reported to improve the robustness and generalization of object detection models [53].
The initial SRL configuration used σ = 0.05 as an aggressive spatial perturbation setting. This value was selected empirically to provide sufficient spatial variation around the initial YOLO detection while keeping the perturbed bounding boxes within reasonable normalized coordinate bounds. However, since excessive perturbation may shift detections away from the object region and reduce localization accuracy, smaller values of σ were further evaluated in the ablation study. Specifically, $\sigma=0.005$ was used in the Gaussian-only and moderate SRL configurations, while $\sigma=0.002$ was used in the conservative SRL configuration to analyze the effect of reduced spatial perturbation on detection stability.
3.3.4 Intersection over Union-based clustering
IoU for two bounding boxes $b_a$ and $b_b$, is computed using Eq. (6) [54]:
$\operatorname{IoU}\left(b_a, b_b\right)=\frac{\operatorname{Area}\left(b_a \cap b_b\right)}{\operatorname{Area}\left(b_a \cup b_b\right)}$ (6)
Two predictions are placed into the same cluster if they satisfy both the IoU overlap criterion and the class-consistency criterion $\operatorname{IoU}\left(b_a, b_b\right) \geq \tau_{\text {IoU }}$ and $c_a=c_b$, where $\tau_{\text {IoU }}$ is the IoU threshold, while $c_a$ and $c_b$ are the class labels of the two detection candidates. This means that two candidates are not grouped only because their bounding boxes overlap; they must also belong to the same predicted class.
This process is conceptually similar to non-maximum suppression, but in SRL it is used to group perturbed detection candidates before final aggregation rather than to directly suppress overlapping predictions [50]. The class-consistency constraint prevents candidates from different classes from being merged into the same cluster, even when their bounding boxes overlap.
The initial SRL configuration used $\tau_{\text {IoU }}=0.5$, while the ablation configurations used $\tau_{\text {IoU }}=0.6$. The higher IoU threshold in the ablation settings was used to enforce stricter spatial consistency among candidates within the same cluster, thereby reducing the possibility of grouping weakly overlapping predictions.
3.3.5 Weighted voting and final prediction
After the cluster $C$ is formed, the final prediction is computed using confidence-weighted voting. Each prediction in the cluster is assigned a weight based on its confidence score $w^{(n)}=s^{(n)}$, where $s^{(n)}$ denotes the confidence score of the nth prediction candidate in cluster $C$. The final bounding box is calculated as the confidence-weighted average of all bounding boxes in the cluster using Eq. (7):
$b_{\text {final }}=\frac{\sum_{n \in C} w^{(n)} b^{(n)}}{\sum_{n \in c^w} w^{(n)}+\varepsilon}$ (7)
where, $\epsilon=10^{-6}$ to prevent division by zero. This confidence-based aggregation is in line with the principle of weighted bounding box fusion used in the Weighted Boxes fusion method [47].
The final confidence score is determined as the average confidence score within the cluster using Eq. (8):
$S_{\text {final }}=\frac{1}{|C|} \sum_{n \in C} S^{(n)}$ (8)
The final class label is determined as the mode of the class IDs within the cluster according to Eq. (9):
$c_{\text {final }}=\operatorname{mode}\left(\left\{c^{(n)} \mid n \epsilon C\right\}\right)$ (9)
Since the clustering process is class-constrained, all candidates within the same cluster are required to have the same class label. Therefore, using the mode of the class IDs provides a formal representation of the final class assignment and remains consistent with the implementation.
3.3.6 Bounding-box variance indicator
In addition to generating the final bounding box and confidence score, SRL computes spatial variance as an indicator of bounding-box consistency within the cluster using Eq. (10):
$\operatorname{Var}(b)=\frac{\sum_{n \in C} w^{(n)}\left(b^{(n)}-b_{\text {final }}\right)^2}{\sum_{n \in C} w^{(n)}+\epsilon}$ (10)
A smaller variance value indicates that predictions within the cluster are more consistent; thus, the detection results are considered more stable. Conversely, a larger variance value indicates greater spatial variation among the perturbed candidates within the cluster. This value is therefore used as a bounding-box variance indicator, not as a full uncertainty estimation measure. The final AS-YOLO output is expressed as Eq. (11):
$D_{\text {final }}=\left(b_{\text {final }}, s_{\text {final }}, c_{\text {final }}, \operatorname{Var}_{(b)}\right)$. (11)
In this implementation, $Var_{(b)}$ is used as an indicator of internal consistency, not as a threshold to reject predictions. Therefore, SRL should be understood as an output-level stochastic post-detection refinement module that aims to improve the stability and consistency of YOLO detection outputs without modifying or retraining the YOLO architecture.
4.1 Dataset
The dataset used in this study consists of 4,000 beef images obtained from the publicly available Roboflow Universe repository. It is divided into two semantic classes, namely fresh beef and non-fresh beef, with 2,000 images for each class. To maintain consistency with the original dataset annotation files and the YOLO training configuration, the technical class labels were retained as fresh_beef and unfresh_beef. However, for clarity and consistency in academic reporting, the technical labels fresh_beef and unfresh_beef are presented in this paper as fresh beef and non-fresh beef. Since the dataset is publicly available, its image samples and annotations can be accessed and reused by other researchers under the repository’s terms of use, thereby supporting reproducibility.
Each image is accompanied by bounding-box annotations indicating the location of the beef object and its corresponding freshness class. The annotations were used to train and evaluate the YOLO-based object detection models. In this study, the annotation format was adjusted to the YOLO detection format, where a class label and normalized bounding-box coordinates represent each object instance. The two annotation labels used in the experiment were fresh beef and non-fresh beef.
The images in the dataset were originally provided at a fixed resolution of 416 × 416 pixels. For model implementation, the images were processed using the size defined in the YOLO training configuration, and the same configuration was consistently applied to the training, validation, and testing subsets to ensure a fair comparison among all evaluated models.
The dataset contains beef images with variations in visual appearance, including difference in beef color, texture, object position and background. Some images have relatively simple backgrounds, and others have more complex or cluttered surroundings. The dataset also includes lighting variations that may affect the visual appearance of beef freshness. However, the original Roboflow dataset does not provide complete metadata regarding the image acquisition process, such as the camera device used, exact lighting setup, shooting distance, environmental conditions, and pre-capture storage duration. Therefore, these aspects are acknowledged as limitations of the dataset description.
For model development, the dataset was divided into three subsets: training, validation, and testing. The training, validation, and testing subsets comprised 2,782, 803, and 415 images, respectively, as summarised in Table 2. The testing subset was kept separate from the training and validation subsets to evaluate the detection performance of the trained models on unseen images from the same dataset.
This dataset partitioning allows the models to learn class-specific visual features from the training data, tune performance using the validation data, and evaluate final detection performance on the testing data. Nevertheless, because all images originate from a single two-class dataset, the evaluation should be interpreted as an internal dataset evaluation rather than external validation. Further testing using independent datasets, real market or industrial images, different camera devices, lighting variations, reflections, and different meat storage conditions is required to assess the broader generalization capability of the proposed AS-YOLO framework.
Table 2. Experimental sample distribution
|
Dataset Type |
Samples |
|
Training |
2782 |
|
Validation |
803 |
|
Testing |
415 |
|
Total |
4000 |
4.2 Data pre-processing
Before the training phase, the beef image dataset was pre-processed to ensure input consistency, annotation reliability, and compatibility with the YOLO-based detection models used in this study [55]. Roboflow Universe’s dataset already included bounding-box annotations and binary class labels for fresh beef and non-fresh beef. To verify consistency among the annotations, class labels, and bounding-box positions, the authors conducted an additional quality-control check. The goal of this inspection was to decrease annotation errors, such as the incorrect position of the bounding box or the wrong assignment of the class. The original images in the dataset repository were provided with a resolution of 416 × 416 pixels.
The input images were resized to 640 × 640 pixels for training and evaluation according to the configuration of the YOLO training pipeline. This resizing was applied consistently to the training, validation, and testing subsets, so that all models received inputs with the same spatial dimensions. The use of a fixed input size also supports fair comparison among the baseline YOLO models and the proposed AS-YOLO variants.
The resizing process was performed automatically within the YOLO training pipeline using interpolation. Since object detection performance is sensitive to object scale and bounding-box localization, maintaining a consistent input resolution is important to performance across models. In this study, we chose an input size of 640 × 640 to ensure enough spatial resolution for the detection of the beef regions and the assessment of bounding-box localization performance.
We did not use any other image enhancement techniques such as contrast adjustment, sharpening, denoising or color correction before training. This was done to keep the original visual characteristics of the dataset and to avoid artificial changes which might impact the comparison between baseline YOLO and AS-YOLO models. Therefore, the models were trained and evaluated using the visual information available in the original dataset after resizing.
In addition, no external image data were added during this pre-processing stage. The training, validation, and testing subsets followed the dataset partition described in Table 2. This ensured that model performance was evaluated on the designated testing subset without overlap with the training and validation data. However, because preprocessing did not include robustness-oriented transformations such as lighting variation, reflection simulation, camera viewpoint variation, or storage-condition simulation, the evaluation results should be interpreted within the scope of the available dataset. Further robustness testing under more diverse acquisition conditions is recommended for future validation.
4.3 Experimental setup
The proposed AS-YOLO framework, augmented with the SRL, was systematically evaluated on three widely used baseline YOLO architectures: YOLOv5, YOLOv8, and YOLOv11. The experimental design compares each model's performance before and after incorporating SRL, enabling a systematic assessment of the effect of the stochastic post-detection refinement mechanism. We trained and evaluated all models on Google Colab, using a Tesla T4 Graphics Processing Unit (GPU), which offered ample resources to support both training and real-time inference. During the experiments, we monitored various performance aspects, including convergence trends, loss curves, and prediction stability over epochs.
We selected evaluation metrics to provide a comprehensive view of model abilities: mean average precision (mAP) for overall detection accuracy across classes; precision and recall to quantify the reliability of predictions against ground truth; and inference speed (frames per second (FPS) and milliseconds per image) to gauge real-time applicability and computational efficiency. This framework enabled a detailed comparison of stability, accuracy, and efficiency across the three YOLO variants. Furthermore, the setup clearly demonstrated the advantages of SRL, including changes in detection behavior, output stability, and inference efficiency under the evaluated beef image conditions.
4.4 Training configuration of baseline YOLO models
The training process was performed only on the baseline YOLO models, namely YOLOv5, YOLOv8, and YOLOv11. The proposed AS-YOLO variants were not trained as separate models because the SRL was implemented as a post-detection refinement module. Therefore, SRL does not modify the backbone, neck, or detection head of the YOLO models and does not introduce additional trainable parameters during the training phase.
All baseline YOLO models were trained using the beef freshness dataset consisting of two classes, namely fresh beef and non-fresh beef. The same training configuration was applied to all baseline models to enable comparison. We used the AdamW optimizer for up to 100 epochs, with a batch size of 16 and a learning rate of 0.01. We ran the experiments on a Tesla T4 GPU, using PyTorch in conjunction with the Ultralytics framework. The training parameters are summarized in Table 3.
The AS-YOLO variants were constructed after the baseline YOLO models had completed training. During inference, SRL was applied to the detection outputs produced by the trained YOLO models. Thus, any improvement observed in AS-YOLO should be interpreted as the result of post-detection stochastic refinement rather than retraining or architectural modification of the YOLO network.
Table 3. Training parameters for the experiment
|
Parameter |
Value |
|
Epochs |
100 |
|
Batch size |
16 |
|
Optimizer |
AdamW |
|
Learning Rate |
0.01 |
|
Graphics Processing Unit (GPU) |
Tesla T4 |
|
Framework |
PyTorch + Ultralytics |
4.5 Stochastic Refinement Layer ablation study
The ablation study was conducted to examine how different SRL parameter settings affect the behavior of the proposed AS-YOLO framework. Since SRL operates only at the detection-output level, its effectiveness depends not only on the quality of the initial YOLO detections but also on the magnitude of the confidence-score perturbation, Gaussian bounding-box perturbation, IoU threshold, and confidence threshold. Therefore, four SRL configurations were evaluated while keeping the number of stochastic iterations fixed at K = 10, as shown in Table 4. The corresponding ablation performance is presented in Table 5.
As shown in Table 5, the aggressive configuration C1 produced the lowest localization performance across all AS-YOLO variants, with mAP@0.5:0.95 values ranging from 83.77% to 84.69%. Although C1 maintained high mAP@0.5 and recall, its lower mAP@0.5:0.95 indicates that excessive confidence-score perturbation and a relatively large Gaussian bounding-box perturbation scale can reduce localization quality. This result suggests that overly strong output-level perturbation may shift the refined predictions away from the most accurate bounding-box region.
In contrast, C2, C3, and C4 produced more stable results because their perturbation settings were more conservative. These configurations maintained 100.00% mAP@0.5 and 100.00% recall across all AS-YOLO variants, indicating that the refined detections preserved the object detection capability of the baseline YOLO models at the IoU threshold of 0.5. However, differences remained visible in mAP@0.5:0.95, which provides a stricter evaluation of localization quality across multiple IoU thresholds.
Table 4. Stochastic Refinement Layer (SRL) configuration settings for the ablation study
|
Config. |
K |
p |
$\sigma$ |
IoU |
Conf. Thr. |
|
C1 |
10 |
0.30 |
0.05 |
0.50 |
0.25 |
|
C2 |
10 |
0 |
0.005 |
0.60 |
0.25 |
|
C3 |
10 |
0.05 |
0.005 |
0.60 |
0.10 |
|
C4 |
10 |
0.02 |
0.002 |
0.60 |
0.10 |
Table 5. Stochastic Refinement Layer (SRL) ablation performance on the internal testing dataset
|
Config. |
Model |
mAP@0.5 (%) |
mAP@0.5:0.95 (%) |
Precision (%) |
Recall (%) |
|
C1 |
AS-YOLOv5 |
99.88 |
84.33 |
94.56 |
100.00 |
|
AS-YOLOv8 |
99.88 |
83.77 |
92.99 |
100.00 |
|
|
AS-YOLOv11 |
99.88 |
84.69 |
94.14 |
100.00 |
|
|
C2 |
AS-YOLOv5 |
100.00 |
96.46 |
99.64 |
100.00 |
|
AS-YOLOv8 |
100.00 |
96.70 |
99.16 |
100.00 |
|
|
AS-YOLOv11 |
100.00 |
97.45 |
100.00 |
100.00 |
|
|
C3 |
AS-YOLOv5 |
100.00 |
96.51 |
98.31 |
100.00 |
|
AS-YOLOv8 |
100.00 |
96.75 |
97.23 |
100.00 |
|
|
AS-YOLOv11 |
100.00 |
97.33 |
100.00 |
100.00 |
|
|
C4 |
AS-YOLOv5 |
100.00 |
96.70 |
98.31 |
100.00 |
|
AS-YOLOv8 |
100.00 |
96.82 |
97.23 |
100.00 |
|
|
AS-YOLOv11 |
100.00 |
97.52 |
100.00 |
100.00 |
Among the evaluated configurations, C4 provided the most consistent localization performance across the three AS-YOLO variants. As reported in Table 5, C4 achieved mAP@0.5:0.95 values of 96.70% for AS-YOLOv5, 96.82% for AS-YOLOv8, and 97.52% for AS-YOLOv11. These values were the highest results for each corresponding AS-YOLO variant. Therefore, C4 was selected as the final SRL configuration for the subsequent comparison with the baseline YOLO models.
Overall, the ablation results indicate that SRL performs more appropriately as a conservative post-detection refinement mechanism than as an aggressive perturbation strategy. The selected C4 configuration provides a balanced setting that preserves detection performance, maintains recall, and supports bounding-box localization stability on the internal testing dataset.
4.6 Performance comparison using the selected Stochastic Refinement Layer configuration
The final performance comparison was conducted using 415 internal testing images separated from the Roboflow Universe beef freshness dataset. These images were not used during model training or validation. The evaluation compares the baseline YOLO models and their corresponding AS-YOLO variants using four standard object detection metrics, namely mAP@0.5, mAP@0.5:0.95, precision, and recall. The internal testing results are presented in Table 6.
As shown in Table 6, all baseline YOLO and AS-YOLO variants achieved 100.00% mAP@0.5 and 100.00% recall on the internal testing dataset. This result indicates that all evaluated models were able to detect the beef objects correctly at the IoU threshold of 0.5. However, differences were still observed in mAP@0.5:0.95, which provides a stricter evaluation of localization quality across multiple IoU thresholds.
Based on Table 6, AS-YOLOv5 slightly increased mAP@0.5:0.95 from 96.67% to 96.70% and precision from 98.27% to 98.31%. Meanwhile, AS-YOLOv8 and AS-YOLOv11 showed very small decreases in mAP@0.5:0.95, from 96.89% to 96.82% and from 97.59% to 97.52%, respectively. These differences are numerically small and indicate that the selected C4 SRL configuration preserved the high detection performance of the baseline models on the internal testing dataset.
It is important to clarify that this evaluation represents internal testing on unseen images from the same dataset source, not full external validation. Although the training, validation, and testing subsets were separated before model evaluation, all subsets originated from the same secondary dataset. Therefore, the internal testing results should be interpreted as evidence of strong within-dataset performance rather than evidence of generalization across all real-world acquisition conditions.
In addition to the internal testing dataset, this study conducted preliminary external testing using independently collected primary images. The primary dataset consisted of 40 beef images, including 20 fresh beef images and 20 non-fresh beef images. These images were obtained from independent acquisition sources, including traditional market samples, Qurban meat samples, and a controlled meat spoilage experiment conducted by the authors. Thus, the primary dataset was not part of the Roboflow training, validation, or internal testing subsets.
The purpose of the primary-data experiment was to provide an initial observation of AS-YOLO behavior under independent acquisition conditions. However, because the number of primary images was limited, this experiment is reported as preliminary external testing rather than full external validation. The preliminary external testing results using the selected C4 configuration are presented in Table 7.
As shown in Table 7, AS-YOLOv5 produced a slight increase over YOLOv5 in mAP@0.5, mAP@0.5:0.95, and precision, while recall remained unchanged. For YOLOv8, AS-YOLOv8 increased mAP@0.5 and precision, but mAP@0.5:0.95 slightly decreased. Meanwhile, AS-YOLOv11 produced the same mAP@0.5, mAP@0.5:0.95, precision, and recall values as the baseline YOLOv11.
Table 6. Detection performance comparison of baseline YOLO and proposed Adaptive Stochastic YOLO (AS-YOLO) models for internal data testing
|
Model |
mAP@0.5 (%) |
mAP@0.5:0.95 (%) |
Precision (%) |
Recall (%) |
|
|
Basic |
YOLOv5 |
100.00 |
96.67 |
98.27 |
100.00 |
|
YOLOv8 |
100.00 |
96.89 |
97.23 |
100.00 |
|
|
YOLOv11 |
100.00 |
97.59 |
100.00 |
100.00 |
|
|
Proposed |
AS-YOLOv5 |
100.00 |
96.70 |
98.31 |
100.00 |
|
AS-YOLOv8 |
100.00 |
96.82 |
97.23 |
100.00 |
|
|
AS-YOLOv11 |
100.00 |
97.52 |
100.00 |
100.00 |
|
Table 7. Preliminary external testing performance on independently collected primary data
|
Model |
mAP@0.5 (%) |
mAP@0.5:0.95 (%) |
Precision (%) |
Recall (%) |
|
|
Basic |
YOLOv5 |
61.25 |
49.75 |
71.67 |
65.00 |
|
YOLOv8 |
62.08 |
50.25 |
60.83 |
65.00 |
|
|
YOLOv11 |
62.50 |
51.25 |
65.00 |
62.50 |
|
|
Proposed |
AS-YOLOv5 |
62.50 |
50.50 |
72.08 |
65.00 |
|
AS-YOLOv8 |
62.50 |
50.04 |
61.25 |
65.00 |
|
|
AS-YOLOv11 |
62.50 |
51.25 |
65.00 |
62.50 |
|
Note: Adaptive Stochastic YOLO (AS-YOLO).
The results in Table 7 indicate that the selected C4 SRL configuration maintained stable detection behavior on independently collected images, with only small metric changes across the evaluated models. Therefore, the primary-data results should be interpreted as preliminary evidence of detection stability beyond the internal dataset, not as evidence of statistically significant improvement or full real-world generalization. Broader validation is still required using larger primary datasets, different camera devices, different lighting conditions, real market and industrial environments, and different meat storage conditions.
4.7 Statistical analysis
Statistical analysis was conducted to evaluate whether the observed differences between the baseline YOLO models and their corresponding AS-YOLO variants were statistically meaningful. This study used paired bootstrap testing to examine differences in mAP@0.5 and McNemar’s test to evaluate image-level detection success. In addition, the Wilcoxon signed-rank test was used as a supplementary diagnostic analysis to examine changes in confidence score and inference time. The Wilcoxon results were not interpreted as direct evidence of detection accuracy improvement because confidence score and runtime are not direct measures of mAP, precision, or recall. The statistical summary for the internal testing dataset is presented in Table 8.
As shown in Table 8, the paired bootstrap test for mAP@0.5 showed no statistically significant difference between the baseline YOLO models and their AS-YOLO variants on the internal testing dataset. All model pairs produced a bootstrap p-value of 1.000, with a 95% confidence interval of [0.0000, 0.0000]. McNemar’s test also showed no significant difference in image-level detection success, with p-values of 1.000 for all model pairs. This result is expected because all baseline and AS-YOLO variants had already achieved saturated mAP@0.5 and recall values on the internal testing dataset.
Based on Table 8, the internal testing results should not be interpreted as evidence of statistically significant improvement at mAP@0.5. Instead, they indicate that the selected C4 SRL configuration preserved the detection performance of the baseline YOLO models. This interpretation is consistent with the descriptive mAP@0.5:0.95 changes, where AS-YOLOv5 showed a very small increase, while AS-YOLOv8 and AS-YOLOv11 showed very small decreases. Therefore, the internal statistical results support the conclusion that AS-YOLO maintains high within-dataset detection performance rather than producing a statistically significant accuracy improvement.
The supplementary Wilcoxon signed-rank test on the internal testing dataset showed significant changes in several confidence-score and inference-time comparisons. For confidence score, significant differences were observed for YOLOv5-AS-YOLOv5, YOLOv8-AS-YOLOv8, and YOLOv11-AS-YOLOv11. For inference time, significant differences were observed for YOLOv8-AS-YOLOv8 and YOLOv11-AS-YOLOv11, while YOLOv5-AS-YOLOv5 did not show a significant runtime difference. However, these Wilcoxon findings were used only as diagnostic evidence because changes in confidence score and inference time do not directly represent changes in detection accuracy. The statistical summary for preliminary external testing on independently collected primary data is presented in Table 9.
As shown in Table 9, the paired bootstrap test for mAP@0.5 on the primary dataset produced p-values greater than 0.05 for all model pairs. YOLOv5-AS-YOLOv5 showed a small positive Δ mAP@0.5 of +1.25, YOLOv8-AS-YOLOv8 showed a small positive Δ mAP@0.5 of +0.42, and YOLOv11-AS-YOLOv11 showed no change. However, none of these differences were statistically significant. McNemar’s test also showed no significant difference in image-level detection success, with p-values of 1.000 for all model pairs.
Table 8. Statistical summary of detection performance on the internal testing dataset
|
Pair |
Δ mAP@0.5 |
95% CI |
Boot. p |
Δ mAP@0.5:0.95 (descriptive) |
McN p |
|
YOLOv5-AS-YOLOv5 |
0.00 |
[0.00, 0.00] |
1.000 |
+0.02 |
1.0 |
|
YOLOv8-AS-YOLOv8 |
0.00 |
[0.00, 0.00] |
1.000 |
-0.07 |
1.0 |
|
YOLOv11-AS-YOLOv11 |
0.00 |
[0.00, 0.00] |
1.000 |
-0.07 |
1.0 |
Note: 1. Δ = AS-YOLO − baseline YOLO. 2. CI = confidence interval obtained from paired bootstrap resampling. 3. Boot. p = paired bootstrap p-value computed for Δ mAP@0.5. 4. Δ mAP@0.5:0.95 is reported descriptively because the paired bootstrap test for mAP@0.5:0.95 was not computed in the current statistical output. 5. McN p = McNemar p-value for image-level detection success.
Table 9. Statistical summary of preliminary external testing on primary data
|
Pair |
Δ mAP@0.5 |
95% CI |
Boot. p |
Δ mAP@0.5:0.95 (descriptive) |
McN p |
|
YOLOv5-AS-YOLOv5 |
+1.25 |
[0.00, 3.75] |
0.3870 |
+0.75 |
1.0 |
|
YOLOv8-AS-YOLOv8 |
+0.42 |
[0.00, 1.25] |
0.359 |
-0.21 |
1.0 |
|
YOLOv11-AS-YOLOv11 |
0.00 |
[0.00, 0.00] |
1.000 |
0.00 |
1.0 |
Note: 1. Δ = AS-YOLO − baseline YOLO. 2. CI = confidence interval obtained from paired bootstrap resampling. 3. Boot. p = paired bootstrap p-value computed for Δ mAP@0.5. 4. Δ mAP@0.5:0.95 is reported descriptively because the paired bootstrap test for mAP@0.5:0.95 was not computed in the current statistical output. 5. McN p = McNemar p-value for image-level detection success.
These results indicate that the primary-data findings should not be interpreted as evidence of statistically significant performance improvement. Instead, they show that the selected C4 SRL configuration maintained stable preliminary external behavior on independently collected images. This interpretation is consistent with the performance results in Table 7, where AS-YOLOv5 showed a small increase in mAP@0.5:0.95 from 49.75% to 50.50%, AS-YOLOv8 showed a slight decrease in mAP@0.5:0.95, and AS-YOLOv11 maintained the same performance values as its baseline model.
The supplementary Wilcoxon signed-rank test on the primary dataset also showed significant changes in some confidence-score and inference-time comparisons. For confidence score, significant differences were observed for YOLOv5-AS-YOLOv5 and YOLOv11-AS-YOLOv11, while YOLOv8-AS-YOLOv8 did not show a significant difference. For inference time, significant differences were observed for YOLOv8-AS-YOLOv8 and YOLOv11-AS-YOLOv11, while YOLOv5-AS-YOLOv5 did not show a significant runtime difference. These results indicate that SRL can affect confidence behavior and runtime under primary-data conditions, but they do not provide direct evidence of improved detection accuracy.
Overall, the statistical analysis confirms that AS-YOLO should be interpreted as a lightweight output-level refinement framework that maintains detection stability and real-time feasibility, rather than as a method that produces statistically significant performance improvement under the evaluated conditions. The internal testing results demonstrate strong within-dataset performance, while the primary-data results provide preliminary external evidence that still requires broader validation using larger datasets, different camera devices, more diverse lighting conditions, and real market or industrial acquisition settings.
4.8 Visual analysis of detection results
Visual analysis was conducted to complement the quantitative evaluation by examining the qualitative behavior of the baseline YOLO models and the proposed AS-YOLO variants. This analysis is important because object detection performance is not only reflected by numerical metrics, but also by the consistency of bounding-box placement, class prediction, and visual interpretability of the detection output. In this study, the visual comparison was performed using the selected C4 SRL configuration, which provided the most stable performance in the ablation study.
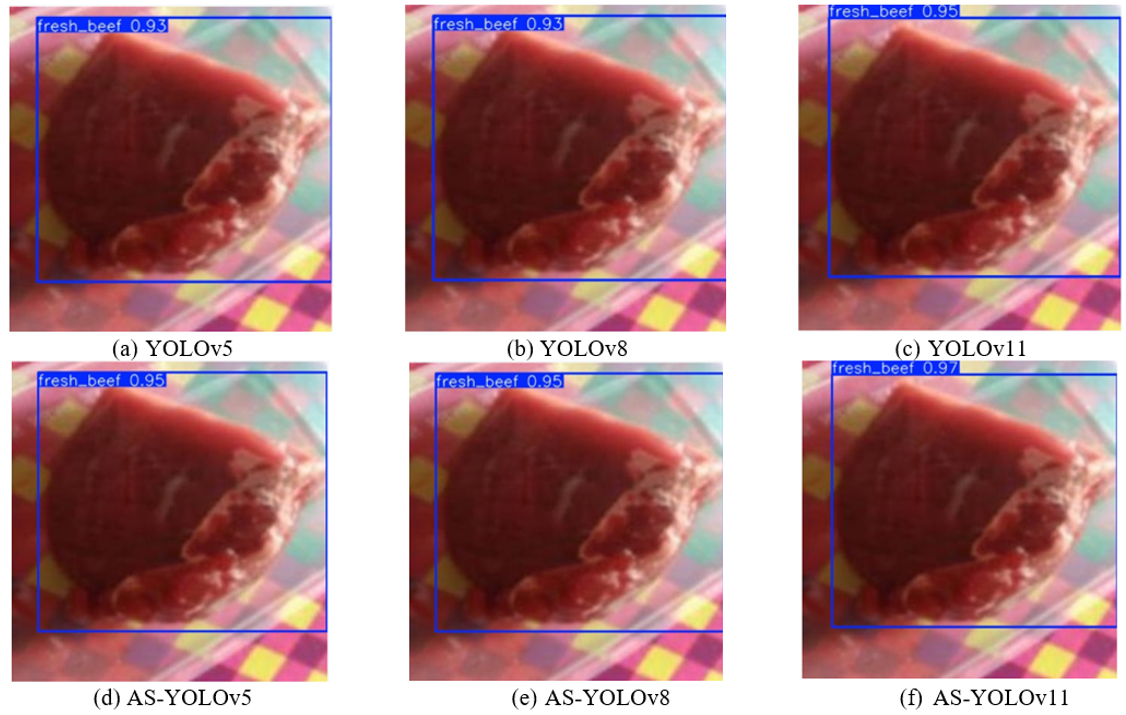
Figure 2 presents a qualitative comparison between the baseline YOLO models and their corresponding AS-YOLO variants on the internal testing dataset. The comparison includes YOLOv5, YOLOv8, YOLOv11, AS-YOLOv5, AS-YOLOv8, and AS-YOLOv11. The purpose of this comparison is to verify whether the proposed post-detection refinement process preserves the original object location and class prediction after applying confidence-score perturbation, Gaussian bounding-box perturbation, class-constrained IoU-based clustering, and confidence-weighted voting.
As shown in Figure 2, all evaluated models were able to detect the beef object and assign the correct freshness class. The AS-YOLO variants produced bounding boxes that remained visually consistent with their corresponding baseline YOLO models. This indicates that the selected conservative SRL configuration did not introduce excessive localization shifts during the refinement process. The refined detections also preserved the semantic class prediction generated by the baseline detectors, suggesting that SRL maintained class consistency while performing output-level refinement.
Figure 2. Qualitative detection comparison between baseline YOLO models and the proposed Adaptive Stochastic YOLO (AS-YOLO) variants on the internal testing dataset using the selected C4 Stochastic Refinement Layer (SRL) configuration
Although minor variations in confidence scores can be observed across the baseline and AS-YOLO variants, the overall detection outputs remain stable. This finding supports the quantitative results reported in the previous sections, where the selected C4 configuration preserved high detection performance on the internal testing dataset. Therefore, the visual results indicate that AS-YOLO can refine detection outputs without disrupting the spatial and semantic consistency of the original YOLO predictions.
Figure 3 presents a representative detection result on independently collected primary data. The image used in this qualitative example was not included in the Roboflow training, validation, or internal testing subsets. Therefore, this visualization provides an initial observation of how the selected AS-YOLO configuration behaves under independent acquisition conditions.
As shown in Figure 3, both YOLOv11 and AS-YOLOv11 were able to detect the beef object on the independently collected primary image. The bounding box produced by AS-YOLOv11 remained visually aligned with the object region and preserved the predicted freshness class. This result indicates that the proposed refinement process can maintain detection consistency beyond the internal testing dataset. However, this qualitative result should be interpreted cautiously because it is based on a representative example from a limited primary dataset.
Overall, the visual analysis demonstrates that the proposed AS-YOLO framework preserves class prediction and bounding-box consistency after the SRL refinement process. The qualitative results support the interpretation that AS-YOLO functions as a lightweight output-level refinement mechanism rather than a method that substantially changes the baseline detector behavior. Thus, the visual findings strengthen the quantitative evidence that the selected C4 configuration maintains stable detection outputs while preserving real-time applicability for beef freshness inspection.
Figure 3. Qualitative detection results on independently collected primary data using the selected C4 Stochastic Refinement Layer (SRL) configuration
4.9 Performance evaluation based on confusion matrices
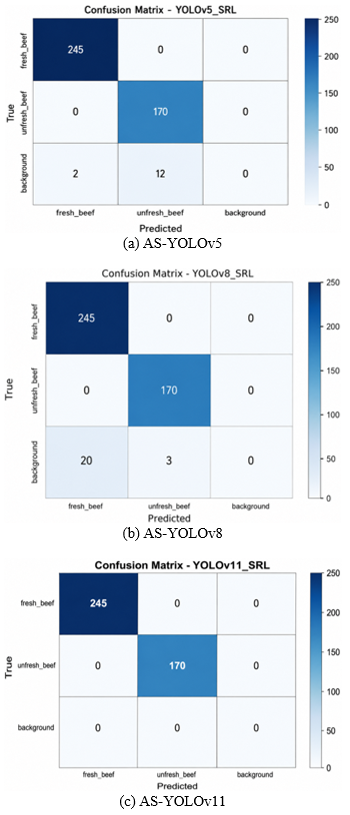
The confusion-matrix analysis was conducted to provide a class-level interpretation of the detection results produced by the proposed AS-YOLO variants. While mAP, precision, and recall summarize the overall detection performance, the confusion matrix provides additional information about how predictions are distributed across the fresh beef, non-fresh beef, and background categories. In this study, the background category represents unmatched predictions or missed ground-truth objects in the object detection evaluation process, rather than a target freshness class.
Figure 4. Confusion matrices of the proposed Adaptive Stochastic YOLO (AS-YOLO) variants on the internal testing dataset using the selected C4 Stochastic Refinement Layer (SRL) configuration
Figure 4 presents the confusion matrices of AS-YOLOv5, AS-YOLOv8, and AS-YOLOv11 on the internal testing dataset using the selected C4 SRL configuration. This evaluation was performed to examine whether the proposed SRL refinement process preserved class-discrimination capability after post-detection refinement. The confusion matrices were analyzed together with the quantitative metrics and statistical testing to avoid overinterpreting class-level visualization as standalone evidence of significant performance improvement.
As shown in Figure 4, the predictions of the AS-YOLO variants were mainly concentrated along the diagonal of the confusion matrices. This pattern indicates that the models correctly assigned most detected beef objects to their corresponding freshness classes. The results also show that both fresh beef and non-fresh beef classes could be recognized by the proposed AS-YOLO variants after the SRL refinement process.
The presence of background-related entries reflects the matching behavior commonly found in object detection evaluation. These entries may occur when a prediction does not satisfy the required matching criterion with the ground-truth bounding box or when a ground-truth object is not matched by a prediction. Therefore, background entries should not be interpreted as an additional beef freshness class, but rather as part of the object detection evaluation mechanism.
Among the evaluated AS-YOLO variants, AS-YOLOv11 showed the most stable overall class-level pattern. This observation is consistent with the quantitative results, where AS-YOLOv11 achieved the highest mAP@0.5:0.95 among the AS-YOLO variants on the internal testing dataset. However, this result should be interpreted as complementary evidence of class-level detection consistency, not as proof of statistically significant performance improvement.
This cautious interpretation is important because the paired bootstrap and McNemar tests did not indicate statistically significant differences between the baseline YOLO models and their AS-YOLO variants at mAP@0.5. Therefore, the confusion matrices are used to support the qualitative and class-level interpretation of the detection behavior, while the main statistical conclusion remains that AS-YOLO preserves detection stability rather than significantly improving detection accuracy under the evaluated conditions.
Overall, the confusion-matrix analysis indicates that the selected C4 SRL configuration maintains reliable class assignment for fresh beef and non-fresh beef on the internal testing dataset. These results further support the role of AS-YOLO as a lightweight post-detection refinement framework that preserves class consistency and detection behavior without modifying or retraining the baseline YOLO architecture.
4.10 Inference speed and real-time performance analysis
The inference speed of the proposed AS-YOLO variants was evaluated using inference time per image and FPS, as summarized in Table 10. This evaluation was conducted to determine whether the selected C4 SRL configuration remains feasible for real-time beef freshness inspection when applied as a post-detection refinement process.
As shown in Table 10, all AS-YOLO variants maintained real-time processing capability on both the primary and internal testing datasets. On the primary dataset, AS-YOLOv5, AS-YOLOv8, and AS-YOLOv11 achieved inference speeds of 45.06 FPS, 33.00 FPS, and 42.71 FPS, respectively. On the internal testing dataset, the corresponding AS-YOLO variants achieved 57.50 FPS, 54.54 FPS, and 52.36 FPS, respectively.
These results indicate that the selected C4 SRL configuration can preserve real-time feasibility while applying output-level stochastic post-detection refinement. Although the SRL process introduces additional computational steps, including confidence-score perturbation, Gaussian bounding-box perturbation, class-constrained IoU-based clustering, and confidence-weighted voting, the resulting inference speeds remained above 30 FPS across all evaluated AS-YOLO variants.
Table 10. Inference speed comparison of the proposed Adaptive Stochastic YOLO (AS-YOLO) variants on the primary and internal testing datasets
|
Dataset |
Model |
Time/Img (ms) |
FPS |
|
Primary |
AS-YOLOv5 |
22.19 |
45.06 |
|
AS-YOLOv8 |
30.30 |
33.00 |
|
|
AS-YOLOv11 |
23.41 |
42.71 |
|
|
Internal |
AS-YOLOv5 |
17.39 |
57.50 |
|
AS-YOLOv8 |
18.34 |
54.54 |
|
|
AS-YOLOv11 |
19.10 |
52.36 |
Among the evaluated models, AS-YOLOv5 achieved the highest inference speed on both datasets, reaching 45.06 FPS on the primary dataset and 57.50 FPS on the internal testing dataset. AS-YOLOv8 produced the lowest FPS on the primary dataset, but it still maintained 33.00 FPS, which remains suitable for real-time visual inspection. These findings suggest that the proposed refinement process can be applied without substantially compromising real-time detection requirements.
Overall, the inference-time results demonstrate that the proposed AS-YOLO framework remains practical for image-based beef freshness inspection. The selected C4 SRL configuration provides a lightweight refinement mechanism that supports detection stability while maintaining real-time performance, making it suitable for food safety inspection scenarios that require fast and automated visual assessment.
This study concludes that AS-YOLO can be used as a lightweight post-detection refinement framework for YOLO-based beef freshness detection. The proposed SRL operates only at the detection-output level and does not modify the backbone, neck, or detection head of the YOLO models. It also does not require retraining. The refinement process is performed through confidence-score perturbation, Gaussian bounding-box perturbation, class-constrained IoU-based clustering, and confidence-weighted voting. Therefore, AS-YOLO should be interpreted as an output-level refinement approach for stabilizing existing YOLO predictions, not as a replacement for the detector architecture.
The experimental results show that the selected conservative SRL configuration, namely C4, maintains strong detection performance on the internal testing dataset. All baseline YOLO and AS-YOLO variants achieved 100.00% mAP@0.5 and 100.00% recall on the internal testing dataset. For the stricter localization metric, AS-YOLOv5, AS-YOLOv8, and AS-YOLOv11 achieved mAP@0.5:0.95 values of 96.70%, 96.82%, and 97.52%, respectively. These results indicate that the proposed refinement process can preserve class prediction and bounding-box consistency under the tested internal data conditions. However, because the paired bootstrap and McNemar tests did not show statistically significant differences between the baseline YOLO models and their AS-YOLO variants, the results should not be interpreted as evidence of statistically significant performance improvement. Instead, the main conclusion is that AS-YOLO maintains stable detection behavior while preserving the high performance of the baseline detectors.
The preliminary external testing using independently collected primary images further shows that the selected C4 configuration can maintain comparable detection behavior outside the internal dataset. However, the metric differences on the primary dataset were also not statistically significant. Therefore, the primary-data experiment provides an initial indication of detection stability under independent acquisition conditions, but it does not represent full external validation. This interpretation is important because real-world food safety inspection requires robustness across different camera devices, lighting conditions, reflections, backgrounds, meat storage conditions, and market or industrial environments.
In terms of practical relevance, AS-YOLO supports image-based beef freshness inspection as part of food safety monitoring and supply-chain quality control. The method is relevant to safety and security engineering because it can assist in preventing unsafe meat distribution through fast visual inspection, while maintaining real-time feasibility. All AS-YOLO variants achieved more than 30 FPS on both internal and primary testing datasets. On the internal testing dataset, AS-YOLOv5, AS-YOLOv8, and AS-YOLOv11 achieved 57.50 FPS, 54.54 FPS, and 52.36 FPS, respectively. On the primary dataset, the corresponding models achieved 45.06 FPS, 33.00 FPS, and 42.71 FPS. These results indicate that the additional refinement process introduces acceptable computational overhead for real-time inspection scenarios.
This study has several limitations. The internal evaluation was conducted on a two-class beef freshness dataset, and the independently collected primary dataset was limited in size. The proposed SRL also provides output-level stochastic refinement and spatial stability analysis, not full epistemic uncertainty estimation of the YOLO network. Future research should validate AS-YOLO using larger external datasets collected from real market and industrial environments, with different camera devices, lighting conditions, backgrounds, reflections, and storage durations. Further studies should also include additional meat types, such as chicken, fish, and goat meat, as well as more detailed freshness categories, including fresh, semi-fresh, and spoiled. Repeated-run experiments and broader statistical testing on aggregate detection metrics are also needed to further verify the robustness and generalizability of the proposed refinement framework.
The beef freshness dataset used in this study is publicly available through the Roboflow Universe repository at https://universe.roboflow.com/dagingsegardantidaksegar/fresh_unfresh-beef.
[1] Smith, N.W., Fletcher, A.J., Hill, J.P., McNabb, W.C. (2022). Modeling the contribution of meat to global nutrient availability. Frontiers in Nutrition, 9: 766796. https://doi.org/10.3389/fnut.2022.766796
[2] Kavanaugh, M., Rodgers, D., Kavanaugh, M., Leroy, F. (2025). Considering the nutritional benefits and health implications of red meat in the era of meatless initiatives. Frontiers in Nutrition, 12: 1525011. https://doi.org/10.3389/fnut.2025.1525011
[3] Ramahaimandimby, Z., Shiratori, S., Rafalimanantsoa, J., Sakurai, T. (2023). Animal-sourced foods production and early childhood nutrition: Panel data evidence in Central Madagascar. Food Policy, 121: 102547. https://doi.org/10.1016/j.foodpol.2023.102547
[4] Khonje, M.G., Qaim, M. (2024). Animal-sourced foods improve child nutrition in Africa. Proceedings of the National Academy of Sciences, 121(50): https://doi.org/10.1073/pnas.2319009121
[5] Smith, N.W., Fletcher, A.J., Hill, J.P., McNab, W.C. (2023). The role of meat in the human diet: Evolutionary aspects and nutritional value. Animal Frontiers, 13(2): 11-18. https://doi.org/10.1093/af/vfac093
[6] Mafe, A.N., Edo, G.I., Makia, R.S., et al. (2024). A review on food spoilage mechanisms, foodborne diseases and commercial aspects of food preservation and processing. Food Chemistry Advances, 5: 100852. https://doi.org/10.1016/j.focha.2024.100852
[7] Majak, N.J.K., Nyarongi, O.J., Baaro, G.P. (2023). Assessment of meat preservation methods used by retailers and the estimation of direct economic losses associated with meat spoilage in Kenya. Journal of Food Safety and Hygiene, 9(4): 227-240. https://doi.org/10.18502/jfsh.v9i4.14999
[8] World Health Organization. (2026). WHO estimates of the global burden of foodborne diseases. https://www.who.int/teams/nutrition-and-food-safety/monitoring-nutritional-status-and-food-safety-and-events/foodborne-disease-estimates/2026-edition.
[9] Nugraha, A.F., Rahayu, W.P., Sitanggang, A.B. (2025). The prevalence of Salmonella contamination in beef and beef products: A systematic review and meta-analysis. BIO Web of Conferences, 186: 01015. https://doi.org/10.1051/bioconf/202518601015
[10] Singh, P.K., Agrawal, N., Khare, A.K. (2026). Artificial intelligence: An advanced tool to improve safety and quality in the meat industry. Journal of Food Process Engineering, 49(2): e70383. https://doi.org/10.1111/jfpe.70383
[11] Hasan, M., Vasker, N., Hossain, M.M., Bhuiyan, M.I., Biswas, J., Rashid, M.R.A. (2024). Framework for fish freshness detection and rotten fish removal in Bangladesh using Mask R-CNN method with robotic arm and fisheye analysis. Journal of Agricultural and Food Research, 16: 101139. https://doi.org/10.1016/j.jafr.2024.101139
[12] Altmann, B. A., Gertheiss, J., Tomasevic, I., Engelkes, C., et al. (2022). Human perception of color differences using computer vision system measurements of raw pork loin. Meat Science, 188: 108766. https://doi.org/10.1016/j.meatsci.2022.108766
[13] Fan, L., Chen, Y., Zeng, Y., Yu, Z., et al. (2024). Application of visual intelligent labels in the assessment of meat freshness. Food Chemistry, 460: 140562. https://doi.org/10.1016/j.foodchem.2024.140562
[14] Prema, K.P.K., Prema, J.V.K. (2022). Hybrid approach of CNN and SVM for shrimp freshness diagnosis in aquaculture monitoring system using IoT based learning support system. Journal of Internet Technology, 23(4): 801-810. https://doi.org/10.53106/160792642022072304015
[15] Abd Elfattah, M., Ewees, A.A., Darwish, A., Hassanien, A.E. (2025). Detection and classification of meat freshness using an optimized deep learning method. Food Chemistry, 489: 144783. https://doi.org/10.1016/j.foodchem.2025.144783
[16] Moon, E.J., Kim, Y., Xu, Y., Na, Y., Giaccia, A.J., Lee, J.H. (2020). Evaluation of salmon, tuna, and beef freshness using a portable spectrometer. Sensors, 20(15): 4299. https://doi.org/10.3390/s20154299
[17] Redmon, J., Divvala, S., Girshick, R., Farhadi, A. (2016). You only look once: Unified, real-time object detection. In Proceedings of the IEEE conference on computer vision and pattern recognition, Las Vegas, NV, USA, pp. 779-788. https://doi.org/10.1109/CVPR.2016.91
[18] Vilcapoma, P., Parra Meléndez, D., Fernández, A., et al. (2024). Comparison of Faster R-CNN, YOLO, and SSD for third molar angle detection in dental panoramic x-rays. Sensors, 24(18): 6053. https://doi.org/10.3390/s24186053
[19] Sukumarran, D., Hasikin, K., Khairuddin, A.S.M., et al. (2024). An optimised YOLOv4 deep learning model for efficient malarial cell detection in thin blood smear images. Parasites & Vectors, 17(1): 188. https://doi.org/10.1186/s13071-024-06215-7
[20] Li, C., Li, L., Jiang, H., et al. (2022). YOLOv6: A single-stage object detection framework for industrial applications. arXiv preprint arXiv:2209.02976. https://doi.org/10.48550/arXiv.2209.02976
[21] Wang, C.Y., Bochkovskiy, A., Liao, H.Y.M. (2023). YOLOv7: Trainable bag-of-freebies sets new state-of-the-art for real-time object detectors. In Proceedings of the IEEE/CVF conference on computer vision and pattern recognition, Vancouver, BC, Canada, pp. 7464-7475. https://doi.org/10.48550/arXiv.2207.02696
[22] Yaseen, M. (2024). What is YOLOv9: An in-depth exploration of the internal features of the next-generation object detector. arXiv: 2409.07813. https://doi.org/10.48550/arXiv.2409.07813
[23] Wang, A., Chen, H., Liu, L., et al. (2024). Yolov10: Real-time end-to-end object detection. Advances in neural information processing systems, 37: 107984-108011.
[24] Khanam, R., Hussain, M. (2024). Yolov11: An overview of the key architectural enhancements. arXiv preprint arXiv:2410.17725. https://doi.org/10.48550/arXiv.2410.17725
[25] Kukreti, S., Praveen, R.V.S., Bansal, S., Raju, H., Singh, N., Begum, R. (2025). Object detection in real-time surveillance using deep learning-based YOLO framework. In 2025 International Conference on Computational, Communication and Information Technology (ICCCIT), Indore, India, pp. 601-606. https://doi.org/10.1109/ICCCIT62592.2025.10928084
[26] Bochkovskiy, A., Wang, C.Y., Liao, H.Y.M. (2020). Yolov4: Optimal speed and accuracy of object detection. arXiv preprint arXiv:2004.10934. https://doi.org/10.48550/arXiv.2004.10934
[27] Namana, M.S.K., Kumar, B.U. (2024). An efficient and robust night-time surveillance object detection system using YOLOv8 and high-performance computing. International Journal of Safety and Security Engineering, 14(6): 1763-1773. https://doi.org/10.18280/ijsse.140611
[28] Saputra, S., Yudhana, A., Umar, R. (2022). Implementation of Naïve Bayes for fish freshness identification based on image processing. Jurnal RESTI (Rekayasa Sistem dan Teknologi Informasi), 6(3): 412-420. https://doi.org/10.29207/resti.v6i3.4062
[29] Yudhana, A., Umar, R., Saputra, S. (2022). Fish freshness identification using machine learning: Performance comparison of k-NN and Naïve Bayes classifier. Journal of Computer Science and Engineering, 16(3): 153-164. https://doi.org/10.5626/JCSE.2022.16.3.153
[30] Kozan, H.I., Akyürek, H.A. (2024). Development of a mobile application for rapid detection of meat freshness using deep learning. Theory and Practice of Meat Processing, 9(3): 249-257. https://doi.org/10.21323/2414-438X-2024-9-3-249-257
[31] Sangeetha, R., Abirami, D.K., Sathishkumar, S. (2025). Automated meat quality detection using DenseNet-121 transfer learning. International Journal of Innovative Research in Advanced Engineering, 12(10): 388-392. https://doi.org/10.26562/ijirae.2025.v1210.07
[32] Saifullah, S., Drezewski, R., Yudhana, A., et al. (2023). Nondestructive chicken egg fertility detection using CNN-transfer learning algorithms. Jurnal Ilmiah Teknik Elektro Komputer dan Informatika, 9(3): 854-871. https://doi.org/10.26555/jiteki.v9i3.26722
[33] Gustafsson, F.K., Danelljan, M., Schon, T.B. (2020). Evaluating scalable Bayesian deep learning methods for robust computer vision. In 2020 IEEE/CVF Conference on Computer Vision and Pattern Recognition Workshops, Seattle, WA, USA, pp. 1289-1298. https://doi.org/10.1109/CVPRW50498.2020.00167
[34] Hall, D., Dayoub, F., Skinner, J., et al. (2020). Probabilistic object detection: Definition and evaluation. In Proceedings of the IEEE/CVF Winter Conference on Applications of Computer Vision, pp. 1031-1040. https://doi.org/10.1109/WACV45572.2020.9093599
[35] Hou, M., Zhong, X., Zheng, O., Sun, Q., Liu, S., Liu, M. (2025). Innovations in seafood freshness quality: Non-destructive detection of freshness in Litopenaeus Vannamei using the YOLO-Shrimp model. Food Chemistry, 463: 141192. https://doi.org/10.1016/j.foodchem.2024.141192
[36] Akgül, İ., Kaya, V., Tanır, Ö.Z. (2023). A novel hybrid system for automatic detection of fish quality from eye and gill color characteristics using transfer learning technique. PLOS ONE, 18(4): e0284804. https://doi.org/10.1371/journal.pone.0284804
[37] Wu, X., Chu, Y., Wang, Z., et al. (2024). Quality non-destructive sorting of large yellow croaker based on image recognition. Journal of Food Engineering, 383: 112227. https://doi.org/10.1016/j.jfoodeng.2024.112227
[38] Kuswantori, A., Suesut, T., Tangsrirat, W., Schleining, G., Nunak, N. (2023). Fish detection and classification for automatic sorting system with an optimized YOLO algorithm. Applied Sciences, 13(6): 3812. https://doi.org/10.3390/app13063812
[39] Yudhana, A., Silmina, E.P., Sunardi. (2025). Deteksi kesegaran daging sapi menggunakan augmentasi data mosaic pada model YOLOv5sM. Jurnal Riset Sains dan Teknologi, 9(1): 63-71. https://doi.org/10.30595/jrst.v9i1.24990
[40] Silmina, E.P., Sunardi, Yudhana, A. (2025). Comparative analysis of YOLO deep learning model for image-based beef freshness detection. Jurnal Ilmu Pengetahuan dan Teknologi Komputer, 11(1): 250-265. https://doi.org/10.33480/jitk.v11i1.6784
[41] Xi, R., Lyu, X., Yang, J., et al. (2025). Non-destructive and real-time discrimination of normal and frozen-thawed beef based on a novel deep learning model. Foods, 14(19): 3344. https://doi.org/10.3390/foods14193344
[42] Abdar, M., Pourpanah, F., Hussain, S., et al. (2021). A review of uncertainty quantification in deep learning: Techniques, applications and challenges. Information Fusion, 76: 243-297. https://doi.org/10.1016/j.inffus.2021.05.008
[43] Ahmed, S.T., Danouchi, K., Hefenbrock, M., Prenat, G., Anghel, L., Tahoori, M.B. (2024). Scale-Dropout: Estimating uncertainty in deep neural networks using stochastic scale. arXiv Preprint. https://doi.org/10.48550/arxiv.2311.15816
[44] Carrete, J., Montes-Campos, H., Wanzenböck, R., Heid, E., Madsen, G.K.H. (2023). Deep ensembles vs committees for uncertainty estimation in neural-network force fields: Comparison and application to active learning. The Journal of Chemical Physics, 158(20): 204801. https://doi.org/10.1063/5.0146905
[45] Gawlikowski, J., Tassi, C.R.N., Ali, M., et al. (2023). A survey of uncertainty in deep neural networks. Artificial Intelligence Review, 56(Suppl 1): 1513-1589. https://doi.org/10.1007/s10462-023-10562-9
[46] Azevedo, T., de Jong, R., Mattina, M., Maji, P. (2020). Stochastic-yolo: Efficient probabilistic object detection under dataset shifts. arXiv preprint arXiv:2009.02967. https://doi.org/10.48550/arXiv.2009.02967
[47] Solovyev, R., Wang, W., Gabruseva, T. (2021). Weighted boxes fusion: Ensembling boxes from different object detection models. Image and Vision Computing, 107: 104117. https://doi.org/10.1016/j.imavis.2021.104117
[48] Zhong, J., Cheng, Q., Hu, X., Liu, Z. (2024). YOLO adaptive developments in complex natural environments for tiny object detection. Electronics, 13(13): 2525. https://doi.org/10.3390/electronics13132525
[49] Rekavandi, A., Farokhi, F., Ohrimenko, O., Rubinstein, B. (2024). Certified adversarial robustness via randomized α-smoothing for regression models. In Advances in Neural Information Processing Systems, 37: 134127-134150. https://doi.org/10.52202/079017-4263
[50] Son, S., Song, B.C. (2025). NMS-KSD: Efficient knowledge distillation for dense object detection via non-maximum suppression and feature storage. IEEE Access, 13: 80723-80736. https://doi.org/10.1109/ACCESS.2025.3567103
[51] Ghoshal, B., Tucker, A., Sanghera, B., Wong, W.L. (2021). Estimating uncertainty in deep learning for reporting confidence to clinicians in medical image segmentation and disease detection. Computational Intelligence, 37(2): 701-734. https://doi.org/10.1111/coin.12411
[52] Murrugarra-Llerena, J., Kirsten, L.N., Zeni, L.F., Jung, C.R. (2024). Probabilistic intersection-over-union for training and evaluation of oriented object detectors. IEEE Transactions on Image Processing, 33: 671-681. https://doi.org/10.1109/TIP.2023.3348697
[53] Kim, Y., Kim, S., Jeon, M. (2025). NBBOX: Noisy bounding box improves remote sensing object detection. IEEE Geoscience and Remote Sensing Letters, 22: 1-5. https://doi.org/10.1109/LGRS.2025.3527712
[54] Mohammed, S.A.K., Razak, M.Z.A., Rahman, A.H.A., Bakar, M.A. (2024). An efficient intersection over union algorithm for 3D object detection. IEEE Access, 12: 169768-169786. https://doi.org/10.1109/ACCESS.2024.3495761
[55] Wan, D., Lu, R., Xu, T., Shen, S., Lang, X., Ren, Z. (2023). Random interpolation resize: A free image data augmentation method for object detection in industry. Expert Systems with Applications, 228: 120355. https://doi.org/10.1016/j.eswa.2023.120355