Amina Mimouni | Taqiyeddine Moumene* | Mokhtaria Drissi | Mohamed Mahfoud | El-Habib Belarbi | Mohamed Kadari | Albert Nguyen Van Nhien | Serge Bresson
© 2026 The authors. This article is published by IIETA and is licensed under the CC BY 4.0 license (http://creativecommons.org/licenses/by/4.0/).
OPEN ACCESS
An imidazolium-based zwitterionic ionic liquid, 3-(1,3-diethyl-1H-imidazol-3-ium-4-yl) propanoate (ZIL2), was synthesized and investigated through complementary experimental and theoretical approaches. The physicochemical properties of ZIL2 were characterized by thermogravimetric and differential thermal analyses (TGA/DTA), ultraviolet-visible (UV-Vis) spectroscopy, and Fourier transform infrared (FTIR) spectroscopy to evaluate its thermal, optical, and vibrational behavior. The experimental results revealed that ZIL2 is thermally stable up to 231 ℃ and exhibits a melting temperature of 98.66 ℃. The experimental and theoretical optical band gaps were determined to be 5.64 and 5.65 eV, respectively, demonstrating excellent agreement between the experimental measurements and theoretical predictions. In parallel, density functional theory (DFT) calculations were performed at the B3LYP/6-311G(d, p) level, yielding a HOMO-LUMO energy gap of 3.68 eV, reflecting the electronic ground state properties of the system, in contrast to the optical excitation gap. Overall, the combined experimental and theoretical investigation provides a comprehensive understanding of the structural, optical, vibrational, and electronic properties of ZIL2 and demonstrates the usefulness of integrating spectroscopic techniques with quantum chemical calculations for the study of ZILs.
zwitterionic ionic liquid, thermogravimetric and differential thermal analyses, ultraviolet-visible, Fourier transform infrared, density functional theory, Gaussian 09
Due to their unique properties and diverse applications, ionic liquids (ILs) have generated significant attention in recent years. An IL is defined as an organic salt composed of a cation and an anion, with a low melting temperature below 100 ℃ [1]. These materials are widely recognized as a class of green solvents and electrolytes, offering significant advantages over conventional organic solvents owing to their negligible vapor pressure and environmentally friendly nature [2]. Unlike traditional solvents, ILs exhibit low volatility, high ionic conductivity, exceptional thermal stability, and tunable physicochemical properties [3, 4]. Recent studies have focused on the development of more sustainable ILs with improved environmental compatibility while maintaining their desirable properties, further expanding their scientific and technological interest [5, 6]. These exceptional attributes of ILs enable their use across multiple fields, including industry [7], medicinal chemistry [8], synthesis [9], catalysis [10], electrochemistry [11], biotechnology [12] and energy technologies [13]. Despite these advantages, ILs still present several limitations that restrict their use in certain applications. Some ILs, particularly those with long alkyl chains, can be toxic, which reduces their use in biopharmaceutical and biomedical applications [8, 14, 15]. Other ILs can show high resistance to biodegradation [16-18]. Also, ILs are typically derived from petroleum-based materials, which can increase their carbon footprint [19, 20].
In recent years, a new generation of ILs, known as zwitterionic ionic liquids (ZILs), has emerged as an attractive alternative to overcome the limitations of traditional ILs [21]. Unlike traditional ILs, in which the cation and anion exist as separate species, ZILs contain both charged groups covalently linked within the same molecule [15]. This structural arrangement gives rise to distinctive physicochemical properties, thereby expanding their potential applications [22].
In this investigation, a novel zwitterionic ionic liquid (ZIL2), namely 3-(1,3-diethyl-1H-imidazol-3-ium-4-yl) propanoate, was synthesized. To the best of our knowledge, this compound has not previously been investigated through a combined experimental and theoretical approach. A comprehensive physicochemical characterization was therefore carried out to explore its structural, thermal, vibrational, and optical properties. The thermal properties and decomposition profiles of the synthesized compound were investigated using thermogravimetric analysis (TGA) and differential thermal analysis (DTA).
The optical properties and electronic transitions were examined by ultraviolet-visible (UV-Vis) spectroscopy, allowing the estimation of the optical band gap. In addition, Fourier transform infrared (FTIR) spectroscopy was employed to identify and assign the different intramolecular vibrational modes of the molecule. To understand the physical properties of this compound at the quantum molecular level, Density Functional Theory (DFT) calculations were performed. This approach plays an important role in understanding the physicochemical properties of ILs [23]. In this work, quantum chemical calculations were carried out using the B3LYP functional with the 6-311G(d, p) basis set as implemented in the Gaussian 09 computational package. The electronic properties of the molecule were explored by analyzing frontier molecular orbitals (FMO) and the corresponding energy gap. The optical properties were studied using Time-Dependent Density Functional Theory (TD-DFT). Vibrational properties were then analyzed to identify the internal vibrational modes and to compare theoretical predictions with the experimental FTIR spectra.
By combining experimental characterization with theoretical molecular modeling, this work aims to provide a deeper understanding of the physicochemical properties of the synthesized ZIL2.
2.1 Materials and methods
2.1.1 Synthesis of ionic liquid 3-(1,3-diethyl-1H-imidazol-3-ium-4-yl)propanoate
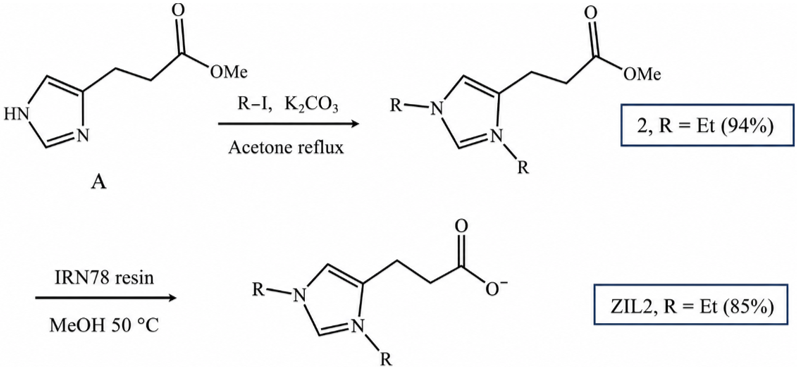
The zwitterionic ionic liquid 3-(1,3-diethyl-1H-imidazol-3-ium-4-yl)propanoate (ZIL2) was synthesized according to the procedure reported by Huet et al. [24]. Briefly, the corresponding iodide precursor was prepared from intermediate A, derived from commercially available bio-based urocanic acid (resulting from enzymatic deamination of the natural amino acid histidine), by N-alkylation in the presence of K2CO3 in refluxing acetone, affording the iodide intermediate with a yield of 94%. Subsequently, 4-(3-methoxy-3-oxopropyl)-1,3-diethlyl-1H-imidazol-3-ium iodide (8.80 g, 26.03 mmol) was treated with Amberlite IRN78 resin (OH- form, 53 g, resin/substrate ratio of 6:1) in methanol (44 mL) at 50 ℃, affording ZIL2 as a white solid (4.37 g, 85% yield). No chromatographic purification was required. The chemical structure and purity of the synthesized ZIL2 were confirmed by 1H and 13C NMR spectroscopy in Figures A1 and A2 (Appendix), in agreement with the reported literature data.
The synthetic route adopted for the preparation of ZIL2 is illustrated in Figure 1.
Figure 1. Synthesis of 3-(1,3-diethyl-1H-imidazol-3-ium-4-yl)propanoate (ZIL2). R = Et: ethyl, R-I: ethyl iodide, IRN78 resin: Amberlite IRN78 (OH- form)
2.1.2 Thermal measurements (thermogravimetric analysis/differential thermal analysis)
TGA and DTA were performed to investigate the thermal stability, decomposition behavior, and phase transitions of the synthesized ZIL2. TGA measurements were carried out from room temperature to 650 ℃, whereas DTA measurements were conducted over the temperature range of 50-400 ℃. Performed to monitor phase transitions of this IL between 50 and 400 ℃. Thermal analyses were performed using an initial sample mass of 21.8 mg, at a heating rate of 10 ℃ min-1 under a nitrogen atmosphere.
2.1.3 Ultraviolet-visible measurements
The UV-Vis absorption spectrum of ZIL2 was recorded using a SHIMADZU UV-1650 spectrophotometer. For the measurements, ZIL2 was dissolved in distilled water to obtain a homogeneous solution. The absorption spectra were recorded over the wavelength range of 200-800 nm at room temperature. The obtained data were used to determine the optical band gap of the IL.
2.1.4 Fourier transform infrared measurements
The ATR-FTIR spectrum of the synthesized compound was recorded using a Thermo Scientific Nicolet iN10 MX FT-IR microscope equipped with a ZnSe crystal. The spectrum was acquired over the spectral range of 3500-600 cm-1 with a resolution of 4 cm-1 by averaging 64 scans at room temperature. The obtained spectrum was used to identify and assign the characteristic vibrational bands of the investigated compound.
Quantum chemical calculations were performed to complement the experimental results and to gain deeper insight into the structural and electronic properties of the studied IL. All calculations were carried out using the Gaussian 09 software package [25-27]. The initial molecular structure was built, and the optimized geometry was visualized using GaussView 5 [25]. Geometry optimization was performed using the Becke three-parameter Lee-Yang-Parr (B3LYP) hybrid functional with the 6-311G (d, p) basis set [28, 29]. To investigate the stability and electronic properties of the studied ZIL, Mulliken atomic charges [30], FMO (HOMO and LUMO), and the corresponding HOMO-LUMO energy gap were determined [26]. Vibrational frequencies were calculated to assign the intramolecular vibrational modes and to support the interpretation of the experimental FTIR spectra. Time-dependent TD-DFT calculations were performed to simulate the electronic absorption spectrum for comparison with the experimental UV-Vis spectrum. In addition, dipole moment, molecular electrostatic potential (MEP), global reactivity descriptors, and thermodynamic parameters were calculated to further investigate the physicochemical properties of ZIL2.
4.1 Thermal measurement
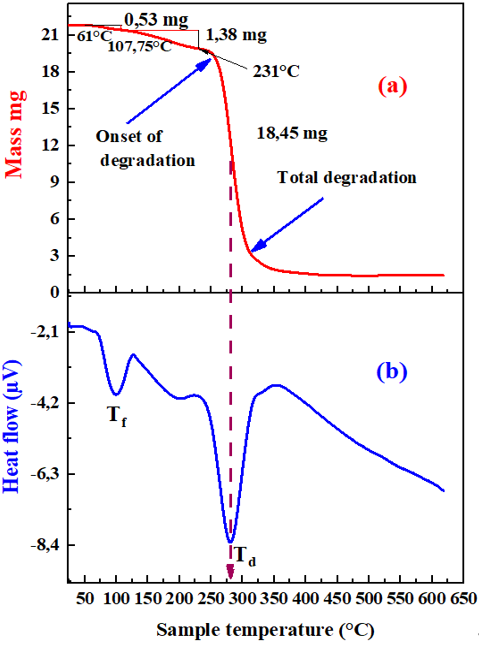
TGA was used to evaluate the thermal stability and decomposition behavior of ZIL2. As shown in Figure 2(a), the TGA thermogram indicates that ZIL2 is thermally stable up to 231 ℃. An initial mass loss of 0.53 mg (2.43% of initial mass) was observed at 61 ℃, which can be attributed to the evaporation of adsorbed moisture. An additional mass loss of 1.38 mg (6.33%) was observed at 107.75 ℃, which may be attributed to the removal of residual volatile species or to the early stages of thermal degradation. The cumulative mass loss before the main decomposition stage was 8.76%. A significant thermal degradation process began at approximately 225 ℃, as indicated by the onset of sharp mass loss in the TGA curve. Between 225 and 400 ℃, a rapid mass loss was recorded, corresponding to the principal decomposition stage of ZIL2.
Figure 2. Thermal analysis of ZIL2: (a) Thermogravimetric analysis (TGA) and (b) differential thermal analysis (DTA) curves of ZIL2 as a function of temperature
The DTA thermogram in Figure 2(b) exhibits two endothermic peaks. The first endothermic peak at 98.66 ℃ corresponds to the melting point of ZIL2. The second endothermic peak at 281.10 ℃ is assigned to its thermal decomposition. This thermal event is associated with the breakdown of the IL structure and agrees well with the major mass loss stage observed in the TGA curve, confirming the thermal decomposition of ZIL2. The high thermal stability of ZIL2 up to approximately 231 ℃ indicates that it can withstand moderate operating temperatures without significant thermal degradation. Furthermore, the well-defined melting transition at 98.66 ℃ indicates a clear phase behavior and is consistent with the good thermal characteristics of ZIL2.
4.2 Ultraviolet-visible analysis
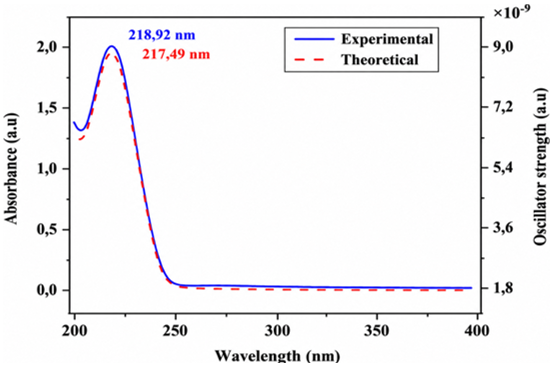
Electronic absorption corresponds to the transition of electrons from the ground state to one or more excited states, depending on the electronic structure of the molecule and the available energy levels [31]. Previous studies have shown that imidazolium-based ILs exhibit strong absorption in the UV region [32], which is consistent with the UV-Vis spectrum obtained for ZIL2. The absorbance spectrum presented in Figure 3 shows that ZIL2 absorbs below 250 nm, with a maximum absorbance of 1.97 at 218.92 nm.
The broad absorption band observed in the UV region can be attributed to π-π* electronic transition associated with the conjugated C=C group of ZIL2.
To better understand the electronic transitions of ZIL2, the theoretical UV-Vis spectrum was calculated using the TD-DFT method implemented in Gaussian 09. The calculated maximum absorption wavelength was 217.49 nm, which is in good agreement with the experimental value of 218.92 nm, corresponding to an oscillator strength of 9 109 a.u.
Figure 3. Experimental and theoretical ultraviolet-visible (UV-Vis) absorption spectra of ZIL2
The optical band gap of ZIL2 was estimated from the experimental and theoretical UV-Vis spectra using the corresponding energy relation (Eq. (1))
E=hν (1)
where, E is the photon energy (J), h is Planck’s constant (6.62.10-34 J.s), and ν is the frequency (s-1).
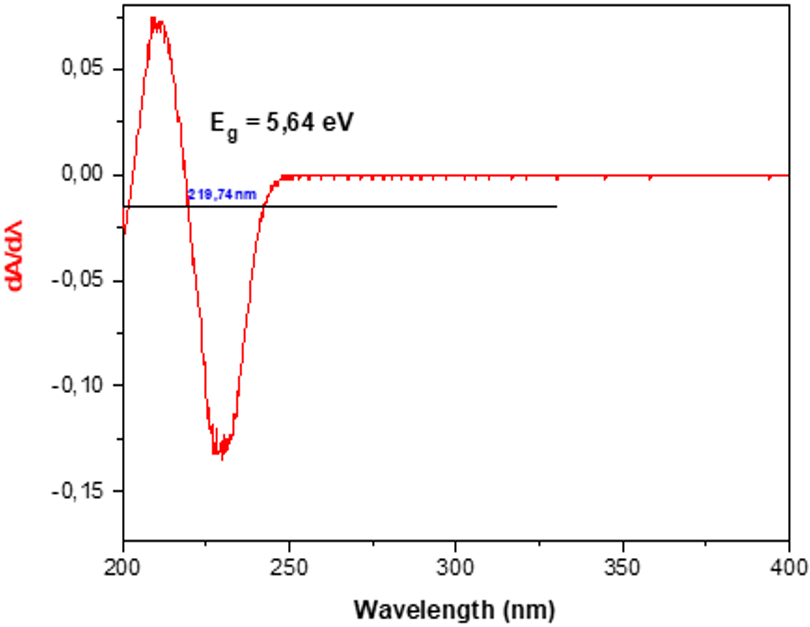
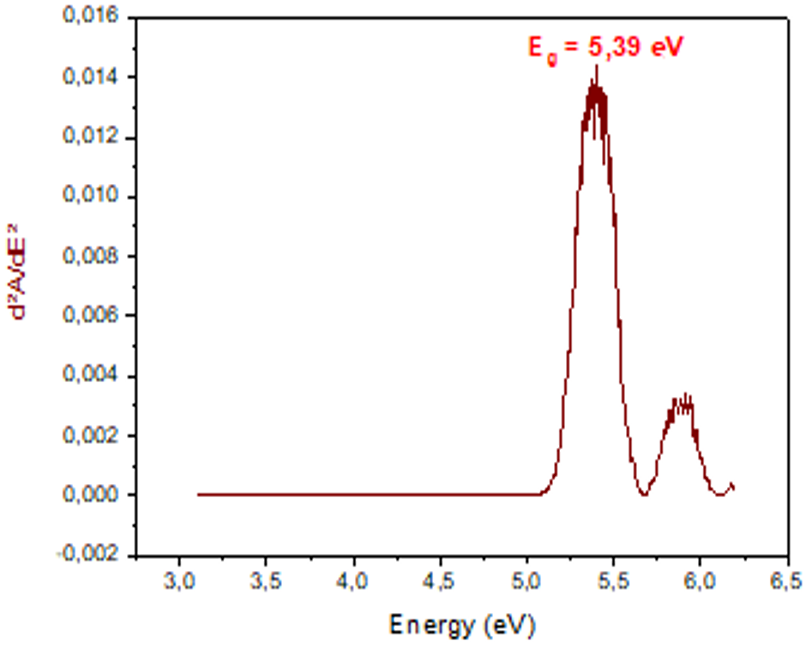
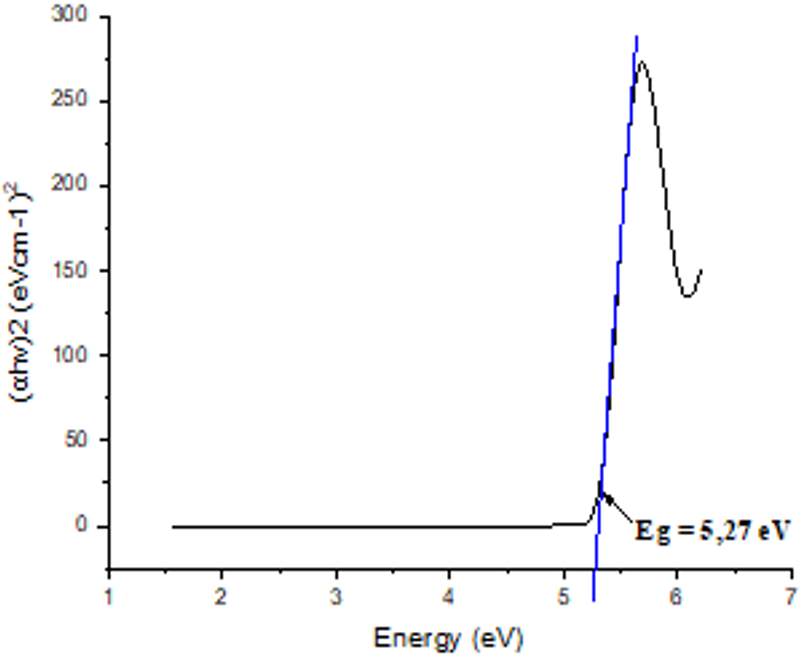
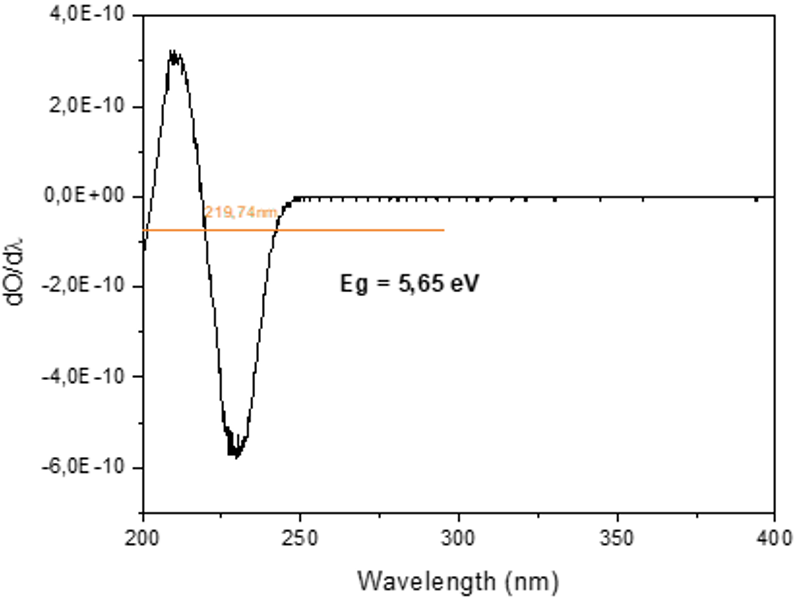
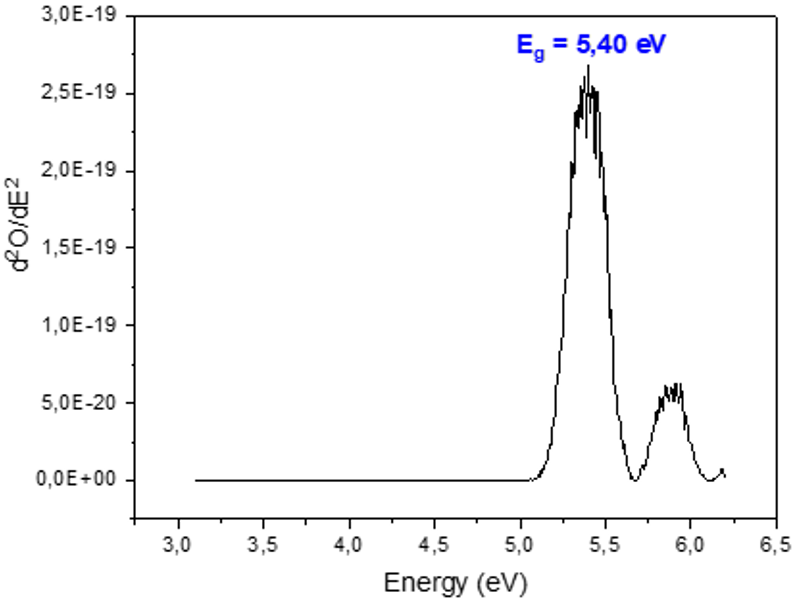
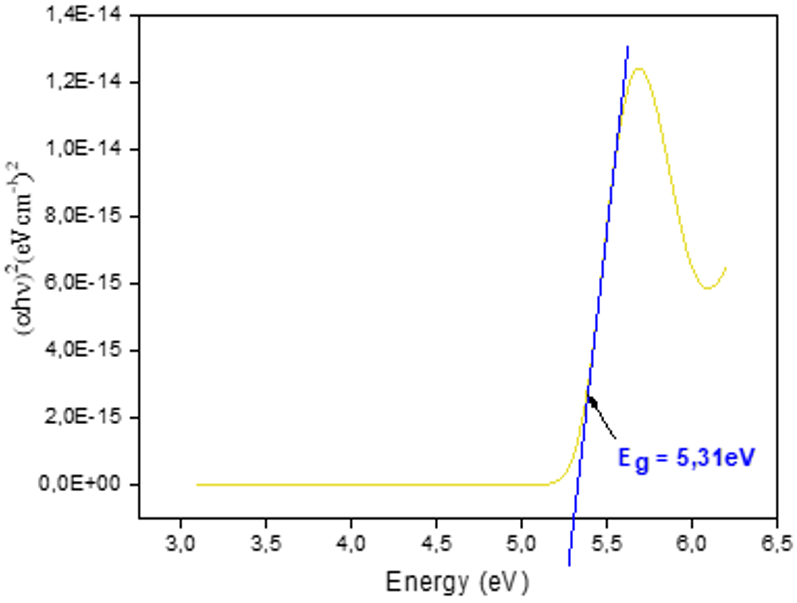
To improve the reliability of the optical band gap determination, three different approaches, namely the first derivative method, the second derivative method, and the Tauc plot, were applied to both the experimental and theoretical spectra. The corresponding plots are presented in Figures A3-A8 (Appendix), while the obtained optical band gap values are summarized in Table 1.
Table 1. Experimental and theoretical optical gap values
|
Methods |
Experimental |
Theoretical |
|
First derivative |
Eg = 5.64 eV |
Eg = 5.65 eV |
|
Second derivative |
Eg = 5.39 eV |
Eg = 5.40 eV |
|
Tauc plot |
Eg = 5.27 eV |
Eg = 5.31 eV |
The experimental and theoretical optical band gap values of 5.64 eV and 5.65 eV, respectively, are in good agreement, indicating that the TD-DFT calculations successfully reproduce the optical behavior of ZIL2. This agreement confirms the reliability of the theoretical approach for investigating the optical properties of the synthesized IL.
4.3 Vibrational analysis
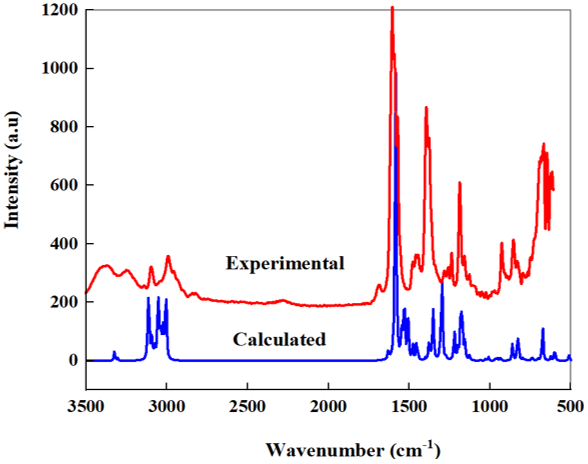
The vibrational analysis aimed to identify and assign the characteristic vibration modes of ZIL2. DFT frequency calculations were performed using Gaussian 09 at the same level of theory employed for geometry optimization. The optimized structure of ZIL2 contains 30 atoms, corresponding to 84 normal vibrational modes (3N-6). These modes were assigned using potential energy distribution (PED) analysis implemented in the VEDA program [33]. A scaling factor of 0.967 was applied to the calculated DFT/6-311G (d, p) [12] vibrational frequencies to improve their agreement with the experimental values. The good agreement between the calculated and experimental frequencies supports the reliability of the optimized structure of ZIL2. A comparison between the experimental and calculated vibrational spectra is presented in Figure 4, while the corresponding vibrational frequencies are provided in Table 2.
Figure 4. Experimental and calculated IR spectrum of (3-(1,3-diethyl-1H-imidazol- 3-ium-4-yl)propanoate in spectral area 3500-600 cm-1
Table 2. Calculated (B3LYP/6–311G(d, p)) and experimental Fourier transform infrared (FTIR) vibrational frequencies (cm-1) of ZIL2
|
N° |
FTIR |
B3LYP/6-311G(d, p) |
Assignments with Potential Energy Distribution (PED) > 10% |
||
|
Unscaled |
Scaled |
IR |
|||
|
81 |
|
3393.50 |
3281.51 |
11.41 |
ν CH (100) |
|
80 |
- |
3373.40 |
3262.07 |
3.79 |
ν CH (100) |
|
79 |
- |
3193.06 |
3087.69 |
8.29 |
νasy CH (100) |
|
78 |
- |
3190.40 |
3085.11 |
12.16 |
νasy CH (100) |
|
77 |
- |
3184.48 |
3079.39 |
24.50 |
νasy CH (100) |
|
76 |
- |
3181.18 |
3076.20 |
29.77 |
νasy CH (100) |
|
75 |
- |
3168.00 |
3063.45 |
9.13 |
νasy CH (100) |
|
74 |
- |
3166.09 |
3061.60 |
8.38 |
νasy CH (100) |
|
73 |
- |
3162.53 |
3058.16 |
5.90 |
νasy CH (100) |
|
72 |
- |
3147.50 |
3043.63 |
17.26 |
νasy CH (100) |
|
71 |
- |
3123.38 |
3020.30 |
32.60 |
νasy CH (100) |
|
70 |
- |
3114.44 |
3011.66 |
47.39 |
ν CH (100) |
|
69 |
|
3103.15 |
3000.74 |
20.72 |
ν CH (100) |
|
68 |
3090 |
3092.92 |
2990.85 |
26.56 |
ν CH (100) |
|
67 |
- |
3086.58 |
2984.72 |
12.50 |
ν CH (100) |
|
66 |
- |
3072.93 |
2971.52 |
94.00 |
ν CH (100) |
|
65 |
- |
1653.43 |
1598.86 |
12.56 |
ν CC (75) + δ HCH (25) |
|
64 |
- |
1636.28 |
1582.28 |
267.25 |
ν OC (85) + δ HCH (15) |
|
63 |
1597 |
1598.02 |
1545.28 |
87.53 |
ν OC (47) + δ NCN (25) + τ HCCN (8) |
|
62 |
1557 |
1548.22 |
1497.12 |
4.47 |
δ NCN (75) + τ HCCC (25) |
|
61 |
|
1546.31 |
1495.28 |
18.90 |
δ HCH (80) + τ HCCC (20) |
|
60 |
- |
1540.63 |
1489.78 |
6.46 |
δ HCH (78) + τ HCCC (21) |
|
59 |
- |
1538.08 |
1487.32 |
5.36 |
δ HCH (81) + τ HCCC (19) |
|
58 |
- |
1532.98 |
1482.39 |
15.41 |
ν CC (4) + δ HCH (75) +τ HCCN (10) |
|
57 |
- |
1530.49 |
1479.98 |
38.23 |
δ HCH (95) |
|
56 |
- |
1514.58 |
1464.59 |
8.67 |
δ HCH (84) + τ HCCC (15) |
|
55 |
- |
1511.38 |
1461.50 |
22.63 |
ν NC (5) + δ HCH (75) +τ HCCC (20) |
|
54 |
- |
1485.17 |
1436.15 |
4.15 |
ν NC (42) + δ HCH (35) +τ HCCC (23) |
|
53 |
1471 |
1479.66 |
1430.83 |
10.80 |
δ HCH (93) |
|
52 |
- |
1456.39 |
1408.32 |
8.91 |
δ HCH (99) |
|
51 |
1452 |
1450.04 |
1402.18 |
9.05 |
ν CN (18) + δ HCC (69) +τ HCNC (13) |
|
50 |
- |
1400.39 |
1354.17 |
2.08 |
ν CN (36) + δ NCN (38) +τ HCCN (26) |
|
49 |
1370 |
1379.39 |
1333.87 |
21.42 |
ν CN (23) + δ HCH (41) +τ HCCN (36) |
|
48 |
|
1358.68 |
1313.84 |
47.11 |
δ HCC (62) +τ HCNC (37) |
|
47 |
- |
1353.70 |
1309.02 |
45.33 |
δ HCC (43) +τ HCNC (56) |
|
46 |
- |
1316.52 |
1273.07 |
70.66 |
ν CO (95) |
|
45 |
1309 |
1310.06 |
1266.82 |
5.85 |
ν OC (9) + δ HCC (41) +τ HCCO (50) |
|
44 |
- |
1291.91 |
1249.27 |
0.32 |
δ HCH (62) +τ HCNC (38) |
|
43 |
1276 |
1272.49 |
1230.49 |
3.29 |
δ HCH (68) +τ HCNC (32) |
|
42 |
1229 |
1220.21 |
1179.94 |
28.31 |
ν NC (23) + δ HCC (77) |
|
41 |
- |
1192.35 |
1153.00 |
14.19 |
δ HCC (35) + τ CCCN (65) |
|
40 |
1180 |
1183.50 |
1144.44 |
27.09 |
δ HCN (57) + τ HCCO (43) |
|
39 |
|
1172.74 |
1134.03 |
65.97 |
ν NC (41) + δ CCN (44) +τ HCCC (14) |
|
38 |
- |
1159.55 |
1121.28 |
2.65 |
ν CC (17) + δ HCC (46)+τ HCCO(37) |
|
37 |
1151 |
1152.39 |
1114.36 |
15.22 |
δ HCC (47) + τ HCNC (53) |
|
36 |
- |
1127.76 |
1090.54 |
4.73 |
ν CN (24) + δ CCN (34) +τ HCCN (42) |
|
35 |
1120 |
1123.53 |
1086.45 |
1.64 |
ν CN (32) + δ HCC (27) +τ HCCO (41) |
|
34 |
1062 |
1067.84 |
1032.60 |
0.49 |
ν NC (60) + δ CNC (37) |
|
33 |
|
1030.62 |
996.60 |
0.65 |
ν CC (31) + δ HCC (33) +τ HCCC (36) |
|
32 |
1017 |
1014.66 |
981.17 |
4.56 |
ν CC (39) + δ HCC (28) +τ HCCC (34) |
|
31 |
- |
975.24 |
943.05 |
1.60 |
ν CC (74) + δ CNC (26) |
|
30 |
- |
964.13 |
932.31 |
4.29 |
ν CC (84) |
|
29 |
- |
935.17 |
904.30 |
5.07 |
ν CC (21) + δ CCC (36) + τ OCOC (43) |
|
28 |
847 |
846.07 |
818.14 |
15.20 |
τ HCNC (85) |
|
27 |
- |
833.48 |
805.97 |
20.73 |
ν CC (64) + δ OCO (36) |
|
26 |
823 |
818.33 |
791.32 |
2.68 |
τ HCCN (89) |
|
25 |
- |
812.97 |
786.14 |
11.24 |
τ HCCC (94) |
|
24 |
789 |
783.97 |
758.09 |
2.52 |
ν CC (38) + δ CNC (29) + τ HCNC (33) |
|
23 |
- |
776.85 |
751.21 |
1.72 |
τ HCNC (98) |
|
22 |
- |
734.86 |
710.60 |
3.50 |
τ OCOC (90) |
|
21 |
- |
692.80 |
669.93 |
0.96 |
τ CCNC (87) |
|
20 |
667 |
669.73 |
647.62 |
39.51 |
τ CCNC (98) |
|
19 |
- |
624.18 |
603.58 |
4.44 |
ν CC (37) + δ CCN (39) + τ HCCC (23) |
|
18 |
607 |
602.92 |
583.02 |
11.29 |
ν CC (45) + δ ONO (55) |
|
17 |
- |
595.37 |
575.72 |
1.17 |
ν CN (60) + δ NCN (40) |
|
16 |
- |
504.24 |
487.60 |
6.90 |
δ CCC (66) + τ HCCC (24) |
|
15 |
- |
469.62 |
454.12 |
6.26 |
δ CCN (33) + τ CNCN (58) |
|
14 |
- |
419.02 |
405.19 |
1.41 |
δ OCC (76) + τ HCCO (23) |
|
13 |
- |
367.84 |
355.70 |
4.39 |
δ CCN (59) + τ CCNC (41) |
|
12 |
- |
364.44 |
352.41 |
0.80 |
δ CCN (93) |
|
11 |
- |
287.27 |
277.79 |
4.25 |
τ CCCN(99) |
|
10 |
- |
270.97 |
262.02 |
11.56 |
δ CCC (50) + τ HCCC (50) |
|
9 |
- |
237.80 |
229.95 |
12.41 |
δ CCC (90) |
|
8 |
- |
196.37 |
189.88 |
2.91 |
δ CNC (90) |
|
7 |
- |
183.36 |
177.30 |
14.66 |
τ CCCN(75) |
|
6 |
- |
154.84 |
149.73 |
2.61 |
τ OCOC(81) |
|
5 |
- |
123.13 |
119.06 |
1.24 |
τ CCCN(74) |
|
4 |
- |
85.33 |
82.51 |
4.91 |
τ CNCC(76) |
|
3 |
- |
70.13 |
67.81 |
1.87 |
τ OCCC(76) |
|
2 |
- |
63.93 |
61.82 |
12.69 |
τ CCCC(81) |
|
1 |
- |
22.90 |
22.14 |
8.85 |
τ CCCC(92) |
C–H vibrations
According to the literature, the bands observed between 2800 and 3000 cm-1 are assigned to the symmetric C-H stretching vibrations of the methyl and/or alkyl groups attached to the imidazolium ring [34, 35], whereas those between 3000 and 3200 cm-1 correspond to C-H stretching vibrations of the imidazolium ring [36, 37]. In the present study, the calculated symmetric and asymmetric C-H stretching vibrations of ZIL2 occur in the range of 3393.50- 3072.93 cm-1 with a PED contribution of 100% at the B3LYP/6–311G level of theory, while the corresponding experimental bands are observed at 3090 cm-1. The calculated CH2 bending vibrations are located between 1479.66 cm-1 and 1272.49 cm-1, in good agreement with the experimental bands observed between 1471 cm-1 and 1276 cm-1.
C–C and C=C vibrations
The C-C stretching vibrations are generally observed in the 1650-1400 cm-1 region [37], whereas the C=C stretching vibrations occur between 1560 and 1670 cm−1 [38]. For ZIL2, the calculated ν(C-C) and ν(C=C) vibrations occur at 1532.98 and 1653.43 cm-1, respectively. Additional C-C stretching vibrations are predicted in the 935.17-1030.62 cm-1 region, corresponding to the experimental band at 1017 cm-1 in the FTIR spectrum.
C ̶ N and C=N vibrations
The C-N stretching vibrations are typically found in the 1511-1067 cm-1 region. For ZIL2, experimental ν(C-N) vibrations are observed at 1062, 1120, 1229, 1370 and1452 cm-1, whereas the corresponding calculated frequencies are at 1067.84, 1123.53, 1220.21, 1379.39 and1450.04 cm-1, showing good agreement between the experimental and theoretical results. The C=N stretching vibration is commonly reported around 1555 cm–1 [33]. Experimentally, this band is observed at 1557 cm-1, whereas DFT calculations predict frequencies at 1548.22 cm-1.
C–O and C=O vibrations
The C=O stretching vibration is generally found in the 1600–1800 cm-1 region [39, 40]. Experimentally, the ν(C=O) band appears at 1597 cm-1, whereas the corresponding calculated frequencies are at 1636.28 and 1598.02 cm-1. The calculated ν(C-O) vibrations are found at 1316.50 and 1310.06 cm-1, matching the experimental band at 1309 cm-1.
Overall, the vibrational analysis of ZIL2 confirms the successful assignment of the main functional groups, including C–H, C–C/C=C, C–N/C=N, and C–O/C=O vibrations. The good agreement between the calculated and experimental FTIR frequencies supports the reliability of the DFT calculations and confirms the proposed molecular structure of ZIL2.
Table 2 summarizes the calculated harmonic vibrational frequencies, the experimental FTIR wavenumbers, and the corresponding vibrational assignments of ZIL2.
The vibrational assignments were performed using the PED. All calculated frequencies are scaled values expressed in cm-1.
4.4 Structure description
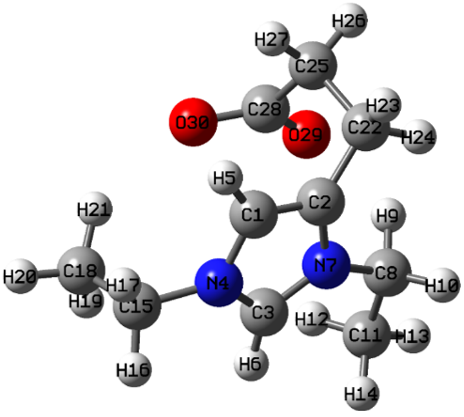
A preliminary conformational analysis of 3-(1,3-diethyl-1H-imidazol-3-ium-4-yl)propanoate (ZIL2) was performed using DFT calculations at the B3LYP/6-311G(d, p) level of theory, which has been widely employed for the investigation of ILs [41]. The optimized molecular structure is presented in Figure 5. The most stable geometry corresponds to a minimum total energy of -650.59467090 a.u., -17696, 1750 eV. This conformation provides detailed information on the molecular geometry, including bond angles, torsional angles, and atomic charges, which form the basis for the subsequent investigation of the physicochemical properties of ZIL2.
Figure 5. Density Functional Theory (DFT) optimized molecular structure of ZIL2
Table 3. Optimized geometric parameters of ZIL2
|
Bond Length |
Ǻ |
Bond Angle(α) |
Degree (°) |
Dihedral Angle (δ) |
Degree (°) |
|
r (C1=C2) |
1.3680 |
|
|
|
|
|
r (C3-N4) |
1.3472 |
α (C3-C1-C2) |
72.976 |
|
|
|
r (C1-H5) |
1.0717 |
α (C1-C3-N4) |
36.470 |
δ(N4-C3-C1-C2) |
-179.397 |
|
r (C3-H6) |
1.0703 |
α (H5-C1-C2) |
129.713 |
δ(H5-C1-C2-C3) |
-172.791 |
|
r (C3=N7) |
1.3444 |
α (H6-C3-C1) |
161.674 |
δ(H6-C3-C1-C2) |
-174.254 |
|
r (N7-C8) |
1.4904 |
α (N7-C3-C1) |
72.239 |
δ(N7-C3-C1-C2) |
0.644 |
|
r (C8-H9) |
1.0922 |
α (C8- N7-C3) |
125.943 |
δ(C8-N7-C3-C1) |
-174.575 |
|
r (C8-H10) |
1.0908 |
α (H9-C8-N7) |
104.617 |
δ(H9-C8-N7-C3) |
125.801 |
|
r (C8-C11) |
1.5233 |
α (H10-C8-N7) |
107.661 |
δ(H10-C8-N7-C3) |
-115.69 |
|
r (C11-H12) |
1.0899 |
α (C11-C8-N7) |
112.809 |
δ(C11-C8-N7-C3) |
8.018 |
|
r (C11-H13) |
1.0899 |
α ( H12-C11-C18) |
110.122 |
δ(H12-C11-C8-N7) |
61.771 |
|
r (C11-H14) |
1.0929 |
α ( H13-C11-C18) |
108.370 |
δ(H13-C11-C8-N7) |
178.837 |
|
r (N4-C15) |
1.4805 |
α ( H14-C11-C18) |
113.470 |
δ(H14-C11-C8-N7) |
-62.076 |
|
r (C15-H16) |
1.090 |
α (C15-N4-C3) |
125.438 |
δ(C15-N4-C3-C1) |
164.792 |
|
r (C15-H17) |
1.0888 |
α ( H16-C15-N4) |
108.158 |
δ(H16-C15-N4-C3) |
48.3130 |
|
r (C15-C18) |
1.5347 |
α ( H17-C15-N4) |
106.502 |
δ(H17-C15-N4-C3) |
163.574 |
|
r (C18-H19) |
1.0904 |
α (C18-C15-N4) |
110.732 |
δ(C18-C15-N4-C3) |
-75.016 |
|
r (C18-H20) |
1.0911 |
α (H19-C18-C15) |
110.938 |
δ(H19-C18-C15-N4) |
73.575 |
|
r (C18-H21) |
1.0906 |
α (H20-C18-C15) |
109.915 |
δ(H20-C18-C15-N4) |
-166.69 |
|
r (C2-C22) |
1.4992 |
α (H21-C18-C15) |
110.907 |
δ(H21-C18-C15-N4) |
-44.877 |
|
r (C22-H23) |
1.0918 |
α (C22-C2-C1) |
127.923 |
δ(C22-C2-C1-N4) |
161.486 |
|
r (C22-H24) |
1.0882 |
α (H23-C22-C2) |
110.474 |
δ(H23-C22-C2-C1) |
57.419 |
|
r (C22-C25) |
1.5667 |
α (H24-C22-C2) |
110.317 |
δ(H24-C22-C2-C1) |
175.675 |
|
r (C25-H26) |
1.0903 |
α (C25-C22-C2) |
108.445 |
δ(C25-C22-C2-C1) |
-64.296 |
|
r (C25-H27) |
1.0897 |
α (H26-C25-C22) |
108.962 |
δ(H26-C25-C22-C2) |
-159.089 |
|
r (C25-C28) |
1.5507 |
α (H27-C25-C22) |
109.893 |
δ(H27-C25-C22-C2) |
81.094 |
|
r (C28=O29) |
1.2878 |
α (C28-C25-C22) |
108.573 |
δ(C28-C25-C22-C2) |
-38.346 |
|
r (C28-O30) |
1.2799 |
α (O29-O28-C25) |
115.107 |
δ(O29-C28-C25-C22) |
-68.707 |
The geometric parameters of ZIL2, including bond lengths, bond angles, and dihedral angles, are summarized in Table 3. The imidazolium ring is characterized by the C3=N7 and C3-N4 bonds with bond lengths 1.3444 and 1.3472 Ǻ, respectively, while the C1=C2 bond measures 1.3680 Ǻ. The C-C bonds in the alkyl chains range from 1.49 to 1.56 Ǻ, whereas the C-H bond lengths are close to 1.09 Ǻ. Furthermore, the C28=O29 and C28-O30 bond lengths are 1.2878 and 1.2799 Ǻ, respectively. Overall, the calculated geometric parameters are in good agreement with previously reported data for similar ILs [42].
The bond angles of the imidazolium ring, namely α(C3-C1-C2), α(N7-C3-C1), and α(C1-C3-N4), are 72.97°, 72.23°, and 36.47°, respectively. Among all the optimized bond angles, α(C1-C3-N4) is the smallest (36.47°), whereas α(H6-C3-C1) is the largest (161.67°). These values reflect the optimized molecular geometry of ZIL2 and provide additional structural information for the subsequent theoretical analysis.
The molecular planarity can be evaluated from the dihedral angles, which provide valuable information about the three-dimensional conformation of ZIL2. The calculated dihedral angles exhibit different values, indicating that the atoms are not coplanar and that the molecule adopts a non-planar geometry.
4.5 Atomic charges and molecular dipole moment
The analysis of atomic charge distribution is essential for understanding the electronic properties and chemical reactivity of ZIL2. In this study, the Mulliken population analysis method [31] was employed to calculate the atomic charges of the optimized structure, and the results are summarized in Table 4. The obtained charge distribution provides useful information for interpreting the electronic properties and molecular dipole moment of ZIL2 [36, 37].
The calculated atomic charges reveal the distribution of electron density within ZIL2, allowing the identification of electron-rich and electron-deficient regions that may influence its chemical reactivity and intramolecular charge transfer [30, 37].
Table 4. Mulliken atomic charges of the ZIL2 calculated at DFT/6-311G(d, p)
|
Atom |
Charge |
Atom |
Charge |
|
C1 |
0.114 |
H16 |
0.200 |
|
C2 |
0.308 |
H17 |
0.203 |
|
C3 |
0.446 |
C18 |
-0.505 |
|
N4 |
-0.587 |
H19 |
0.182 |
|
H5 |
0.223 |
H20 |
0.180 |
|
H6 |
0.247 |
H21 |
0.268 |
|
N7 |
-0.653 |
C22 |
-0.433 |
|
C8 |
-0.152 |
H23 |
0.192 |
|
H9 |
0.290 |
H24 |
0.200 |
|
H10 |
0.194 |
C25 |
-0.387 |
|
C11 |
-0.590 |
H26 |
0.179 |
|
H12 |
0.226 |
H27 |
0.159 |
|
H13 |
0.204 |
C28 |
0.439 |
|
H14 |
0.165 |
O29 |
-0.546 |
|
C15 |
-0.230 |
O30 |
-0.536 |
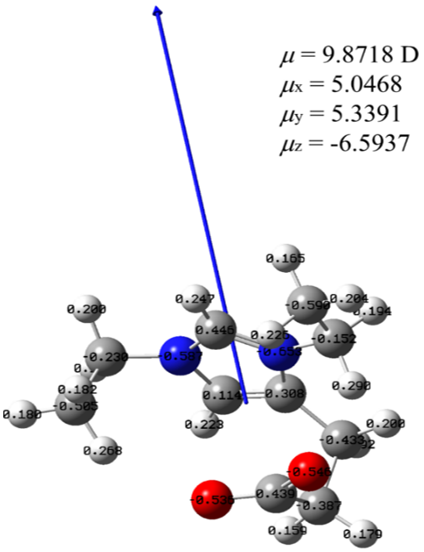
The Mulliken population analysis reveals a non-uniform charge distribution within the ZIL2 molecule. The most negative atomic charges are located on the nitrogen atoms N7 (-0.653 a.u.) and N4 (-0.587 a.u.), as well as on the oxygen atoms O29 (-0.549 a.u.) and O30 (-0.536 a.u.), reflecting their high electronegativity and electron-accepting character. In contrast, atom C28 exhibits a relatively positive charge (+0.439 a.u.), which can be attributed to its bonding with the two oxygen atoms of the carboxylate group. Most hydrogen atoms carry positive charges, whereas several carbon atoms, including C11, C22, and C25, are negatively charged due to electron density redistribution within the molecular framework. Overall, the calculated charge distribution indicates a pronounced electronic polarization, which may favor intermolecular electrostatic interactions and influence the chemical reactivity of ZIL2.
Figure 6 illustrates the dipole moment vector of ZIL2 together with its molecular charge distribution. The orientation of the dipole moment is consistent with the Mulliken charge analysis, showing the accumulation of negative charges on the oxygen and nitrogen atoms, whereas the hydrogen atoms carry positive charges. The calculated dipole moment of ZIL2 is 9.8718 D, indicating a highly polar molecule with pronounced separation of charge. Such a high dipole moment is expected to enhance intermolecular electrostatic interactions and may contribute to the physicochemical properties of ZIL2.
Figure 6. Dipole moment vector and molecular charge distribution of ZIL2
4.6 Electronic properties
4.6.1 Frontier Molecular Orbitals analysis
FMO analysis provides valuable insight into the electronic structure and charge-transfer characteristics of molecules [43]. The highest occupied molecular orbital (HOMO) acts as an electron donor, whereas the lowest unoccupied molecular orbital (LUMO) acts as an electron acceptor [36]. The energy difference between these orbitals, known as the HOMO-LUMO energy gap Eg (ΔE = ELUMO-EHOMO), is an important parameter for evaluating molecular stability, chemical reactivity, optical properties, and the hardness and softness of a molecule [28, 37, 42].
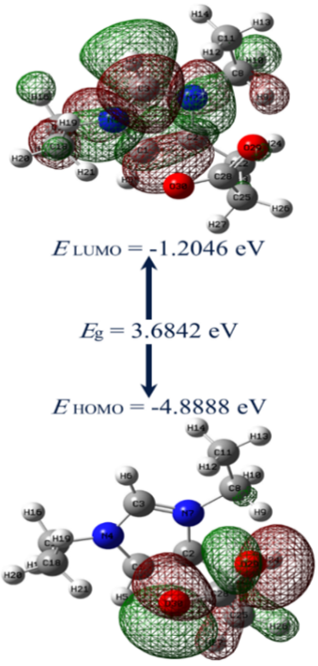
Figure 7. Frontier molecular orbitals (HOMO and LUMO) of ZIL2
The HOMO and LUMO energies, with the HOMO-LUMO energy gap of ZIL2, were calculated at the DFT/B3LYP/6-311G(d, p) level of theory. Figure 7 illustrates the three-dimensional distributions of the molecular frontier orbitals. The green and red colors represent the positive and negative phases of the molecular wave function, respectively. The HOMO is mainly located on the carboxylate group, whereas the LUMO is predominantly distributed over the imidazolium ring. This spatial separation suggests an intermolecular charge transfer from the carboxylate moiety toward the imidazolium ring, which may contribute to the electronic properties and chemical reactivity of ZIL2.
The calculated HOMO-LUMO energy gap of ZIL2 is 3.6842 eV, suggesting moderate semiconducting characteristics and moderate chemical reactivity. This behavior results from the relatively easy excitation of electrons from the HOMO to the LUMO under external perturbations, thereby facilitating interactions with other chemical species. Such an energy gap generally reflects a balance between molecular stability and chemical reactivity [34, 44], indicating that ZIL2 possesses adequate electronic stability while maintaining an appreciable reactive character. Furthermore, the spatial separation between the HOMO and LUMO orbitals supports the occurrence of intramolecular charge transfer, which contributes to the electronic properties of ZIL2.
4.6.2 Density of states
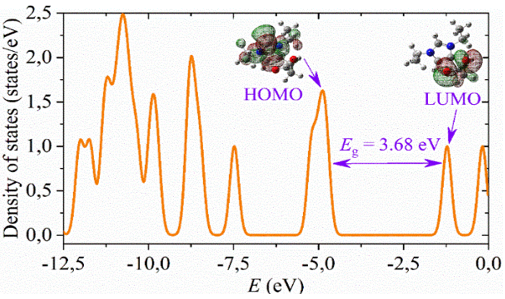
The density of states (DOS) is widely used to describe the electronic structure of molecular systems [45]. To support the frontier molecular orbital, the total DOS spectrum of ZIL2 was calculated at the DFT/B3LYP/6-311 G (d, p) level of theory using the GaussSum program [46]. Figure 8 illustrates the DOS spectrum, which confirms the HOMO-LUMO energy gap of 3.6842 eV obtained from the FMO analysis. The clear separation between the occupied and unoccupied electronic states indicates the electronic stability of ZIL2. Furthermore, the DOS profile is consistent with the HOMO and LUMO distributions, supporting the occurrence of intramolecular charge transfer within the molecule.
Figure 8. Total density of states (DOS) of ZIL2
4.6.3 Global reactivity descriptors
Global reactivity descriptors provide valuable insight into the stability and electronic behavior of molecules [47]. These descriptors include chemical hardness (η), chemical softness (S), the electrophilicity index (ω), chemical potential (µ), and electronegativity (χ) [48]. Both chemical hardness and softness are used to describe how easily the electronic density of a molecule can deform or polarize when interacting with another molecule. The electrophilicity index is used to measure the electrophilic character of molecules. The chemical potential reflects the tendency of electrons to escape from a system and is associated with its electron-donating ability [37]. Electronegativity describes the ability of an atom to attract shared electrons in a covalent bond [25]. These descriptors provide useful information about the overall stability and chemical properties of a molecule.
Using Koopman’s theorem, these descriptors were calculated at the B3LYP/6-311G(d, p) level of theory [49]. The corresponding equations and calculated values are presented in Table 5.
The relatively low softness and high hardness values suggest that ZIL2 possesses good chemical stability.
Ionization potential: IP = - EHOMO (2)
Electron affinity: EA = - ELUMO (3)
Electronegativity: χ = -1/2 (EHOMO + ELUMO) (4)
Chemical potential: μ = 1/2 (ELUMO + EHOMO) (5)
Global hardness: η = 1/2 (ELUMO – EHOMO) (6)
Overall softness: S = 1 /2η (7)
Electrophilicity: ω = μ2 /2η (8)
Table 5. Global reactivity descriptors of ZIL2
|
Reactivity Index |
Value (eV) |
|
HOMO energy |
-4.88884 |
|
LUMO energy |
-1.20464 |
|
Ionization potential |
4.88884 |
|
Electron affinity |
1.20464 |
|
Electronegativity |
3.04674 |
|
Chemical potential |
-3.04674 |
|
Global hardness |
1.8421 |
|
Overall softness |
0.27592 |
|
Electrophilicity |
2.561289 |
As summarized in Table 5, the calculated global reactivity descriptors confirm the electronic characteristics of ZIL2. The ionization potential (4.88884 eV) indicates that the molecule requires a moderate amount of energy to remove an electron, whereas the electron affinity (1.20464 eV) reflects its ability to accept electrons. The electronegativity (3.04674 eV) and chemical potential (-3.04674 eV) suggest a balanced electron-donating and electron-accepting capability. Furthermore, the relatively high hardness (1.8421 eV) and low softness (0.27592 eV) indicate good chemical stability. The calculated electrophilicity index (2.561289 eV) also suggests that ZIL2 possesses a moderate electrophilic character.
4.6.4 Molecular electrostatic potential
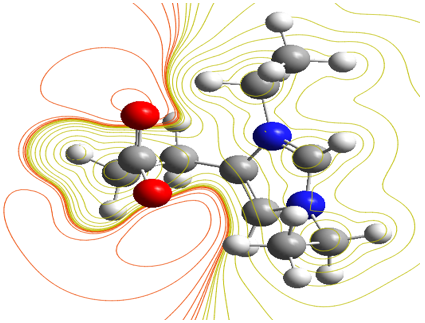
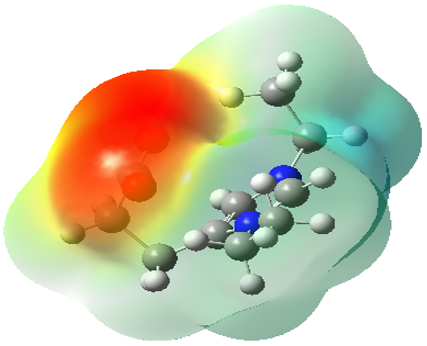
The MEP is a valuable tool for predicting the reactive sites of a molecule. It provides information about the distribution of electrostatic potential over the molecular surface, allowing the identification of electrophilic and nucleophilic regions as well as potential hydrogen-bonding sites [49]. The three-dimensional (3D) MEP map offers a visual representation of the charge distribution, facilitating the interpretation of intramolecular interactions and molecular reactivity [30, 31]. In the MEP map, the blue region corresponds to the most positive electrostatic potential, indicating electron-deficient sites that are susceptible to nucleophilic attack, whereas the green region represents areas of nearly neutral electrostatic potential [39, 50].
Figure 9. MEP of ZIL2 (2D)
Figure 10. MEP of ZIL2 (3D)
The MEP maps of ZIL2 are illustrated in Figures 9 and 10. The electrostatic potential ranges from -0.108 a.u. (deep red) to +0.108 a.u. (deep blue). Regions of negative electrostatic potential (red and yellow) correspond to electron-rich areas and represent the preferred sites for electrophilic attack. In contrast, regions of positive electrostatic potential (blue) correspond to electron-deficient areas and are susceptible to nucleophilic attack. According to the calculated MEP maps, the most negative potential is mainly localized around the oxygen atoms, whereas the nitrogen atoms display a lower negative electrostatic potential. The positive electrostatic potential is predominantly distributed around the hydrogen atoms and neighboring carbon atoms. This charge distribution highlights the reactive regions of ZIL2 that are likely to participate in intermolecular interactions, particularly hydrogen bonding and electrostatic interactions with surrounding species.
4.7 Thermodynamic properties
The thermodynamic parameters of ZIL2 were calculated at 298.15 K using the optimized structure obtained at the B3LYP/6-311G(d, p) level of theory. The calculated properties include the zero-point vibrational energy (ZPVE), rotational constants (A, B, C), rotational temperatures (θr), thermal energy (E), heat capacity at constant volume (Cv), entropy (S), and the thermal corrections to energy (E), enthalpy (H), and Gibbs free energy (G). The calculated values are summarized in Table 6.
The calculated thermodynamic parameters indicate that ZIL2 possesses good thermal stability under standard conditions. The relatively high heat capacity at constant volume (44.152 cal.mol-1. K -1) reflects the ability of the molecule to store thermal energy, whereas the calculated entropy (106.237 cal.mol-1. K -1) is consistent with the structural complexity of the molecule. In addition, the positive thermal corrections to energy, enthalpy, and Gibbs free energy confirm the thermodynamic consistency of the optimized molecular structure.
Table 6. Thermodynamic parameters of ZIL2 calculated at 298.15 K using the DFT/B3LYP/ 6-311G (d, p) level of theory
|
Thermodynamic Parameters |
Value |
|
Zero-point vibrational energy (Kcal mol-1) |
162.61504 |
|
Thermal Enthalpies ΔΗ (Kcal.mol-1) |
173.7876 |
|
Rotational constant (GHZ) |
0.83950 |
|
|
0.63662 |
|
|
0.51459 |
|
Rotational temperature (Kelvin) |
0.04029 |
|
|
0.03055 |
|
|
0.02470 |
|
Energy (Kcal.mol-1) |
|
|
Total |
168.153 |
|
Translational |
0.889 |
|
Rotational |
0.889 |
|
Vibrational |
166.376 |
|
Molecular capacity at constant volume (Cal. mol-1. K -1) |
|
|
Total |
44.152 |
|
Translational |
2.981 |
|
Rotational |
2.981 |
|
Vibrational |
38.191 |
|
Entropy (Cal.mol-1. K -1) |
|
|
Total |
106.237 |
|
Translational |
41.726 |
|
Rotationall |
31.436 |
|
Vibrational |
33.075 |
|
Zero-point correction (Hartree/Particle) |
0.256784 |
|
Thermal correction to Energy |
0.267970 |
|
Thermal correction to Enthalpy |
0.268914 |
|
Thermal correction to Gibbs Free Energy |
0.218437 |
This study combined experimental characterization and DFT to investigate the physicochemical properties of ZIL2. Experimental analysis using TGA/DTA, UV-Vis, and FTIR spectroscopy provided valuable information on its thermal stability, optical behavior, and vibrational characteristics. Complementary DFT calculations performed at the B3LYP/6-311G(d, p) level enabled the determination of the optimized molecular geometry, FMO, DOS, MEP, global reactivity descriptors, and thermodynamic properties.
The experimental results revealed that ZIL2 is thermally stable up to approximately 231 ℃, and exhibits a melting temperature of 98.66 ℃. UV-Vis spectroscopy showed strong absorption, while the experimental optical band gap was estimated to be 5.64 eV. Theoretical calculations confirmed the high chemical stability of the molecule through its relatively large HOMO-LUMO energy gap, favorable global reactivity descriptors, and MEP distribution, which identified the most probable electrophilic and nucleophilic reactive sites.
Overall, experimental and theoretical investigations provide complementary information for understanding the structural, electronic, optical, and thermodynamic properties of ZIL2. The combined approach demonstrates the usefulness of integrating experimental characterization with quantum chemical calculations for the investigation of ZILs and provides a solid basis for their future applications in catalysis, electrochemistry, functional materials, and related fields.
A1. NMR results of ZIL2
3-(1,3-diethyl-1H-imidazol-3-ium-4-yl)propanoate (ZIL2)
8.80g (26.03 mmol) of 4-(3-methoxy-3-oxopropyl)-1,3-diethyl-1H-imidazol-3-ium iodide and 53g of resin Amberlite IRN78 OH (1/6 ratio) in 44 mL of MeOH were used to obtain pure ZIL2 as a white solid (4.37g, 85% yield). Mp = 98 ℃.
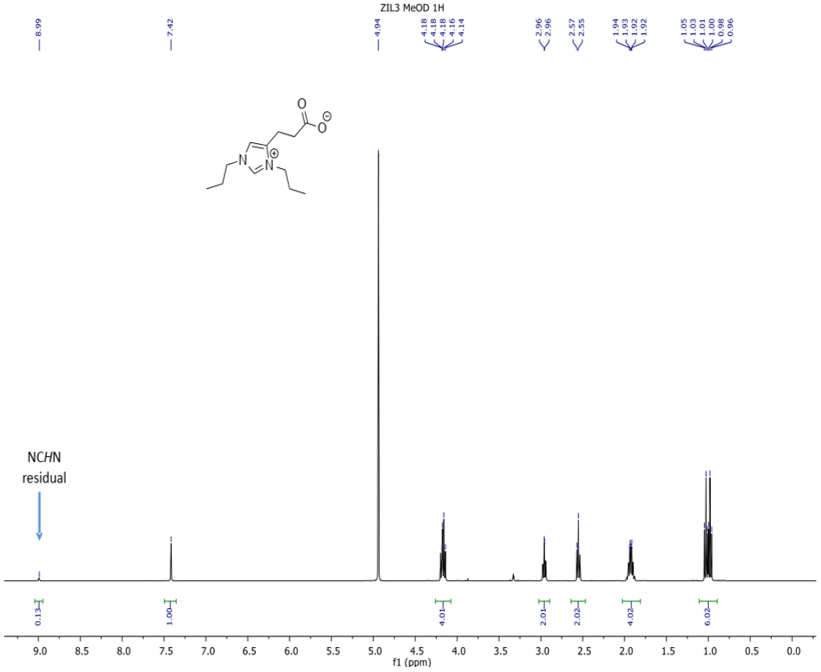
1H NMR (CD3OD, 400 MHz)d: 9.03 (s, 1H, NCHN residual), 7.44 (s, 1 H, CH=N), 4.25 (m, 4 H, 2 × NCH2), 2.97 (t, 2 H, J = 7.2 Hz, CH2), 2.56 (t, 2 H, J = 7.2 Hz, CH2), 1.55 (m, 6 H, 2 × CH3).
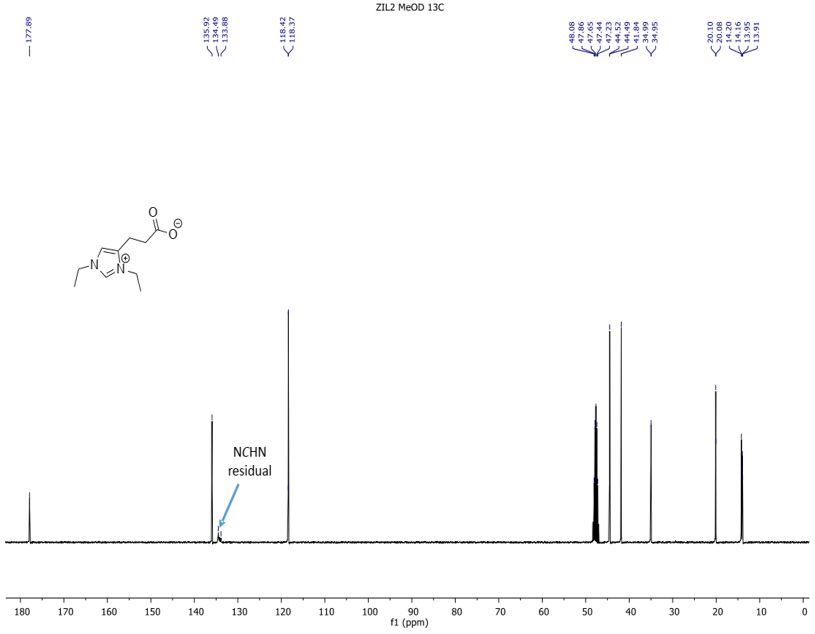
13C NMR (CD3OD, 100 MHz) d: 177.8 (CO2-), 135.9 (Cq), 134.4, 133.8 (m, NCHN residual), 118.4 (CH = C), 44.5, 41.8 (2 × NCH2), 34.9 (CH2), 20.0 (CH2), 14.2, 13.9 (2 × CH3).
HRMS (ESI+) calc. for C10H17N2O2 [M+H]+ 197.1290, found 197.1294.
Figure A1. 1H NMR spectrum of ZIL2
Figure A2. 13C NMR spectrum of ZIL2
A2. Experimental and theoretical optical gap spectrum of ZIL2
A2.1 Experimental optical gap spectrum
Figure A3. Experimental optical gap of ZIL2 by the first derivative
Figure A4. Experimental optical gap of ZIL2 by the second derivative
Figure A5. Experimental optical gap of ZIL2 by Tauc plot
A2.2 Theoretical optical gap spectrum
Figure A6. Theoretical optical gap of ZIL2 by the first derivative
Figure A7. Theoretical optical gap of ZIL2 by the second derivative
Figure A8. Theoretical optical gap of ZIL2 by Tauc plot
[1] Chaudhary, A., Bhaskarwar, A.N. (2015). A novel ionic liquid for carbon capture. Athens Journal of Sciences, 2(3): 187-202. https://doi.org/10.30958/ajs.2-3-3
[2] Saha, S. (2021). Versatile applications of the ionic liquid. Journal of Advanced Scientific Research, 12(02): 1-7. https://doi.org/10.55218/JASR.202112201
[3] Bešter-Rogač, M. (2020). Ionic liquids: Simple or complex electrolytes? Acta Chimica Slovenica, 67(1): 1-14. https://doi.org/10.17344/acsi.2020.5870
[4] Ali, I., Suhail, M., Locatelli, M., et al. (2022). Role of ionic liquids in capillary electrophoresis. Analytica, 3(2): 236-250. https://doi.org/10.3390/analytica3020017
[5] Pereira, J., Souza, R., Moreira, A., Moita, A. (2024). An overview of the ionic liquids and their hybrids operating in electrochemical cells and capacitors. Ionics, 30(8): 4343-4385. https://doi.org/10.1007/s11581-024-05626-x
[6] Al-Bodour, A., Alomari, N., Perez-Duran, G., et al. (2025). Ionic liquids as multidimensional materials: A review from fundamentals to applications. Energy & Fuels, 39(27): 12791-12829. https://doi.org/10.1021/acs.energyfuels.5c01280
[7] Siriwardana, A.I. (2015). Industrial applications of ionic liquids. In Electrochemistry in Ionic Liquids: Volume 2: Applications, pp. 563-603. https://doi.org/10.1007/978-3-319-15132-8_20
[8] Egorova, K.S., Gordeev, E.G., Ananikov, V.P. (2017). Biological activity of ionic liquids and their application in pharmaceutics and medicine. Chemical Reviews, 117(10): 7132-7189. https://doi.org/10.1021/acs.chemrev.6b00562
[9] Singh, S.K., Savoy, A.W. (2020). Ionic liquids synthesis and applications: An overview. Journal of Molecular Liquids, 297: 112038. https://doi.org/10.1016/j.molliq.2019.112038
[10] Qureshi, Z.S., Deshmukh, K.M., Bhanage, B.M. (2014). Applications of ionic liquids in organic synthesis and catalysis. Clean Technologies and Environmental Policy, 16(8): 1487-1513. https://doi.org/10.1007/s10098-013-0660-0
[11] Wei, D., Ivaska, A. (2008). Applications of ionic liquids in electrochemical sensors. Analytica Chimica Acta, 607(2): 126-135. https://doi.org/10.1016/j.aca.2007.12.011
[12] Roosen, C., Müller, P., Greiner, L. (2008). Ionic liquids in biotechnology: Applications and perspectives for biotransformations. Applied Microbiology and Biotechnology, 81(4): 607-614. https://doi.org/10.1007/s00253-008-1730-9
[13] MacFarlane, D.R., Tachikawa, N., Forsyth, M., et al. (2013). Energy applications of ionic liquids. Energy & Environmental Science, 7(1): 232-250. https://doi.org/10.1039/c3ee42099j
[14] Flieger, J., Flieger, M. (2020). Ionic liquids toxicity—Benefits and threats. International Journal of Molecular Sciences, 21(17): 6267. https://doi.org/10.3390/ijms21176267
[15] Ohno, H., Yoshizawa-Fujita, M., Kohno, Y. (2018). Design and properties of functional zwitterions derived from ionic liquids. Physical Chemistry Chemical Physics, 20(16): 10978-10991. https://doi.org/10.1039/C7CP08592C
[16] Beil, S., Markiewicz, M., Pereira, C.S., et al. (2021). Toward the proactive design of sustainable chemicals: Ionic liquids as a prime example. Chemical Reviews, 121(21): 13132-13173. https://doi.org/10.1021/acs.chemrev.0c01265
[17] Amsel, A.K., Olsson, O., Kümmerer, K. (2023). Identification of structure–biodegradability relationships for ionic liquids–clustering of a dataset based on structural similarity. Green Chemistry, 25(22): 9226-9250. https://doi.org/10.1039/d3gc02392c
[18] Vieira, N.S., Stolte, S., Araujo, J.M., et al. (2019). Acute aquatic toxicity and biodegradability of fluorinated ionic liquids. ACS Sustainable Chemistry & Engineering, 7(4): 3733-3741. https://doi.org/10.1021/acssuschemeng.8b03653
[19] Kunz, W., Häckl, K. (2016). The hype with ionic liquids as solvents. Chemical Physics Letters, 661: 6-12. https://doi.org/10.1016/j.cplett.2016.07.044
[20] Amarasekara, A.S. (2016). Acidic ionic liquids. Chemical Reviews, 116(10): 6133-6183. https://doi.org/10.1021/acs.chemrev.5b00763
[21] Huang, H.H., Jia, J., Ren, L., et al. (2023). A zwitterionic solution for smart ionic liquids to evade cytotoxicity. Journal of Hazardous Materials, 453: 131430. https://doi.org/10.1016/j.jhazmat.2023.131430
[22] Moreno, D., Gonzalez‐Miquel, M., Ferro, V.R., Palomar, J. (2018). Molecular and thermodynamic properties of zwitterions versus ionic liquids: A comprehensive computational analysis to develop advanced separation processes. ChemPhysChem, 19(7): 801-815. https://doi.org/10.1002/cphc.201701093
[23] Biscay, F., Chizallet, C., Creton, B., et al. (2011). La modélisation moléculaire s’ invite dans l’industrie. l’Actualité Chimique, 353-354: 66-73.
[24] Huet, G., Araya-Farias, M., Alayoubi, R., et al. (2020). New biobased-zwitterionic ionic liquids: Efficiency and biocompatibility for the development of sustainable biorefinery processes. Green Chemistry, 22(9): 2935-2946. https://doi.org/10.1039/d0gc01002b
[25] Nadaf, Y.F., Sushma, G.N., Suma, M., Sultana, W. (2022). Spectroscopic, molecular structure, FMO and thermodynamic properties of 11-chloro-12 (methylsulfanyl) quinoxaline molecule using DFT. Journal of Advanced Scientific Research, 13(4): 51-58. https://doi.org/10.55218/JASR.202213410
[26] Afsar, N., Jonathan, D.R., Ramesh, S., et al. (2024). Synthesis of biologically active α-tetralone condensate: Growth of single crystal, characterization by experimental and simulation methods. Polycyclic Aromatic Compounds, 44: 2394-2418. https://doi.org/10.1080/10406638.2023.2216836
[27] Fahim, A.M., Magar, H.S., Ayoub, M.A. (2022). Synthesis, characterization, thermal studies, electrochemical behavior, antimicrobial, docking studies, and computational simulation of triazole-thiol metal complexes. Applied Organometallic Chemistry, 36(5): e6647. https://doi.org/10.1002/aoc.6647
[28] Shukla, M., Saha, S. (2013). A comparative study of piperidinium and imidazolium based ionic liquids: Thermal, spectroscopic and theoretical studies. In Ionic liquids-New Aspects for the Future. IntechOpen. https://doi.org/10.5772/51797
[29] Panja, S.K., Dwivedi, N., Noothalapati, H., et al. (2015). Significance of weak interactions in imidazolium picrate ionic liquids: Spectroscopic and theoretical studies for molecular level understanding. Physical Chemistry Chemical Physics, 17(27): 18167-18177. https://doi.org/10.1039/c5cp01944c
[30] Gangadharan, R.P. (2022). Molecular structure, vibrational studies and reactivity descriptors analysis of 4-[2-(tert-butylamino)-1-hydroxyethyl]-2-(hydroxymethyl) phenol. Trends in Sciences, 19(21): 4912-4912. https://doi.org/10.48048/tis.2022.4912
[31] Sudhakar, K., Ahamed, J.I., Kamalarajan, P. (2023). Synthesis, spectral characterizations, vibrational spectroscopy, DFT-computations, antibacterial, antioxidant, and molecular docking studies of the novel (Z)-2-(5-((10-hexyl-10H-phenothiazin-3-yl) methylene)-4-oxo-2-thioxothiazolidin-3-yl) acetic acid. Journal of Molecular Structure, 1292: 136008. https://doi.org/10.1016/j.molstruc.2023.136008
[32] Suliman, R., Yasin, S., Eltoum, M.S.A. (2022). Ionic liquids nitrogen-based, preparation, characterization, and application. Journal of Pharmaceutics and Pharmacology Research, 5(6): 1-5. https://doi.org/10.31579/2693-7247/083
[33] Luchian, R., Borsay, Z., Maniu, D., Leopold, N., Chiş, V. (2022). Vibrational features of diphenylhydantoin. Studia Universitatis Babes-Bolyai, Physica, 67(1/2): 107-118. https://doi.org/10.24193/subbphys.2022.09
[34] Moschovi, A.M., Ntais, S., Dracopoulos, V., Nikolakis, V. (2012). Vibrational spectroscopic study of the protic ionic liquid 1-H-3-methylimidazolium bis (trifluoromethanesulfonyl) imide. Vibrational Spectroscopy, 63: 350-359. https://doi.org/10.1016/j.vibspec.2012.08.006
[35] Cha, S., Ao, M., Sung, W., et al. (2014). Structures of ionic liquid–water mixtures investigated by IR and NMR spectroscopy. Physical Chemistry Chemical Physics, 16(20): 9591-9601. https://doi.org/10.1039/c4cp00589a
[36] Amalanathan, M., Rastogi, V.K., Joe, I.H., Palafox, M.A., Tomar, R. (2011). Density functional theory calculations and vibrational spectral analysis of 3, 5-(dinitrobenzoic acid). Spectrochimica Acta Part A: Molecular and Biomolecular Spectroscopy, 78(5): 1437-1444. https://doi.org/10.1016/j.saa.2011.01.023
[37] Kumar, A., Pandey, A., Mishra, A. (2020). Computational study of novel 2, 3-bis [(1-methyl-1H-imidazole-2-yl) sulfanyl] quinoxaline: Structural aspects, spectroscopic investigation, HOMO-LUMO, MESP, NLO, ADMET predictions, and molecular docking studies as potential biotin carboxylase and antibiotics resistant aminoglycoside phosphotransferase aph (2’’) IVA enzyme inhibitor. Asian Journal of Chemistry, 32: 706-726.
[38] Alsharif, M.A., Naeem, N., Mughal, E.U., et al. (2021). Experimental and theoretical insights into the photophysical and electrochemical properties of flavone-based hydrazones. Journal of Molecular Structure, 1244: 130965. https://doi.org/10.1016/j.molstruc.2021.130965
[39] Prabakaran, A., Muthu, S. (2014). Normal coordinate analysis, molecular structure, vibrational and electronic spectral investigation of 7-(1, 3-dioxolan-2-ylmethyl)-1, 3-dimethylpurine-2, 6-dione by ab initio HF and DFT method. Spectrochimica Acta Part A: Molecular and Biomolecular Spectroscopy, 118: 578-588. https://doi.org/10.1016/j.saa.2013.09.004
[40] Ramalingam, A., Sambandam, S., Medimagh, M., Al-Dossary, O., Issaoui, N., Wojcik, M.J. (2021). Study of a new piperidone as an anti-Alzheimer agent: Molecular docking, electronic and intermolecular interaction investigations by DFT method. Journal of King Saud University-Science, 33(8): 101632.
[41] Boumediene, M., Haddad, B., Paolone, A., et al. (2019). Synthesis, thermal stability, vibrational spectra and conformational studies of novel dicationic meta-xylyl linked bis-1-methylimidazolium ionic liquids. Journal of Molecular Structure, 1186: 68-79. https://doi.org/10.1016/j.molstruc.2019.03.019
[42] Shukla, M., Srivastava, N., Saha, S. (2011). Interactions and transitions in imidazolium cation based ionic liquids. Ionic liquids–classes and properties. Janez Trdina, 9(51000): 153-170.
[43] Odabaşıoğlu, S., Kurtaran, R., Azizoglu, A., Kara, H., Öz, S., Atakol, O. (2009). Experimental and computational investigations of a cadmium (II) mononuclear complex with 2, 6-Bis (3, 5-dimethyl-N-pyrazolyl) pyridine (bdmpp) and selenocyanate as ligands. Central European Journal of Chemistry, 7(3): 402-409. https://doi.org/10.2478/s11532-009-0027-x
[44] Godwini, R., Monicka, J.C., Victoria, S.G. (2023). Analyses on the reactivity, topology and bioactivity of fluazinam using density functional theory. Chemical Physics Impact, 7: 100309. https://doi.org/10.1016/j.chphi.2023.100309
[45] Momeni, M., Mashhour, H.Y., Kalantarian, M.M. (2019). New approaches to consider electrical properties, band gaps and rate capability of same-structured cathode materials using density of states diagrams: Layered oxides as a case study. Journal of Alloys and Compounds, 787: 738-743. https://doi.org/10.1016/j.jallcom.2019.02.155
[46] O'Boyle, N.M., Tenderholt, A.L., Langner, K.M. (2008). Cclib: A library for package-independent computational chemistry algorithms. Journal of Computational Chemistry, 29(5): 839-845. https://doi.org/10.1002/jcc.20823
[47] Adly, O.M., Taha, A., Fahmy, S.A., Ibrahim, M.A. (2023). TD-DFT calculations, dipole moments, and solvatochromic properties of 2-aminochromone-3-carboxaldehyde and its hydrazone derivatives. RSC Advances, 13(38): 26587-26603. https://doi.org/10.1039/d3ra05081e
[48] Romani, D., Márquez, M.J., Brandán, S.A. (2023). Vibrational study of mono and diprotonated species of potent anti-acid ranitidine hydrochloride combining DFT with SQMFF calculations. Biointerface Research in Applied Chemistry, 13(3): 348-381. https://doi.org/10.33263/BRIAC133.248
[49] Pushpalatha, M., Rajesh, P., Sailatha, E., Gunasekaran, S. (2018). Isolated, spectral analysis (FT-IR, UV-Vis) Investigation and QCC quantum chemical calculation of 7,10,11-Octadeconaic acid. International Journal of Research and Analytical Reviews (IJRAR), 5(4): 267-276. https://ijrar.org/papers/IJRAR1944701.pdf.
[50] Thapa, A., Tamang, S., Chettri, K., Biswas, J. (2023). Comparative theoretical study of quinazolinone derivatives in different solvents and gas phase. A Density Functional Theory (DFT) Calculations. Research Square, 1-27. https://doi.org/10.21203/rs.3.rs-2629782/v1