Emerson Navarro-Guillén | José Yauri* | Lucy Escalante-Pablo | Elinar Carrillo-Riveros | Edith Guevara-Morote | Juan Carlos Carreño-Gamarra | Diana Luján-Pérez
© 2026 The authors. This article is published by IIETA and is licensed under the CC BY 4.0 license (http://creativecommons.org/licenses/by/4.0/).
OPEN ACCESS
Childhood chronic malnutrition remains a major public health concern, particularly in low- and middle-income regions where timely identification of vulnerable populations is essential for effective intervention. However, the deployment of predictive models in national health information systems is often limited by scalability, heterogeneous data structures, and insufficient interpretability. This study proposes an explainable artificial intelligence (XAI) framework for chronic malnutrition surveillance using the Peruvian Nutritional Status Information System (SIEN). A CatBoost-based classification model was developed using 1,794,809 national health records collected in 2024, incorporating anthropometric, demographic, and socioeconomic variables. The model was designed to handle high-dimensional categorical information without manual encoding while maintaining predictive transparency through Shapley Additive Explanations (SHAP) analysis. A stratified 10-fold cross-validation strategy was applied to evaluate model robustness. The proposed framework achieved an accuracy of 99.44%, recall of 97.62%, precision of 98.84%, F1-score of 98.22%, specificity of 99.78%, and area under the receiver operating characteristic curve (ROC-AUC) of 99.86%. SHAP analysis revealed that anthropometric indicators, particularly Height_for_Age, were the dominant predictors, while social program variables showed comparatively limited contribution within the predictive model. Beyond predictive performance, this work presents a deployment-oriented architecture integrating data processing, inference services, and interpretability mechanisms for national health information environments. The proposed framework provides a scalable approach for supporting evidence-based nutritional surveillance and early identification of children at risk of chronic malnutrition in Peru.
explainable artificial intelligence, CatBoost, Shapley Additive Explanations analysis, chronic malnutrition, health information systems, nutritional surveillance, clinical decision support
Chronic malnutrition results from inadequate energy and nutrient intake, causing growth retardation and micronutrient deficiencies, especially in children [1]. Malnutrition represents a global challenge affecting all nations, although its prevalence is significantly higher in developing countries [2]. Recent assessments indicate that more than 149 million children under the age of five suffer from chronic malnutrition, which promotes irreversible cognitive impairment and is responsible for more than half of all deaths within this demographic group [3, 4].
In Peru, a South American country with over 34 million inhabitants, malnutrition has been rising in recent years; 11.7% of children suffer from chronic malnutrition, with the figure reaching 23.9% in rural areas [5, 6]. Consequently, the immediate detection of childhood malnutrition is crucial for providing timely treatment. However, traditional medical diagnosis is based on two approaches: subjective assessment using clinical parameters such as changes in body weight versus objective assessment based on clinical, anthropometric, and socioeconomic indicators [7].
While traditional methods offer a moderate degree of accuracy in diagnosing malnutrition, the lack of medical personnel and equipment in rural and impoverished areas of Peru hinders early diagnosis, prevention, and treatment of malnutrition in children.
Recently, international scientific literature has reported the use of artificial intelligence (AI) algorithms to successfully diagnose and predict malnutrition [8]. Among them, machine learning (ML) techniques applied to health data stand out for predicting malnutrition in children under five years of age, using Demographic and Health Survey (DHS) data, with recent studies demonstrating reasonable performance [9].
Despite the advances, the difficulty of handling large amounts of data that allow the discovery of complex relationships within the data still persists, and traditional methods frequently fail to address these issues [10]. Furthermore, the use of categorical data with improved quality and representativeness remains underexplored. Moreover, the interpretability of model results, a key aspect for strengthening confidence in their application within public health systems, remains limited [8].
This article proposes a computational method for the automated classification of chronic malnutrition in the Peruvian Nutritional Status Information System (SIEN). Using a massive national dataset of 1,794,809 records, the system incorporates anthropometric, demographic, and socioeconomic variables to provide a comprehensive analysis of nutrition indicators. This study employs the CatBoost algorithm because of its demonstrated efficiency in processing complex categorical data and capturing nonlinear relationships without manual coding.
In addition, the integration of Shapley Additive Explanations (SHAP) enables technical interpretation, identifies the most relevant features of model learning, and increases the transparency of decision-making in large-scale public health infrastructures.
Rather than treating the model as a standalone predictive exercise, this work frames it as an interpretable decision-support component embedded within SIEN's data pipeline, addressing the scalability, categorical-data handling, and interpretability requirements that its operational deployment as part of a national health information system demands.
It should be clarified that the contribution of this work is not the CatBoost algorithm or the SHAP explainability method themselves, both of which are established off-the-shelf tools; rather, the contribution lies at the systems level.
First, the feature-engineering and imputation pipeline was designed and validated on 1,794,809 real production records from a national health information system, one to two orders of magnitude larger than any dataset used in prior malnutrition-prediction studies, a scale that surfaces data-quality and categorical-handling challenges absent from smaller, curated academic datasets.
Second, this study proposes an integration architecture, comprising a lightweight inference Application Programming Interface (API), a monitoring and retraining cycle, and an interpretability layer tailored to low-bandwidth clinical settings, that functions as a reusable blueprint for embedding interpretable ML within a national health information system, extending beyond a one-off predictive exercise.
Third, the model's very high fidelity in reproducing anthropometric classification criteria is repurposed as a secondary contribution: an automated data-auditing mechanism capable of flagging labeling inconsistencies across a massive national repository, an application not explored in the reviewed prior work.
This study is organized as follows. Section 2 reviews the existing literature on the detection and prediction of child undernutrition, as well as related work on its impact using ML methods. Section 3 describes the proposed method, including materials and computational procedures. Section 4 presents the experimental results, and Section 5 provides a comprehensive analysis. Finally, Section 6 summarizes the main conclusions and concludes the paper.
Several studies have applied ML techniques to analyze and predict nutritional problems in children under five years of age using demographic, socioeconomic, and health data. Many of these studies focus on stunting, which is considered a chronic manifestation of childhood malnutrition associated with abnormal physical growth due to prolonged nutritional deficiencies.
The study by Ndagijimana et al. [11] used the Gradient Boosting algorithm to predict growth retardation in children under five years of age in Rwanda. Using a comparatively small dataset of 3,814 records, the model demonstrated reasonable classification performance through 10-fold cross-validation, illustrating the potential of data-driven approaches to identify children at risk.
Similarly, Shen et al. [12] evaluated ML algorithms to predict stunting in Papua New Guinea. Their XGBoost-based model with feature selection using LASSO employed a comparatively small sample of 3,380 records and achieved moderate classification performance using 10-fold cross-validation, highlighting the effectiveness of ensemble-based methods.
On the other hand, Khan and Yunus [13] proposed a hybrid ensemble model combining Random Forest (RF), Decision Tree (DT), XGBoost, and K-Nearest Neighbors (KNN). They evaluated it using 56,243 records from sub-Saharan African countries — the largest sample among the related studies reviewed here, though still substantially smaller than the dataset used in this work — and achieved strong classification performance using 10-fold cross-validation.
The study by Bitew et al. [14] applied the XGBoost algorithm to predict child malnutrition in Ethiopia using 9,471 records. The results demonstrated the utility of ML methods for large-scale public health data analysis.
The study by Chilyabanyama et al. [15] analyzed different classifiers to predict growth retardation in children under five years of age in Zambia. Their RF model, evaluated with 6,799 records, achieved reasonable classification performance using 3-fold cross-validation.
In recent studies on child malnutrition, Abid et al. [16] used artificial neural networks (ANNs) on a comparatively small sample of 7,256 records from a private dataset, achieving reasonable classification performance. This work demonstrates the applicability of deep learning approaches for malnutrition prediction, although it is limited by the availability of public data.
Meanwhile, Rahman et al. [17] applied RF to analyze factors associated with stunting, wasting, and low weight in children in Bangladesh. Using 7,079 records, they achieved strong classification performance through 10-fold cross-validation, highlighting the usefulness of ML models for identifying nutritional determinants in national health surveys.
Complementarily, Mansur et al. [18] used Logistic Regression to study sociodemographic factors associated with childhood stunting in a set of 6,170 records. Although the exact accuracy was not reported, the model was evaluated using 10-fold cross-validation, showing that traditional statistical approaches remain relevant in epidemiological studies.
In another approach, Shahriar et al. [19] used RF on 6,995 records of children aged 0 to 59 months, achieving modest classification performance using 10-fold cross-validation. This study emphasizes the need to improve variable selection and preprocessing to increase model effectiveness.
Meanwhile, Khan et al. [20] applied Gradient Boosting with feature selection to 6,044 records, evaluated using 3-fold cross-validation. Although exact accuracy metrics were not reported, the study underscores the relevance of boosting methods for malnutrition prediction problems.
Similarly, Talukder and Ahammed [21] explored different ANN algorithms on 6,863 records from a private dataset, evaluating their performance using 10-fold cross-validation. This approach demonstrates the potential of deep learning methods, although the lack of public access limits replicability.
Finally, Tamanna et al. [22] analyzed the determinants of childhood malnutrition using RF with Boruta feature selection on 7,910 records from the Bangladesh Demographic and Health Survey (BDHS)-2022 dataset. The model demonstrated moderate classification performance, providing valuable information on the main risk factors associated with nutritional outcomes in children under five years of age.
Table 1 presents a summary of the main studies, the best reported algorithm, the record number of the dataset, and the validation methods used. Reported accuracy is not included in this comparison, since the datasets used in prior work range from roughly 3,300 to 56,000 records, one to two orders of magnitude smaller than the 1,794,809-record dataset used in this study, making direct accuracy comparisons across studies uninformative.
In summary, most prior studies share three methodological limitations that CatBoost’s design directly addresses.
First, models such as RF, standard Gradient Boosting, Logistic Regression, KNN, and artificial neural networks require manual encoding of categorical variables (typically one-hot or label encoding), which either inflates dimensionality or imposes an artificial ordinal relationship between categories; CatBoost processes categorical features natively through ordered target statistics, avoiding both issues.
Second, when Gradient Boosting implementations encode categories using target-derived statistics, this introduces a risk of target leakage, since the encoding can implicitly incorporate information about the outcome during training; CatBoost’s ordered boosting procedure was specifically designed to prevent this form of leakage.
Third, none of the reviewed studies explicitly reports how class imbalance was handled, despite chronic malnutrition typically representing a minority class in these populations, a pattern consistent with the roughly 16% minority-class share observed in this study’s own dataset (284,746 of 1,794,809 records); CatBoost incorporates loss-function-level handling of class imbalance, whereas the reviewed studies rely on the base algorithm’s default behavior.
Beyond these algorithmic considerations, few of the reviewed studies incorporate a native explainability layer, relying instead on post-hoc feature-importance rankings that do not quantify individual prediction contributions. This work addresses these gaps using a large dataset of 1,794,809 real records from the Peruvian SIEN system, applying CatBoost combined with SHAP to identify the most influential variables and thoroughly evaluating the model using stratified 10-fold cross-validation.
Table 1. Current overview of malnutrition child prediction in related works
|
Study |
ML Technique |
Sample Records |
Validation |
Dataset Used |
|
Ndagijimana et al. [11] |
Gradient Boosting |
3,814 |
10-fold cross-validation |
Public |
|
Shen et al. [12] |
XGBoost (LASSO feature selection) |
3,380 |
10-fold cross-validation |
Public |
|
Khan and Yunus [13] |
Hybrid Ensemble (RF, DT, XGBoost, KNN) |
56,243 |
10-fold cross-validation |
Public |
|
Bitew et al. [14] |
XGBoost |
9,471 |
10-fold cross-validation |
Public |
|
Chilyabanyama et al. [15] |
Random Forest |
6,799 |
3-fold cross-validation |
Public |
|
Abid et al. [16] |
Artificial Neural Network |
7,256 |
- |
Private |
|
Rahman et al. [17] |
Random Forest |
7,079 |
10-fold cross-validation |
Public |
|
Mansur et al. [18] |
Logistic Regression |
6,170 |
10-fold cross-validation |
Public |
|
Shahriar et al. [19] |
Random Forest |
6,995 |
10-fold cross-validation |
Public |
|
Khan et al. [20] |
Gradient Boosting |
6,044 |
3-fold cross-validation |
Public |
|
Talukder and Ahammed [21] |
Artificial Neural Network |
6,863 |
10-fold cross-validation |
Private |
|
Tamanna et al. [22] |
Random Forest (Boruta feature selection) |
7,910 |
- |
Public |
3.1 Dataset
The SIEN collects information on the nutritional status of children and pregnant women in Peru. Managed through the Ministry of Health (MINSA), the system aggregates clinical data directly from standardized medical records across national health facilities [23, 24].
From this system, 1,794,809 data records of children under five years of age from 2024 were filtered and selected. These records contain data on childhood malnutrition collected during routine patient care at Peruvian health facilities.
The data follow the 2006 World Health Organization (WHO) Growth Standards reference standard, ensuring a standardized nutritional assessment. The dataset includes anthropometric variables such as weight, height, and age, among others. Of these, 1,510,063 correspond to healthy children and 284,746 to chronic malnutrition cases.
In this study, “chronic malnutrition” refers specifically to stunting: height-for-age below –2 standard deviations of the WHO Child Growth Standards. This is the indicator SIEN and Peru’s public health system (MINSA, INEI) report as “desnutrición crónica infantil,” and it is the outcome variable used throughout this work; broader, non-height-based forms of chronic malnutrition are outside its scope.
3.2 Pre-processing and feature engineering
A preprocessing stage was performed to optimize the quality and robustness of the dataset before training the model. This stage included data cleaning, checking for inconsistent values, and generating additional features to help the model identify patterns related to chronic malnutrition. Table 2 summarizes the attributes or characteristics of our dataset.
During preprocessing, missing or inconsistent values were first identified. Missing records were found in the variables Weight (7,729), Counseling (29,106), and Session (3,853), while the remaining variables contained no missing values. The missing values in Weight were imputed using the median in order to reduce the influence of potential outliers. For the binary variables Counseling and Session, missing values were imputed using the most frequent category to preserve the original distribution of the data. This imputation strategy avoided discarding records, so the final dataset used for model training and evaluation retained its complete total of 1,794,809 records.
Missingness in the Juntos_Program and Qaliwarma_Program fields is attributable to operational rather than clinical factors: intermittent internet connectivity in remote health facilities with limited infrastructure, administrative renaming of these social programs during the data collection period that affected how affiliation was recorded, and inconsistent completion of the corresponding data-entry module across health facility visits. These factors are unrelated to the child's nutritional status, supporting the use of mode imputation for these variables.
Following the data cleaning process, several additional features were created to enhance the model's learning capabilities. Two anthropometric rates were generated: Weight_for_Age (child's weight divided by age in years) and Height_for_Age (height divided by age in years). These new variables indicate growth rates useful for identifying chronic malnutrition.
It is important to clarify that Weight_for_Age and Height_for_Age are simple linear ratios (weight or height divided by age in years) and not the WHO height-for-age z-score (HAZ) used by MINSA/SIEN to clinically define chronic malnutrition, which is computed from sex- and age-specific Lambda-Mu-Sigma (LMS) reference tables rather than a linear division. Because both quantities are nevertheless derived from the same underlying measurements (height, weight, and age) used to compute HAZ, these engineered ratios are structurally correlated with the outcome and are expected to rank highly in feature importance. This correlation reflects a shared statistical origin rather than a reuse of the outcome's exact definition, and it is reported transparently here so that the relative SHAP importance of these variables is interpreted with this structural relationship in mind.
Additionally, the continuous variable Age_Years was transformed into a categorical variable called Age_Group, representing different stages of child development. These stages were defined as 0–6 months, 6–12 months, 1–2 years, 2–3 years, and 3–5 years. This transformation allows the model to better capture the nutritional differences that can occur at specific growth stages.
After completing the preprocessing and feature engineering stages, the final dataset included both the original variables and the newly generated features. Table 2 summarizes the variables used in this study, including their description and data type.
3.3 Model selection
For predicting chronic malnutrition, the CatBoost algorithm was selected due to its advantages when working with tabular data containing multiple categorical variables and unbalanced data. The dataset in this study contains numerous categorical variables, as shown in Table 2, and also has a small number of chronic malnutrition case records [25].
Recent public health research, such as previous studies [26, 27], has demonstrated that CatBoost exhibits robust performance in data imbalance scenarios, facilitating interpretability through methods such as SHAP, a technique based on Shapley values that quantifies the contribution of each variable to the model's prediction, improving the transparency and understanding of the results [27], consistent with related applications of SHAP-based interpretability in clinical decision support [28], supporting decision-making in public health, and enabling more effective treatments.
Table 2. Dataset variables
|
Variable |
Description |
Data Type |
|
Height |
Child’s height (cm) |
Numerical |
|
Sex |
Child’s sex |
Categorical |
|
Weight_for_Age |
Weight_for_Age anthropometric indicator |
Numerical |
|
Age_Years |
Child’s age in years |
Numerical |
|
Height_for_Age |
Height_for_Age anthropometric indicator |
Numerical |
|
Age_Group |
Child’s age group category |
Categorical |
|
Weight |
Child’s weight (kg) |
Numerical |
|
Altitude_m |
Altitude of the location (meters above sea level) |
Numerical |
|
CRED_Checkup |
Growth and Development Control attendance |
Binary |
|
SIS_Insurance |
Affiliation to Comprehensive Health Insurance (SIS) |
Binary |
|
Juntos_Program |
Affiliation to the JUNTOS social program |
Binary |
|
Supplementation |
Receipt of nutritional supplementation |
Binary |
|
Counseling |
Receipt of nutritional counseling |
Binary |
|
Session |
Participation in educational sessions |
Binary |
|
Qaliwarma_Program |
Beneficiary of the Qali Warma feeding program |
Binary |
3.4 Hyperparameter setting
For optimal performance, the CatBoost algorithm requires the configuration of certain hyperparameters. These hyperparameters were selected through a systematic grid search procedure, exploring different combinations of iterations, tree depth, and learning rate, and optimizing for Recall on the validation set. Table 3 summarizes these parameters and their corresponding settings. This configuration allows the model to learn complex patterns without overfitting on tabular and unbalanced datasets.
Table 3. Hyperparameter setting
|
Hyperparameter |
Value |
|
Iterations |
800 |
|
Depth |
6 |
|
Learning rate |
0.05 |
|
Loss function |
Logloss |
|
Eval metric |
Recall |
|
Random seed |
42 |
|
Verbose |
False |
The algorithm's effectiveness on the test data was calculated using indicators such as accuracy, precision, Recall, specificity, F1-score, and area under the receiver operating characteristic curve (ROC-AUC). The confusion matrix was used to derive the relevant performance parameters [29, 30].
Each metric is briefly described below:
Accuracy measures the proportion of correctly classified instances:
$Accuracy =\frac{T P+T N}{T P+T N+F P+F N}$ (1)
Precision represents the proportion of correctly predicted positive cases:
$Precision =\frac{T P}{T P+F P}$ (2)
Recall measures the proportion of actual positive cases correctly identified:
$Recall =\frac{T P}{T P+F N}$ (3)
Specificity measures the proportion of correctly identified negative cases:
$Specificity =\frac{T N}{T N+F P}$ (4)
The F1-score is the harmonic mean of precision and recall [31]:
$F 1- score =\frac{2 \times {Precision} \times {Recall}}{ {Precision} + {Recall}}$ (5)
Finally, the nearest upper-left criterion of the ROC curve was applied to determine the optimal threshold, and all metrics were reported at this threshold [32].
3.6 Experimental design
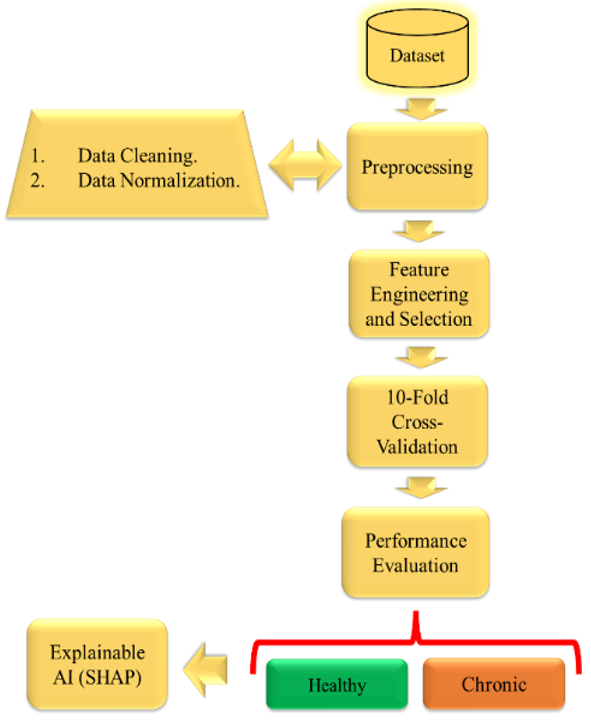
This study follows the stages shown in Figure 1. First, the database was collected and generated from the SIEN system, published in 2024. Next, the data were preprocessed to improve model performance. Feature selection and the creation of new variables were carried out based on those described in the preprocessing section, considering their statistical relevance, correlation with nutritional indicators, and consistency with factors associated with childhood malnutrition, following approaches reported in previous studies [8, 11, 25]. The model was then trained and tested using stratified 10-fold cross-validation, and the selected metrics were reported. Given the class imbalance in the dataset (284,746 chronic malnutrition cases versus 1,510,063 healthy children, approximately 16% versus 84%), folds were generated using scikit-learn's StratifiedKFold (n_splits = 10, shuffle = True, random_state = 42) to preserve this class proportion in every training and validation split, avoiding folds with distorted class ratios. Finally, the SHAP method was used to support interpretability and generate reliability in the predicted results.
Figure 1. Experimental design
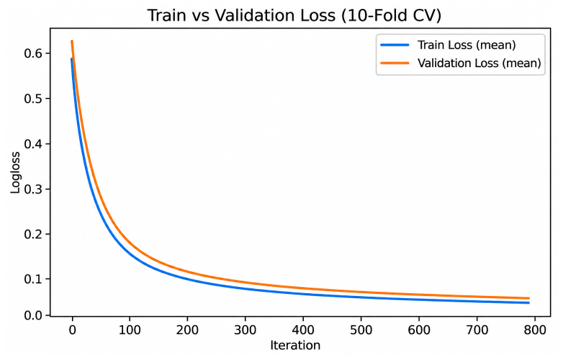
The training behavior of the CatBoost model was analyzed by monitoring the evolution of the learning process across iterations. Figure 2 shows the Logloss curve obtained during training. The curve showed a progressive decrease as the number of iterations increased, indicating that the model gradually minimized the classification error and converged toward an optimal solution.
Figure 2. Logloss curve across iterations
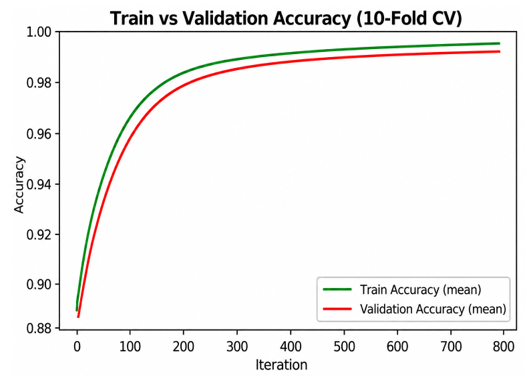
Figure 3. Accuracy curve across iterations
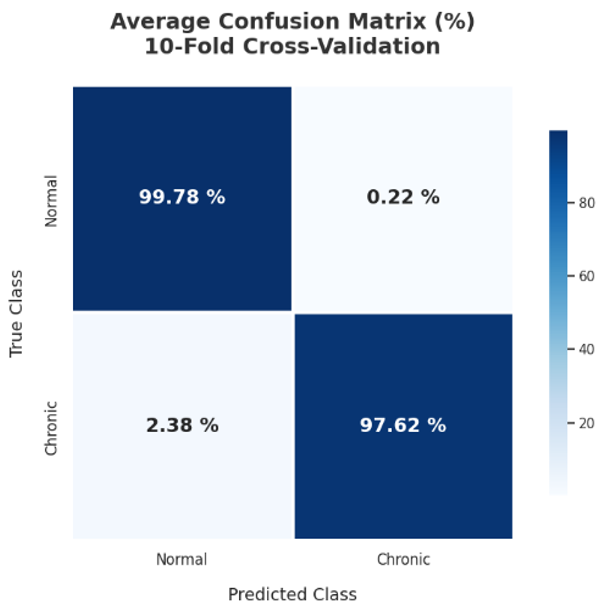
Figure 4. Confusion matrix
Analogously, Figure 3 shows the changes in the classification accuracy during training. The plot shows that the model achieved high accuracy values, suggesting that the classification model successfully learned the patterns present in the dataset.
Next, to evaluate the classification performance of the proposed model, the confusion matrix was computed. This matrix shows a summary of the number of correctly and incorrectly classified instances for each class: normal nutritional status and chronic malnutrition, as shown in Figure 4.
It was observed that the model correctly identified most observations between the two classes; in particular, the number of false negatives was relatively low, which is important in public health applications because it could delay timely interventions.
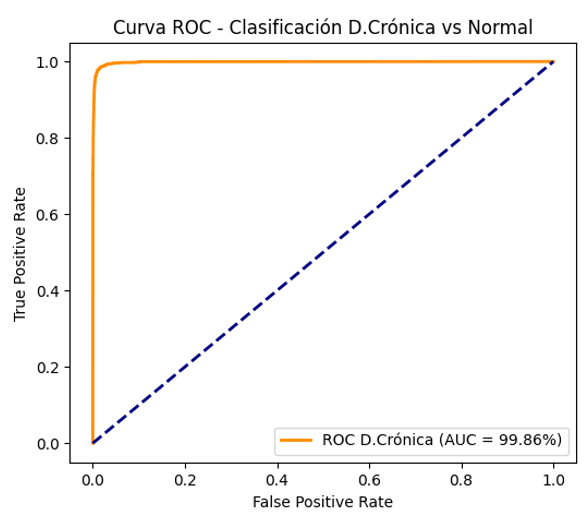
The results presented in Table 4 showed a strong predictive performance of the proposed model. The high accuracy (99.44%), together with elevated precision (98.84%) and recall (97.62%), indicated that the model correctly classified most observations while effectively identifying positive cases. In addition, the specificity of 99.78% reflected a very low rate of false positives, which is important in healthcare-related analyses. The F1-score of 98.22% further confirmed the balanced performance between precision and recall. Furthermore, the standard deviation values reported across the metrics corresponded to the fold-to-fold variation across the 10 stratified folds described in Section 3.6, and their low magnitude (≤0.12 percentage points across all metrics) indicated consistent performance of the model across folds during validation.
Table 4. Metrics of model performance
|
Metric |
Mean |
Standard Deviation |
|
Accuracy |
99.44 % |
0.02% |
|
Precision |
98.84% |
0.12% |
|
Recall |
97.62% |
0.08% |
|
Specificity |
99.78% |
0.02% |
|
F1-Score |
98.22% |
0.07% |
|
ROC-AUC |
99.86% |
0.02% |
Figure 5. Receiver operating characteristic (ROC) curve
Figure 6. Global Shapley Additive Explanations (SHAP) summary plot showing feature importance and direction of effect
Additionally, Figure 5 shows the ROC curve of the model. The obtained ROC-AUC value of 99.86% indicated an excellent capacity to distinguish between classes. The curve was located close to the upper-left corner, reflecting high Recall and a low false positive rate.
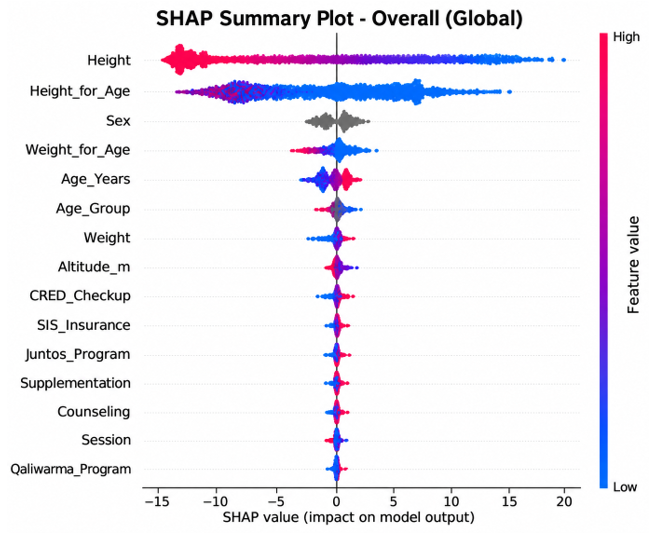
Next, to provide interpretability, an explainability analysis based on SHAP was performed. The global SHAP summary plot shown in Figure 6 ranks features by their overall contribution to the model's predictions and shows, through the color gradient, the direction of each feature's effect: for Height and Height_for_Age, low feature values (blue) are associated with positive SHAP values, pushing predictions toward chronic malnutrition, while high values (red) push predictions toward a healthy classification. The analysis indicated that anthropometric variables, such as the Height_for_Age ratio and standardized Height indicators, were among the most influential features in predicting chronic malnutrition.
Additionally, among the variables analyzed were social programs such as “Juntos_Program” and “SIS_Insurance”; their contribution to model predictions was relatively limited compared to key anthropometric and demographic indicators. This SHAP-based result describes the relative weight of these variables in the model's predictions and should not be interpreted as evidence regarding the real-world effectiveness of these social programs, since SHAP values reflect statistical association within the trained model rather than a causal effect.
This indicated that the predictive performance of the model was mainly determined by the biological and demographic characteristics associated with children's nutritional status.
Table 4 presents a detailed evaluation of the model's performance metrics. Strong predictive performance was observed, demonstrating that the CatBoost model constitutes a viable alternative algorithm to traditional ML methods.
Moreover, the results achieved, such as an accuracy of 99.44%, recall of 97.62%, and ROC-AUC of 99.86%, demonstrated strong predictive performance for identifying children at risk of chronic malnutrition. Prior studies employing algorithms such as RF, Gradient Boosting, and hybrid ensemble methods reported accuracies between 64.19% and 96.0%, but on substantially smaller datasets [11-13, 15, 21]; as discussed in Section 2, these figures are not directly comparable given the difference in dataset scale, and are noted here only to situate this study within the broader literature.
This very high performance is not a result of overfitting, but rather a validation of the ordered boosting capability of CatBoost and its proficiency in handling categorical data without manual transformations [25]. In the context of the 1,794,809 records analyzed, the model effectively functions as a data-auditing mechanism. While anthropometric variables like Height and Height_for_Age were dominant in the SHAP analysis because they are structurally correlated with the anthropometric criteria used to define chronic malnutrition (see Section 3.2), the model's ability to classify them with such strong fidelity proves its utility for automated consistency checks and the identification of labeling errors in massive national repositories. This robust handling of categorical features, as established by the creators of the algorithm, significantly reduces predictive bias in unbalanced datasets.
Regarding SHAP, it was observed that anthropometric variables, such as the Height_for_Age ratio and standardized Height, were the most influential in the model's prediction. As noted in Section 3.2, this ratio is structurally correlated with the WHO height-for-age z-score used to define chronic malnutrition, which is consistent with previous WHO studies [3].
Variables from Juntos_Program, SIS_Insurance, Supplementation, and CRED_Checkup were analyzed for their contribution to predicting chronic malnutrition. SHAP results showed limited predictive importance compared to anthropometric and demographic features. These findings are within the predictive framework of this study and do not imply causal effects. While some interventions contributed moderately to model predictions, this reflects their role in pattern recognition rather than direct impact on nutritional outcomes. Differences in contribution are dataset-specific and cannot be generalized as evidence of program effectiveness.
On the other hand, Bitew et al. [14] reported that socioeconomic factors and access to health services are determinants of childhood stunting, a phenomenon related to but distinct from general childhood malnutrition.
Table 5 situates this study within the broader literature on machine-learning-based malnutrition prediction, revisiting the sample sizes discussed in Section 2. For example, Tamanna et al. [22] used 7,910 records, while Shen et al. [12] used 3,380 records. Similarly, hybrid ensemble approaches such as Khan and Yunus [13] used 56,243 records, and other studies used similarly small samples [11, 15]. As explained in Section 2, reported accuracy figures from these studies are not included in Table 5; the full performance metrics for the proposed model are reported separately in Table 4.
Building on these foundations, our optimized CatBoost-SHAP approach leveraged the extensive 1,794,809 records available in the SIEN system. This allowed the model to achieve strong predictive performance (Table 4), while also providing interpretable insights into the most important predictor variables. These findings demonstrated that the proposed system is a robust evolution capable of handling large-scale public health data, enabling reliable monitoring and early identification of children at risk of malnutrition across Peru.
These results reflected strong predictive capability when evaluated on a substantially larger and more diverse dataset than those used in prior work. Furthermore, its integration with SHAP allows for the identification of the most important predictor variables, ensuring that model-based decisions are interpretable and useful for public health interventions.
Deployment considerations within SIEN
Beyond predictive performance, integrating this model into SIEN's operational pipeline raises several information-systems considerations. Regarding infrastructure, CatBoost's lightweight inference footprint allows the trained model to be hosted on a centralized server within MINSA's existing IT infrastructure, without requiring specialized hardware at individual health facilities.
In terms of API design, predictions could be exposed through a lightweight REST endpoint that receives a child's anthropometric and demographic variables and returns a risk classification together with a summarized SHAP-based explanation, allowing the existing SIEN application to consume the service with minimal architectural changes.
Regarding latency, CatBoost's inference time is on the order of milliseconds per record, making real-time classification feasible at the point of care even on modest server hardware.
Table 5. Overview of prior malnutrition-prediction studies referenced in this work
|
Study |
Best ML Technique |
Sample Records |
|
Ndagijimana et al. [11] |
Gradient Boosting |
3,814 |
|
Shen et al. [12] |
XGBoost (LASSO feature selection) |
3,380 |
|
Khan and Yunus [13] |
Hybrid Ensemble (RF, DT, XGBoost, KNN) |
56,243 |
|
Chilyabanyama et al. [15] |
Random Forest |
6,799 |
|
Tamanna et al. [22] |
Random Forest (Boruta + SHAP) |
7,910 |
Given that malnutrition risk factors and social-program coverage can shift over time, periodic retraining aligned with SIEN's regular data-update cycles (e.g., semi-annually or annually) is recommended to mitigate data drift, together with monitoring of prediction distributions to detect when retraining is warranted.
Finally, given the connectivity and staffing constraints in remote health facilities discussed in Section 3.2, the interface presented to health workers should reduce the model's output to a simple, low-bandwidth risk indicator rather than a full SHAP visualization, with the detailed explanation available on demand for supervisory or clinical review.
This study has several limitations that should be considered. First, the analysis is based on data from a single year (2024), which may limit the generalizability of the findings over time. Second, the dataset includes only children who attended MINSA health centers, introducing a potential selection bias. Third, the study is observational in nature, so causal relationships between predictors and chronic malnutrition cannot be established. Fourth, the engineered Weight_for_Age and Height_for_Age ratios, while not identical to the WHO height-for-age z-score used to clinically define chronic malnutrition, are computed from the same underlying anthropometric measurements and are therefore structurally correlated with the outcome; this should be kept in mind when interpreting their high SHAP importance, as it partly reflects this shared statistical origin rather than an independent predictive signal. Finally, the model has not been validated prospectively in real-time settings, which may affect its performance in future applications outside the dataset.
The proposed CatBoost model, combined with SHAP, demonstrated excellent predictive performance for identifying children at risk of chronic malnutrition. The model achieved high precision, recall, specificity, F1-score, and ROC-AUC, highlighting its strong discriminative capacity and robustness when applied to a large-scale dataset of 1,794,809 records from the Peruvian SIEN system. These results confirmed that the model can reliably classify cases while minimizing false positives, which is crucial for healthcare applications.
Beyond predictive accuracy, the integration of SHAP allowed for the interpretation of the most important predictor variables. This interpretability ensures that the model’s decisions are transparent and actionable, enabling health professionals and policymakers to understand the factors driving malnutrition risk and to design targeted interventions effectively.
The study also showed that anthropometric variables and derived growth rates, such as Weight_for_Age and Height_for_Age, were critical indicators in identifying chronic malnutrition. By combining these features with robust ML techniques, the model provides a comprehensive approach to analyzing large-scale health data while maintaining the quality and consistency of the dataset.
Conceptualization, Jose Yauri; Methodology, Elinar Carrillo-Riveros and Edith Guevara-Morote; Software and data collection, Emerson Navarro-Guillén; Data curation and formal analysis, Lucy Escalante-Pablo; Preparation of the first draft, Emerson Navarro-Guillén; Critical review and refinement, Jose Yauri and Juan Carlos Carreño Gamarra; Visualization and statistical validation, Diana Luján-Pérez; Project administration and supervision, Jose Yauri. The final version of the manuscript has been reviewed and endorsed by all authors.
[1] Rotella, R., Morales-Suárez-Varela, M., Llopis-González, A., Soriano, J.M. (2025). A nutritional and anthropometric analysis of the double burden of malnutrition in children under two in Madagascar. Children, 12(5): 640. https://doi.org/10.3390/children12050640
[2] Dipasquale, V., Cucinotta, U., Romano, C. (2020). Acute malnutrition in children: Pathophysiology, clinical effects and treatment. Nutrients, 12(8): 2413. https://doi.org/10.3390/nu12082413
[3] World Health Organization. (2024). Malnutrition. https://www.who.int/news-room/fact-sheets/detail/malnutrition, accessed on Feb. 26, 2026.
[4] UNICEF, WHO, and World Bank Group. (2021). Levels and trends in child malnutrition: UNICEF/WHO/The World Bank Group joint child malnutrition estimates: Key findings of the 2021 edition. World Health Organization, Geneva. https://www.who.int/publications-detail-redirect/9789240025257.
[5] National Institute of Statistics and Informatics. (2022). Chronic malnutrition affected 11.7% of the population under five years of age in 2022. https://www.gob.pe/en/institucion/inei/noticias/759081-desnutricion-cronica-afecto-al-11-7-de-la-poblacion-menor-de-cinco-anos-en-el-ano-2022, accessed on Feb. 27, 2026.
[6] National Institute of Statistics and Informatics (INEI). (2023). Peru: Demographic and family health survey 2022 - National and departmental. INEI, Lima, Peru. https://www.inei.gob.pe/media/MenuRecursivo/publicaciones_digitales/Est/Lib1898/libro.pdf.
[7] Action Against Hunger. (2024). What is Malnutrition? https://www.actionagainsthunger.org/the-hunger-crisis/world-hunger-facts/what-is-hunger/what-is-malnutrition/, accessed on March 9, 2026.
[8] Rao, B., Rashid, M., Hasan, M.G., Thunga, G. (2025). Machine learning in predicting child malnutrition: A meta-analysis of demographic and health surveys data. International Journal of Environmental Research and Public Health, 22(3): 449. https://doi.org/10.3390/ijerph22030449
[9] Islam, M.M., Kibria, N.M.S.J., Kumar, S., Roy, D.C., Karim, M.R. (2024). Prediction of undernutrition and identification of its influencing predictors among under-five children in Bangladesh using explainable machine learning algorithms. PLoS ONE, 19(12): e0315393. https://doi.org/10.1371/journal.pone.0315393
[10] Shahid, M., Yahya, M.A., Song, J.Y., et al. (2026). Machine learning vs. traditional logistic regression: Predictive performance and risk factor identification for child nutritional outcome in Pakistan. BMC Public Health, 26: 667. https://doi.org/10.1186/s12889-025-25621-9
[11] Ndagijimana, S., Kabano, I.H., Masabo, E., Ntaganda, J.M. (2023). Prediction of stunting among under-5 children in Rwanda using machine learning techniques. Journal of Preventive Medicine and Public Health, 56(1): 41-49. https://doi.org/10.3961/jpmph.22.388
[12] Shen, H., Zhao, H., Jiang, Y. (2023). Machine learning algorithms for predicting stunting among under-five children in Papua New Guinea. Children, 10(10): 1638. https://doi.org/10.3390/children10101638
[13] Khan, M.N.A., Yunus, R.M. (2023). A hybrid ensemble approach to accelerate the classification accuracy for predicting malnutrition among under-five children in sub-Saharan African countries. Nutrition, 108: 111947. https://doi.org/10.1016/j.nut.2022.111947
[14] Bitew, F.H., Sparks, C.S., Nyarko, S.H. (2022). Machine learning algorithms for predicting undernutrition among under-five children in Ethiopia. Public Health Nutrition, 25(2): 269-280. https://doi.org/10.1017/S1368980021004262
[15] Chilyabanyama, O.N., Chilengi, R., Simuyandi, M., et al. (2022). Performance of machine learning classifiers in classifying stunting among under-five children in Zambia. Children, 9(7): 1082. https://doi.org/10.3390/children9071082
[16] Abid, D.M.M.H., Haque, A., Hossain, M.K. (2021). Factors causing stunting among under-five children in Bangladesh. In Proceedings of the Fifth International Congress on Information and Communication Technology. ICICT 2020. Advances in Intelligent Systems and Computing, Springer, Singapore, pp. 45-53. https://doi.org/10.1007/978-981-15-5856-6_5
[17] Rahman, S.M.J., Ahmed, N.A.M.F., Abedin, M.M., et al. (2021). Investigate the risk factors of stunting, wasting, and underweight among under-five Bangladeshi children and its prediction based on machine learning approach. PLoS ONE, 16(6): e0253172. https://doi.org/10.1371/journal.pone.0253172
[18] Mansur, M., Afiaz, A., Hossain, M.S. (2021). Sociodemographic risk factors of under-five stunting in Bangladesh: Assessing the role of interactions using a machine learning method. PLoS ONE, 16(8): e0256729. https://doi.org/10.1371/journal.pone.0256729
[19] Shahriar, M.M., Iqubal, M.S., Mitra, S., Das, A.K. (2019). A deep learning approach to predict malnutrition status of 0-59 month’s older children in Bangladesh. In 2019 IEEE International Conference on Industry 4.0, Artificial Intelligence, and Communications Technology (IAICT), Bali, Indonesia, pp. 145-149. https://doi.org/10.1109/ICIAICT.2019.8784823
[20] Khan, J.R., Tomal, J.H., Raheem, E. (2021). Model and variable selection using machine learning methods with applications to childhood stunting in Bangladesh. Informatics for Health and Social Care, 46(4): 425-442. https://doi.org/10.1080/17538157.2021.1904938
[21] Talukder, A., Ahammed, B. (2020). Machine learning algorithms for predicting malnutrition among under-five children in Bangladesh. Nutrition, 78: 110861. https://doi.org/10.1016/j.nut.2020.110861
[22] Tamanna, T., Mahmud, S., Salma, N., Hossain, M.M., Karim, M.R. (2025). Identifying determinants of malnutrition in under-five children in Bangladesh: Insights from the BDHS-2022 cross-sectional study. Scientific Reports, 15: 14336. https://doi.org/10.1038/s41598-025-99288-y
[23] National Institute of Health - National Center for Food and Nutrition. (2024). SIEN - Nutritional status information system for children and pregnant women in Peru - INS/CENAN (National Institute of Health - National Center for Food and Nutrition). National Open Data Platform. https://www.datosabiertos.gob.pe/dataset/sien-sistema-de-informaci%C3%B3n-del-estado-nutricional-de-ni%C3%B1os-y-gestantes-per%C3%BA-inscenan-23, accessed on Feb. 27, 2026.
[24] National Institute of Health - National Center for Food and Nutrition (INS/CENAN). (2023). SIEN - Sistema de información del Estado Nutricional de niños y gestantes Perú - INS/CENAN (Instituto Nacional de Salud - Centro Nacional de Alimentación y Nutrición). OBSERVATE Perú, INS, Perú. https://observateperu.ins.gob.pe/node/108, accessed on Jul. 31, 2026.
[25] Prokhorenkova, L., Gusev, G., Vorobev, A., Dorogush, A.V., Gulin, A. (2018). CatBoost: Unbiased boosting with categorical features. In Proceedings of the 32nd International Conference on Neural Information Processing Systems, Montréal, Canada, pp. 6639-6649. https://dl.acm.org/doi/10.5555/3327757.3327770
[26] Weng, S., Fan, Z., Devnath, L. (2026). A joint optimization framework for imbalanced liver disorder prediction using CatBoost and the Butterfly optimization algorithm. AI, 7(8): 290. https://doi.org/10.3390/ai7080290
[27] Kim, S., Choi, B.K., Cho, J.S., et al. (2025). Development of machine learning models with explainable AI for frailty risk prediction and their web-based application in community public health. Frontiers in Public Health, 13: 1698062. https://doi.org/10.3389/fpubh.2025.1698062
[28] Fatade, O.B., Ajiboye, O.F., Sanusi, F.A., et al. (2026). Decision-level multimodal fusion for non-invasive diagnosis of endometriosis: Strategies, calibration, and net clinical benefit. Acadlore Transactions on AI and Machine Learning, 5(1): 11-19. https://doi.org/10.56578/ataiml050102
[29] Luque, A., Carrasco, A., Martín, A., de las Heras, A. (2019). The impact of class imbalance in classification performance metrics based on the binary confusion matrix. Pattern Recognition, 91: 216-231. https://doi.org/10.1016/j.patcog.2019.02.023
[30] Vujovic, Ž.Ð. (2021). Classification model evaluation metrics. International Journal of Advanced Computer Science and Applications, 12(6). https://doi.org/10.14569/IJACSA.2021.0120670
[31] Sokolova, M., Lapalme, G. (2009). A systematic analysis of performance measures for classification tasks. Information Processing & Management, 45(4): 427-437. https://doi.org/10.1016/j.ipm.2009.03.002
[32] Ruopp, M.D., Perkins, N.J., Whitcomb, B.W., Schisterman, E.F. (2008). Youden index and optimal cut-point estimated from observations affected by a lower limit of detection. Biometrical Journal, 50(3): 419-430. https://doi.org/10.1002/bimj.200710415