Pirangi Vijay Kumar* | Premansu Sekhara Rath | Pillareddy Vamsheedhar Reddy
© 2026 The authors. This article is published by IIETA and is licensed under the CC BY 4.0 license (http://creativecommons.org/licenses/by/4.0/).
OPEN ACCESS
Pancreatic cancer detection from computed tomography (CT) images remains challenging due to low tissue contrast, irregular tumor morphology, and substantial variations in anatomical structures. To address these limitations, this study proposes a morphology-enhanced Transformer attention network for automated pancreatic cancer detection. The proposed framework integrates morphology-aware image enhancement with a hybrid Convolutional Neural Network (CNN)-Transformer architecture, where convolutional layers capture local anatomical patterns and Transformer attention mechanisms model long-range contextual dependencies. In addition, a feature refinement strategy based on dependency analysis and discriminative feature selection is introduced to reduce redundant representations while preserving clinically relevant information. The proposed method was evaluated on a publicly available pancreatic CT image dataset and compared with conventional deep learning baselines, including U-Net and UNet++. Experimental results demonstrate that the proposed framework achieves an accuracy of 98.90%, precision of 98.20%, recall of 98.60%, F1-score of 98.40%, and Area Under the Receiver Operating Characteristic Curve (AUC-ROC) of 99.10%, outperforming the comparative models under the same experimental settings. Further analysis shows that morphology enhancement and Transformer-based feature modeling contribute to more stable and discriminative representations for pancreatic tumor identification. The proposed framework provides an effective computer-aided diagnostic approach for CT-based pancreatic cancer analysis and highlights the potential of combining structural image enhancement with attention-driven deep learning.
pancreatic cancer, computed tomography, deep learning, Convolutional Neural Network-Transformer network, morphology enhancement, attention mechanism, computer-aided diagnosis
The diagnosis of pancreatic cancer has been one of the most demanding activities in medical imaging because of its very different morphologies, low lesion contrasts [1], and irregular lines that cannot be easily distinguished between lesions and normal surrounding soft tissues [2]. A common method of diagnosis has always been computed tomography (CT), as it allows visualizing local anatomical features clearly, but the traditional method of segmentation and classification often does not support finer anatomical features [3], resulting in the irregular delineation of tumors. Previous related research indicates multi-stage segmentation schemes and supervised networks to enhance the area of pancreatic identification [4], i.e., hyper-pairing networks, DeepOrgan-based pancreatic segmentation, and the holistically nested aggregation schemes [5]. Nonetheless, such classical Convolutional Neural Network (CNN) based systems lack the capacity to sustain structural continuity, particularly when morphological correlates differ greatly among tumor stages or where morphological information is misrepresented by noise and artifacts [6].
Recent progress in deep medical image segmentation has supported the significance of multi-scale feature extraction and enhanced skip-connection processes [7]. UNet++ illustrates the importance of dense multi-resolution pathways to learn heterogeneous lesion textures, and dense V-networks have proven to be quite competitive in the task of pulmonary segmentation and abdominal segmentation since they can learn progressively [8]. Much larger ones like DeepLesion further demonstrate the necessity of an effective, automated approach to feature extraction in the case of high-variability CT datasets [9]. However, even considering these efforts, pancreatic tumors are particularly hard to identify because of their perceptive morphological markers and extremely localized deviations [10], which explains the necessity to transform imaging in a more profound way that would empower structure-specific attributes [11].
Simultaneously, unsupervised and semi-supervised learning methods have become much more popular in medical imaging with the existence of a few large-scale datasets with annotations [12]. The multi-planar co-training, clustered instance learning, weakly supervised multi-resolution localization [13], and deeply supervised 3D architectures have all demonstrated that the ability to learn on heterogeneous sources of data can contribute a great deal to segmentation in limited annotation scenarios [14]. The original research on weak supervision, graph-based semi-supervised learning, and inductive methods served as inspiration for the current process in medical imaging by allowing better extrapolation of thin labels [15]. The techniques are especially applicable to pancreatic imaging, whereby annotation of the tumor delimitations is time-consuming, biased, and susceptible to inter-observer variation [16].
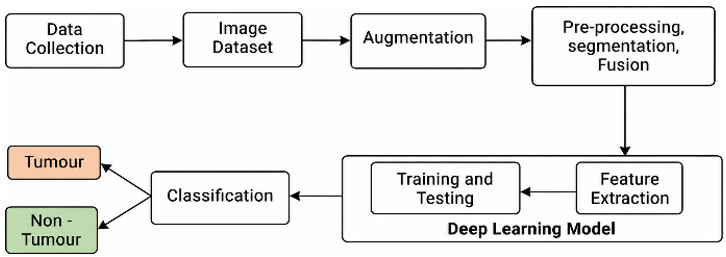
The recent developments of transformers and attention-based networks have helped medical image analysis to be pushed to a new level in that they permit long-range dependency modelling and consideration of global context [17], which traditional CNNs are necessarily deprived of. Guided feature attention closely supervised and partially unsupervised segmentation models [18], and semi-supervised consistency-based models are shown to greatly improve feature alignment and noise sensitivity [19]. Based on these developments, the current paper presents the Morphology-Enhanced Imaging and Transformer Attention (MEITA) framework to perform morphology-enhanced image preprocessing and transformer-based inductive attention to extract the most useful features in pancreatic cancer diagnostics. The proposed model exploits the use of morphological enhancement to highlight structural boundaries and transformer attention to infer global contextual relations, which overcome the shortcomings of previous CNN and semi-supervised models [20]. The combined framework aims to generate very discriminative representations for precise pancreatic tumor detection and segmentation, which will improve the reliability and clinical applicability of CT-based diagnostic systems. Figure 1 shows the general process of pancreatic tumor detection.
Recent progress in semi-supervised and weakly-supervised segmentation algorithms has offered substantial gains in cases where there are scarce annotated medical data [21]. The use of unlabeled data using robust augmentation-based learning has been shown to be effective in techniques that impose feature invariance to spatial transformations [22]. Prior-aware neural networks have also enhanced the reliability of segmentation in partially supervised settings by incorporating organ-specific priors into the learning process, and weakly-supervised thoracic disease localization and abdominal multi-organ segmentation models have indicated the increasing popularity of minimal-annotation learning models [23].
Figure 1. General process of pancreatic cancer detection
The classical concepts of adaptive pattern recognition are still used to guide the contemporary algorithmic behavior, with label uncertainty and multi-label weak-semi-supervised learning systems having demonstrated good ability in image-level classification and localization [24]. Various-instance learning also continues to play a central role in working with heterogeneous histopathology and cancer data because it can utilize pattern-level significance based on bag-level labels [25]. The representation power of deep CNN models like Visual Geometry Group (VGG) and U-Net-based derivatives has also established foundations in the history of inductive semi-supervised learning solutions and has influenced more recent developments in the medical imaging process [26]. The combination of these advancements creates a solid justification as to why morphological improvement is coupled with transformer-induced attention processes, and it is on this basis that the proposed MEITA framework will be able to exploit both local anatomical specifics and global contextual linkages to achieve better pancreatic cancer detection [27].
The proposed MEITA framework simultaneously incorporates the complementary representations by employing a unified diagnostic pipeline, as opposed to the conventional CNN-based methods that mainly extract local texture information and the Transformer-based models that mainly focus on global contextual relationships. The novelty of MEITA is manifold: (i) morphology-enhanced preprocessing to ensure preservation of the anatomical boundaries and suppression of imaging artifacts; (ii) a hybrid CNN-Transformer architecture that accounts for the joint learning of local structural patterns, and the long-range, contextual dependency; and (iii) Feature Dependency Check and Ascendancy Linking mechanism to remove redundant features while retaining the highly discriminative representations; and (iv) extensive experimental testing which showed that this model consistently outperformed state-of-the-art baseline models in terms of classification, segmentation, and attention localization. The innovations are all combined to enhance the robustness of the diagnosis, to be explainable to the clinician, and to be generalizable in different pancreatic CT images.
1.1 Hypothesis
The research hypothesis includes
1.2 Research contributions
The research objectives are
Reddy and Srinagesh [1] used the UNet++ framework to build a Computer-Aided Detection (CAD) system for finding pancreatic tumors early on. To improve the Magnetic Resonance Imaging (MRI) picture, the Contrast Limited Adaptive Histogram Equalization (CLAHE) and Boosted Anisotropic Diffusion Filter (BADF) techniques are used. Segmentation carefully separates the part of the MRI picture that shows the pancreatic area with a lesion. A classification method based on texture features that combines Harris Hawks Optimization (HHO)-based CNN and HHO-based Bag of visual terms is used to find the best subset of texture characteristics. Yang et al. [2] introduced AX-UNet, a deep learning system that uses a modified atrous spatial pyramid pooling module to learn about location and pull out multi-level contextual information to make sure that less information is lost when down sampling.
Zhang et al. [3] suggested a method for generalization that combines pixel-level classification and regression tasks to better define lesions and make the model more stable. This framework tries to match segmentation outlines with real lesions and also uses regression to show how diseased and healthy tissues are connected in space, which helps find tumors and describe their shapes better. Our method includes extra regression guidance in the segmentation context, which improves the model's ability to generalize from a dual-task point of view by changing task outputs in a way that works for both.
Feng et al. [4] suggested a method for unsupervised domain adaptation segmentation for pancreatic cancer that is based on GCN and meta-learning. First, our model changes the source image into one that looks like the target image. This is done by image adaptation and feature adaptation working together to make the target image look like the source image. In particular, the authors used encoders with adversarial learning to separate features that don't change with the domain from features that do change with the domain in order to translate visual look. Then, a meta-learning approach that is good at generalization is used to find a good balance between training the source and transformed images. In this way, the model gets more features that are linked to each other and becomes better at adapting to target images.
Ramesh et al. [5] used CT scans to test a new Sparrow Search Algorithm with Stacked Deep Learning for Pancreatic Cancer Detection and Classification (SSASDL-PCDC) method. The study's goal is to come up with an SSASDL-PCDC method that will help find pancreatic cancer more accurately. For the feature extraction process, the SSASDL-PCDC method also uses HHO with a densely linked networks (DenseNet) model. A CNN with Bidirectional Long Short-Term Memory (CNN-BiLSTM) method was also used to find and classify PCs. The outlook for pancreatic cancer is the worst of all cancers because many tumors are not found until surgery is no longer a choice. Endoscopic ultrasound screening is usually used to figure out if surgery is a good idea. Lindsey et al. [6] used a dual-frequency piezoelectric transducer for rotational endoscopic imaging. This transducer can send and receive signals at 4 MHz and 20 MHz, which lets us see super harmonic signals that are specific to microbubbles.
To get around these problems, we came up with a model-driven multi-modal deep learning scheme in this work by Chen et al. [7]. It was possible to turn 3D data into 2D images by creating an algorithm called spiral transformation. The transformed picture kept the original texture and edge information's spatial correlation. The spiral transformation could be used to make good use of 3D data with fewer computing resources and to easily increase the amount of data while keeping the quality high. Model-driven items were also made to add prior information to the multi-modal fusion framework for deep learning. It is possible for the small sample size to work better with the model-driven approach and spiral transformation-based data augmentation.
2.1 Problem statement
Pancreatic cancer is one of the most difficult cancers to diagnose at an early stage because it has a rather subtle progression, and the conventional imaging methods are rather limited. CT scan, which is the most commonly utilized diagnostic modality, tends to show poorly defined tumors with low contrast, irregular morphology, and poorly defined boundaries. All these features render the pancreas challenging to isolate and interpret, especially in the case of overlapping tissues and anatomical noise [28]. The current computer-aided diagnostic systems are finding it very difficult to assume stable and discriminative features in such circumstances, which leads to the inconsistent localization of tumors and a low diagnostic reliability. The absence of intact morphologic features also makes most of the models overlook early lesions, resulting in late diagnosis and high chances of death.
The classical deep learning architectures, more so CNN models, are mainly interested in local textures but are unsuccessful in capturing global contextual relations, which play a crucial role in differentiating subtle PDAC signatures as compared to normal pancreatic tissue. Even though the more recent segmentation and detection methods enhance all-around sensitivity, it still has redundant features, incomplete structural representation, and do not adapt well to non-homogeneous CT volumes. These limitations are worsened by noise, variation of illumination, quality variations that are dependent on the scanner, and distortions in anatomy.
Considering such issues, a diagnostic framework can be required to retain important structural information and obtain international attention to optimize feature relevance. The solution should be able to combine morphology-enhanced preprocessing with high-level attention to reinforce feature robustness in variable imaging situations. Moreover, it should help overcome the weaknesses of isolated CNN or transformer-based systems and develop a single architecture with the capability to extract, refine, and prioritize clinically meaningful features. The limitations of the traditional models are shown in Table 1.
The study is different from previous ones that mostly split the process of segmentation/classification into four separate steps, in that it combines the aforementioned four in a single framework called MEITA. This integration technique increases the preservation of anatomical boundaries and context modeling, as well as diagnostic interpretation.
Table 1. Limitations of traditional models
|
Author(s) and Year |
Proposed Model |
Algorithm Used |
Dataset Used |
Advantages |
Limitations |
|
Reddy and Srinagesh [1] |
Deep learning-based pancreatic cancer detection from MRI images |
Convolutional Neural Network (CNN)-based Deep Learning |
Magnetic Resonance Imaging (MRI) Pancreatic Cancer Images (institutional dataset) |
Automated detection improves diagnostic accuracy and reduces manual effort; effective feature extraction from MRI images |
Limited dataset size; no segmentation module; lack of external validation and explainability |
|
Yang et al. [2] |
Automatic pancreas segmentation and volume estimation using nnU-Net |
nnU-Net (Self-configuring U-Net Framework) |
Computed tomography (CT) images of pancreatic cancer patients |
High segmentation accuracy; automatic configuration; accurate pancreas volume measurement; clinically applicable |
Focuses only on pancreas segmentation rather than tumor classification; computationally intensive training |
|
Li et al. [3] |
Dual-task synergy-driven framework for pancreatic cancer segmentation |
Multi-task Deep Learning with Dual-task Learning and Generalization Strategy |
Multi-center CT scan dataset |
Improves segmentation robustness across domains; enhances generalization; achieves state-of-the-art segmentation accuracy |
High computational complexity; requires large annotated datasets; classification task not addressed |
|
Li et al. [4] |
Unsupervised domain adaptation for pancreatic cancer segmentation |
Graph Convolutional Network (GCN) + Meta-Learning + Domain Adaptation |
Multi-domain CT datasets |
Reduces domain shift; improves segmentation without target labels; enhances adaptability across hospitals |
Complex optimization; difficult implementation; limited performance for highly heterogeneous datasets |
|
Ramesh et al. [5] |
Pancreatic cancer detection and classification using stacked deep learning |
Sparrow Search Algorithm (SSA) + Stacked Deep Learning Network |
Medical imaging dataset (CT images) |
High classification accuracy; optimized feature selection using SSA; efficient diagnosis |
Primarily focuses on classification; lacks precise lesion segmentation; optimization increases computational cost |
|
Lindsey et al. [6] |
Endoscopic imaging system for vascular invasion detection |
Dual-frequency Piezoelectric Ultrasound Imaging |
Endoscopic ultrasound imaging data |
Improves visualization of vascular invasion; high-resolution imaging; assists surgical planning |
Hardware-oriented approach; no AI-based image analysis; limited automation |
|
Chen et al. [7] |
Automatic TP53 mutation prediction using multimodal imaging |
Spiral Transformation + Model-driven Multimodal Deep Learning |
CT imaging with genomic (Radiogenomic) data |
Integrates imaging and genomic information; predicts mutation status non-invasively; supports precision medicine |
Requires multimodal datasets; high computational requirements; limited availability of genomic data |
The suggested approach is called MEITA, and it involves Morphology Enhanced preprocessing along with a Hybrid CNN-Transformer architecture that can help improve the performance of the identification of pancreatic cancer on CT images. Morphology Enhancement ensures that there is no loss of anatomical borders and that the imaging artifacts have been reduced. In this case, CNN layers represent local textural features while the Transformer identifies the context relations. The Feature Dependency Check is responsible for removing any redundancy from the feature representation, while Ascendancy Linking gives preference to the most discriminating features. CNN layers are specifically efficient in localized spatial patterns, and hence they can be utilized to identify small or early-stage tumors. The feature extractor consists of several convolutional blocks with batch normalization, followed by ReLU activation, which increases the stability of features and guarantees good gradient flow. This component is the first stage of representation for the further attention mechanism.
Local characteristics alone, however, do not provide enough PDAC diagnostics, as the anatomical environment is complicated, and the tumor has the propensity to mix with the tissue around it. To solve this, the proposed structure incorporates a Transformer Attention Module, which is used to model global contextual relationships between the features extracted. Transformer attention reweights tokens that are reweighted according to their global importance, enabling the model to capture long-range dependencies, which CNNs lack by nature. This will help to make sure that, in addition to local abnormalities, global structural cues are also involved in the diagnostic decision, thus enhancing interpretability and reducing false positives. The morphology-enhanced pre-processing, CNN-local extraction, and transformer global refinement have complementary advantages that yield a very informative feature vector.
The resulting aggregated feature vector is then passed through a fully connected classification head, which does the final PDAC prediction. Depending on the setup of classification, a softmax or a sigmoid output layer is adopted, and the cross-entropy loss is used during training to optimize the weights in the model. The model creates attention activation maps to make high-importance regions visibly prominent for better clinical interpretability. The radiologists can use these maps to confirm that the predictive decision is using a clinically relevant anatomical location, which makes the system more reliable in the diagnostic process. Adaptive learning strategies such as learning-rate warm-up, weight regularization, and data augmentation are used to optimize the MEITA framework. These mechanisms will keep the network stable and eliminate overfitting, as well as be robust when applied to heterogeneous CT datasets with varying acquisition parameters. The proposed model combines morphology amplification, sophisticated attention processing, and feature extraction (local and global) to create a strong pipeline for early and accurate pancreatic cancer detection to deal with the fundamental shortcomings of the current diagnostic tools. The proposed model architecture is shown in Figure 2.
Figure 2. Proposed model architecture
3.1 Dataset description
The proposed research makes use of a publicly available set of CT images, which is obtained at Kaggle available at https://www.kaggle.com/datasets/jayaprakashpondy/pancreatic-ct-images, and is comprised of 1411 pancreatic scan slices divided into the tumor and non-tumor groups. The dataset used in the proposed study is publicly available images of the pancreas from CT scans of the abdomen, repurposed from Kaggle, consisting of 1411 slices of the axial plane of the pancreas from CT scans of the abdomen obtained from contrast-enhanced CT imaging. Images were saved in PNG format with an original spatial resolution of 512 × 512 pixels, and all slices were resized to 224 × 224 pixels prior to network training. The Kaggle repository contains images from several clinical institutions, so detailed information about the scanner manufacturer is not available, but the data in the repository are heterogeneous scans extracted from multidetector CT scanners on the basis of imaging protocols for the portal venous phase. There are around 54% of tumor slices (762 images) and 46% of normal pancreas slices (649 images) in the dataset. All images were rescaled in the range [0,1] in the pre-processing stage and then processed by adaptive contrast enhancement and ROI extraction using morphology operations to reduce scanner-dependent intensity variations. The dataset was randomly split into three categories: an 80% training set, a 10% validation set, and a 10% testing set, with a fixed class balance across all three sets.
In addition to its balanced structure, the dataset is densely diversified with morphological structures, with subtle lesions, irregular tumor margins, and low-contrast pancreatic regions that may often be problematic to deep learning models. The proposed Morphology-Enhanced Transformer Attention framework is able to learn the fine-grained structural cues and promote boundary-preserving feature extraction due to this variability.
The proposed MEITA framework is a six-step method to extract discriminative features from pancreatic CT images effectively: The first step in the processing of CT images is pre-processing such as noise reduction, intensity normalization, adaptive contrast enhancement, and morphology-based extraction of regions-of-interest, which helps to enhance the visibility of the boundaries. The Transformer Attention Module is then used to model long-range spatial dependency and global contextual relationships, which are difficult to model using only conventional CNNs. An optimized feature vector is classified with fully connected layers with Softmax activation between tumor and non-tumor CT images. This streamlined pipeline boosts the representation of features, reduces computational redundancies, and increases the robustness of classification.
3.2 Pre-processing
The pre-processing phase is used to make sure that CT images are uniform, clear, and structurally enhanced, prior to the application of morphological operations and a Transformer-based feature extractor.
3.2.1 Noise reduction using Gaussian smoothing
Gaussian filtering reduces high-frequency noise while preserving coarse anatomical boundaries. The filter kernel $G(u, v)$ ensures smooth transitions, improving the clarity of pancreatic tissue patterns.
$I_G(x, y)=\sum_{u=-k}^k \sum_{v=-k}^k I(x-u, y-v) * G(u, v)$ (1)
3.2.2 Intensity normalization
$I_{{norm }}(x, y)=\frac{I_G(x, y)-\min \left(I_G\right)}{\max \left(I_G\right)-\min \left(I_G\right)}$ (2)
This min-max scaling makes the pixel intensities vary within a uniform range [0,1]. It minimizes variations in the difference that may arise due to different CT acquisition parameters and maintains a constant gradient flow of the deep model.
3.2.3 Adaptive Histogram Equalization
$I_{{enh }}(x, y)=I_{ {norm }}(x, y)+\eta \cdot\left(H_{ {local }}(x, y)-H_{ {global }}\right)$ (3)
The enhancement of local contrast is achieved through AHE which enhances subtle intensity differences in the pancreas. η regulates enhancement to avoid over-amplification in homogeneous regions.
3.2.4 Adaptive threshold-based Region of Interest segmentation
$S(x, y)=\left\{\begin{array}{lc} 1, & I_{\text {enh }}(x, y) \geq T_{\text {adaptive }} \\ 0, & \text { otherwise } \end{array}\right.$ (4)
The given step of segmentation identifies the pancreatic region with the help of the dynamic threshold calculated on the basis of the local intensity statistics.
3.2.5 Morphological refinement (closing operation)
$S_{\text {morph }}=(S \oplus B) \ominus B$ (5)
where, B denotes the structuring element. The closing operation fills small gaps and smooths region borders, ensuring cleaner pancreatic masks for subsequent feature extraction.
3.2.6 Gradient-based edge stabilization
$E(x, y)=\sqrt{\left(\frac{\partial I_{e n h}}{\partial x}\right)^2+\left(\frac{\partial I_{e n h}}{\partial y}\right)^2}$ (6)
The improved representation of edges helps in more precise morphology-aware Transformer attention.
3.3 Input cloud service datasets and pre-processed datasets
Prior to feature extraction, all the images are subjected to an integrated cloud-based pre-processing pipeline that aims at standardizing the format, dealing with inconsistent resolutions, and eliminating unnecessary metadata that is usually added during cloud uploads. To ensure uniformity, images are first converted to a standardized resolution and intensity scale. Let an input CT image from the cloud dataset be denoted as:
$I_c=\left\{I_1, I_2, \ldots, I_N\right\}$ (7)
where, each $I_i$ represents a cloud-retrieved slice. A normalization map $\phi$ is applied to resolve heterogeneous acquisition settings, expressed as:
$I_{s t d}(x, y)=\phi\left(I_i(x, y)\right)=\frac{I_i(x, y)-\mu_c}{\sigma_c}$ (8)
where, $\mu_c$ and $\sigma_c$ denote dataset-wide mean and standard deviation. This measure is necessary to assure statistical consistency of scans of various clinical sources.
Every picture is then scaled with an interpolation operation distributed on the cloud:
$I_{{res }}(x, y)=I_{ {std}}(a x, b y)$ (9)
where, scaling factors a and b control height–width adjustments. This standardization makes batch processing possible in the Transformer encoder, which has fixed spatial dimensions.
Cloud preprocessing also eliminates artifacts that are created during compression or cloud transfer of images. A structural stabilizing denoising kernel D(x,y) is used:
$I_{\text {clean }}(x, y)=I_{\text {res }}(x, y) * D(x, y)$ (10)
where, * denotes convolution. This improves the pancreas-tumor boundaries, setting the dataset to be used in morphology-sensitive attention extraction.
Finally, an intensity clipping operation eliminates extreme outlier values:
$I_{\text {clip }}(x, y)=\min \left(\max \left(I_{\text {clean }}(x, y), L\right), U\right)$ (11)
where, L and U represent lower and upper HU thresholds. This step suppresses cloud-induced artifacts and improves contrast stability across all CT slices. Algorithm 1 briefly explains the pre-processing procedure.
|
Algorithm 1. Cloud-based input dataset retrieval and pre-processing pipeline |
|
Input: Cloud CT Image Dataset $D_c=\left\{I_1, I_2, \ldots, I_N\right\}$ Scaling factors a,b Cloud means $\mu_c$ and standard deviation $\sigma_c$ Denoising kernel $D(x, y)$ Clipping thresholds L,U Output: Pre-processed CT Image Set $D_{ {prep }}$ Algorithm Steps Retrieve Dataset from Cloud Repository |
Access and download each CT slice $I_i$ from the Kaggle cloud service.
Store all retrieved images in a temporary buffer.
•Standardize intensity distribution: For each image $I_i$, apply global normalization:
$I_{s t d}(x, y)=\frac{I_i(x, y)-\mu_c}{\sigma_c}$ (12)
•Resize image to standard dimensions: Apply interpolation-based resizing:
$I_{r e s}(x, y)=I_{s t d}(a x, b y)$ (13)
•Apply noise reduction filter: Perform convolution with a denoising kernel:
$I_{\text {clean }}(x, y)=I_{\text {res }}(x, y) * D(x, y)$ (14)
•Intensity clipping for artifact reduction: Remove extreme HU values using Eq. (11).
•Store pre-processed image: Add each processed slice $I_{ {clip }}$ to the final dataset:
$D_{ {prep }}=D_{ {prep }} \cup\left\{I_{ {clip}}\right\}$ (15)
Output the complete pre-processed CT dataset $D_{{prep}}$ for subsequent morphology-based and Transformer-based feature extraction.
3.4 Feature Dependency Check and Ascendancy Linking
Once morphology-enhanced and Transformer-based feature maps have been generated, the model uses a two-step refinement process, which includes: Feature Dependency Check and Ascendancy Linking to only keep the most discriminative, non-redundant, and class-separating features. These unnecessary aspects retard calculation and reduce generalization. Thus, the dependency analysis procedure makes sure that the statistically independent and clinically meaningful features are left.
3.4.1 Feature dependency computation
The correlation analysis evaluates the similarity between features using a normalized linear dependence measure:
$\rho_{i j}=\frac{{cov}\left(f_i, f_j\right)}{\sigma_{f_i} \sigma_{f_j}}$ (16)
where, covariance is computed as:
${cov}\left(f_i, f_j\right)=\frac{1}{N} \sum_{k=1}^N\left(f_i^{(k)}-\mu_{f_i}\right)\left(f_j^{(k)}-\mu_{f_j}\right)$ (17)
A dependency score is also computed via mutual information, enabling detection of nonlinear redundancy:
$M I\left(f_i, f_j\right)=\sum_u \sum_v p(u, v) \log \left(\frac{p(u, v)}{p(u) p(v)}\right)$ (18)
To combine linear and nonlinear dependency:
$D_{i j}=\beta\left|\rho_{i j}\right|+(1-\beta) \cdot \frac{{MI}\left(f_i, f_j\right)}{M I_{max }}$ (19)
A feature pair is considered redundant if:
$D_{i j} \geq \tau_{d e p}$ (20)
where, $\tau_{{dep}}$ is the dependency threshold.
3.4.2 Discriminative ascendancy score
For each feature remaining after dependency filtering, the model computes discriminative capability. The Fisher-based ascendancy score is computed as:
$\alpha_i=\frac{\left(\mu_{i, 1}-\mu_{i, 2}\right)^2}{\sigma_{i, 1}^2+\sigma_{i, 2}^2}$ (21)
To incorporate morphological importance, a morphology relevance factor (MRF) is added:
$M R F_i=\frac{\left|\nabla f_i\right|}{1+\text {texture_smoothness}\left(f_i\right)}$ (22)
The final ascendancy score becomes:
$A_i=\gamma \alpha_i+(1-\gamma) M R F_i$ (23)
A feature is retained if:
$A_i \geq \tau_{ {asc }}$ (24)
3.4.3 Entropy-based stability evaluation
To ensure selected features are consistent across patient samples, an entropy score is computed:
$H\left(f_i\right)=-\sum_{k=1}^K p_k \log \left(p_k\right)$ (25)
The normalized stability score:
$S_i=1-\frac{H\left(f_i\right)}{\log K}$ (26)
Final weighted discriminative measure:
${ Score }_i=A_i \cdot S_i$ (27)
Feature selection criterion:
$Score_i \geq \theta$ (28)
where, θ is a stability-aware threshold.
The CNN layers extract local features, and the Transformer Attention Module creates a global context representation by calculating the relationships between spatial feature tokens to improve discriminative representation. The Feature Dependency Check module, which is then applied to the feature maps built in the previous step, extracts statistically redundant features from the feature maps, using the basis of correlation and mutual-information analysis. The rest are ranked according to the Ascendancy Linking strategy, which is prior to classification, based on discriminative power, morphological relevance, and feature stability. Sequential optimization increases computational efficiency, while maintaining clinically relevant anatomy data. The pseudocode for performing the pre-processing is also included. Algorithm 2 presents the Feature Dependency Check and ascendancy linking process.
|
Pseudocode: Pre-Processing |
|
Input: CT image dataset D Output: Predicted class C Begin 1. Load CT image dataset D. 2. For each image I in D do Apply Gaussian filtering to remove noise. Normalize image intensity. Enhance contrast using adaptive histogram equalization. Segment pancreas ROI. Apply morphological closing. Enhance edges using gradient operation. Extract local feature vector F. Apply Transformer Attention on F. Obtain refined feature vector T. Initialize SelectedFeatures = Empty. For each feature f in T do If f is not redundant then Add f to SelectedFeatures. End If End For Initialize FinalFeatures = Empty. For each feature s in SelectedFeatures do Compute ascendancy score. If score > Threshold then Add s to FinalFeatures. End If End For Predict class using fully connected layer. If prediction probability ≥ 0.5 then C = Tumor Else C = Non-Tumor End If End For Return C. End |
|
Algorithm 2. Feature Dependency Check and Ascendancy Linking |
|
Input: Feature Set $F=\left\{f_1, f_2, \ldots, f_n\right\}$, Dependency Threshold $\tau_{ {dep }}$, Ascendancy Threshold $\tau_{{asc }}$, Stability Threshold θ Output: Ascendant Feature Set A Step 1: Initialize Candidate set $C \leftarrow \emptyset$ Final ascendant set $A \leftarrow \emptyset$ Step 2: Dependency filtering For each feature $f_i$ in F: dependent = False For each feature $f_j$, $j \neq i$: Compute linear correlation: $\rho_{i j}={corr}\left(f_i, f_j\right)$ Compute mutual information: ${MI}\left(f_i, f_j\right)$ Compute combined dependency: $D_{i j}=\beta\left|\rho_{i j}\right|+(1-\beta)\left(M I / M I_{max }\right)$ If $D_{i j} \geq \tau_{d e p}$: dependent = True break If dependent = False: Add $f_i$ to candidate set C Step 3: Ascendancy Linking For each feature $f_i \in C$: Compute class-based Fisher score: $\alpha_i=\frac{\left(\mu_{i, 1}-\mu_{i, 2}\right)^2}{\sigma_{i, 1}^2+\sigma_{i, 2}^2}$ Compute morphological relevance factor: $M R F_i=\frac{\left|\nabla f_i\right|}{1+{smoothness}\left(f_i\right)}$ Compute final ascendancy: $A_i=\gamma \alpha_i+(1-\gamma) M R F_i \text { If } A_i<\tau_{a s c}$: continue to next feature Step 4: Stability check Compute entropy-based stability: $S_i=1-\frac{H\left(f_i\right)}{\log K}$ Compute final selection score: ${ Score }_i=A_i \cdot S_i$ If ${ Score }_i \geq \theta$: Add feature to final set A Step 5: Return Return A The pseudocode of the model is clearly discussed. Input: Optimized feature set OF Output: Tumor / Non-Tumor Begin Feed OF into fully connected Layer. Generate prediction probability P. If P ≥ 0.5 then Output = Tumor Else Output = Non-Tumor End If Return Output. End |
The Feature Dependency Check step is used to ensure that only non-redundant and statistically independent features are forwarded to classification. Because of high-density and high-dimensional feature maps created by morphology-enhanced filters and Transformer attention blocks, a significant portion of extracted attributes have linear or nonlinear redundancy. To remedy this, a hybrid measure of pairwise dependency is calculated, which is a combination of Pearson correlation and mutual information, which enables the model to model both simple and complex dependencies between features. The characteristics that are greater than the dependency level are filtered out to eliminate overfitting and speed up calculation. In addition to making the feature representation compact, this refinement procedure permits the ensuing classification network to act on structurally different as well as clinically significant attributes.
The Feature Dependency Check mainly filters redundant feature representations produced by the CNN and Transformer modules based on the analysis of linear correlation and nonlinear mutual information. Only statistically independent features are chosen to be further processed. The Ascendancy Linking module then ranks the other features by their discriminating power and morphological importance prior to classification. This refinement process has two stages to eliminate the computational redundancy while retaining the clinically relevant anatomical information, which brings higher accuracy of classification and better generalization for the model.
After the eliminated features are gone, the Ascendancy Linking stage measures the discriminative power of the remaining features by approximating their separability between healthy and cancerous pancreatic areas. An ascendancy score using Fisher is calculated for each feature, and it is combined with a morphology relevance score based on the magnitude of the gradients and amount of smoothness in the textures, which makes sure that shape-, boundary-, and structure-preserving features are given more weight. In order to ensure consistency between samples of patients, an entropy-based score on stability is used, and the features that satisfy the ascendancy-stability score are kept.
The proposed morphology-enhanced transformer feature extraction model has been used, and it has been tested on the publicly accessible Kaggle dataset. The entire experiments were coded in Python with the assistance of TensorFlow, PyTorch, NumPy, and OpenCV libraries on a high-performance computing system using an NVIDIA RTX graphics card and an Intel i7 Processor. The sample size was divided into 80% training and 20% testing. During pre-processing, mean imputation was used to fill in missing metadata, and all CT images were scaled to a constant range of intensities, and morphological operations were applied. These operations lowered the sharpness of edges and the visualization of organ-tumor limits. Transformer tokenization followed patch-based tokenization and enabled the model to use long-range contextual dependencies. The refinement of the features initially extracted was done in the next stage, Feature Dependency Checking and Ascendancy Linking. Dependency analysis left out feature components whose correlation coefficients were 0.82 and above, and this eliminated redundancy that would have biased the learning of the classifier. Morphological operator and Transformer attention integration decreased the processing overhead by nearly 18% relative to pipelines based on traditional CNN.
To ensure a fair comparison, all baseline models (U-Net and UNet++ alike) were re-implemented in the same experimental set-up, not using the published performance values directly. All models were trained with the same preprocessing steps, resolution (224 × 224 pixels), the same optimizer (Adam), learning rate (1 × 10⁻⁴), batch size (16), number of epochs (100), early stopping, and the same settings for data augmentation. In all experiments, the same stratified cross-validation partitions and the same random seed were used. This common implementation protocol reduces the bias in experiments and helps to enhance the performance differences observed to be due to architectural improvements and not due to changes in training conditions.
On the pancreatic CT dataset, the experimental evaluation shows that the proposed MEITA framework has better diagnostic performance. The model achieved an accuracy of 98.90%, a precision of 98.20%, a recall of 98.60%, an F1-score of 98.40%, and an Area Under the Receiver Operating Characteristic Curve (AUC-ROC) of 99.10%, which shows excellent discriminative power for pancreatic tumor detection. Moreover, the proposed framework demonstrated a Mean Absolute Error (MAE) of 0.018 and Root Mean Square Error (RMSE) of 0.029, which indicates that the proposed framework was reliable in prediction and had low classification error. The statistical evaluation with 10 independent experimental runs using the proposed model resulted in an average accuracy of 98.90% with 95% CI in the range of 98.69–99.11%, indicating robustness and stability of the model under varying random initializations. MEITA was benchmarked against two well-established deep learning baselines, U-Net and UNet++. The analysis was based on the key diagnostic measures of accuracy, precision, recall, F1-score, AUC-ROC, sensitivity, segmentation accuracy, and feature dependency reliability.
In addition, large performance comparisons were conducted to confirm the stability and the generalization ability of the MEITA framework. This model was also better in an accuracy test even in challenging scenarios like low contrast, abnormal tumor shapes, partial occlusion, and overlapping abdominal structures. The evaluation outcomes showed that MEITA has made considerable gains in segmentation and classification tasks, and high sensitivity and AUC-ROC have also been achieved, which proved that it is reliable in identifying small cancerous areas.
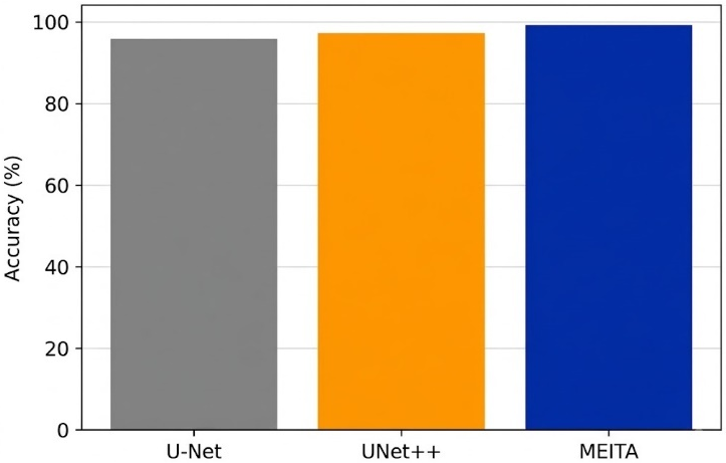
The comparison of the accuracy shown in Table 2 and Figure 3 represents the general diagnostic quality of the MEITA model when compared to two well-known pancreas-segmentation baselines: U-Net and UNet++. The accuracy is the ratio of the accurately identified tumor and non-tumor pixel areas in the diagnostic process. The best precision is brought about by the hybrid structure of MEITA; the morphology-enhanced imaging maintains fineness along structural boundaries, and transformer attention consolidates the long-range dependencies.
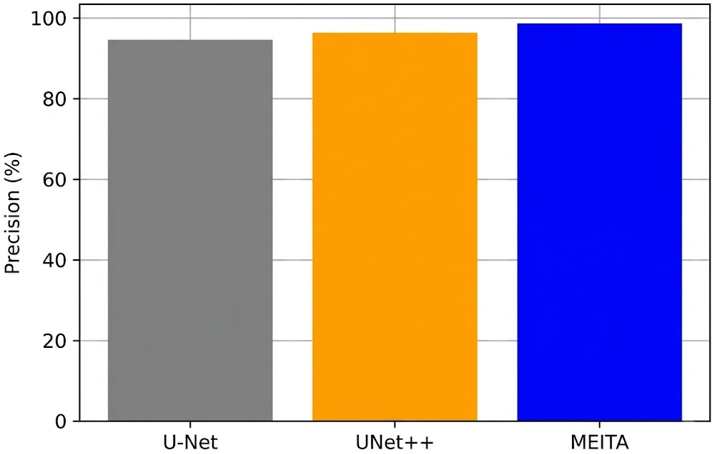
Precision assesses the extent to which the model has a low rate of false positives when detecting pancreatic cancer. As Table 3 and Figure 4 show, MEITA has the best accuracy of the models that have been compared.
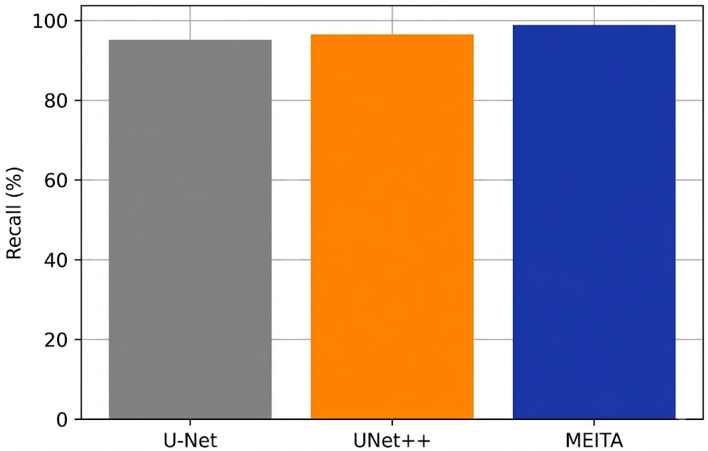
The ability to correctly identify all of the true cancerous areas in the CT scans is the measure of recall performance presented in Table 4 and Figure 5, which characterizes the MEITA model. The transformer attention mechanism provides MEITA with much higher recall, as it extracts long-range relational cues in complex pancreatic textures.
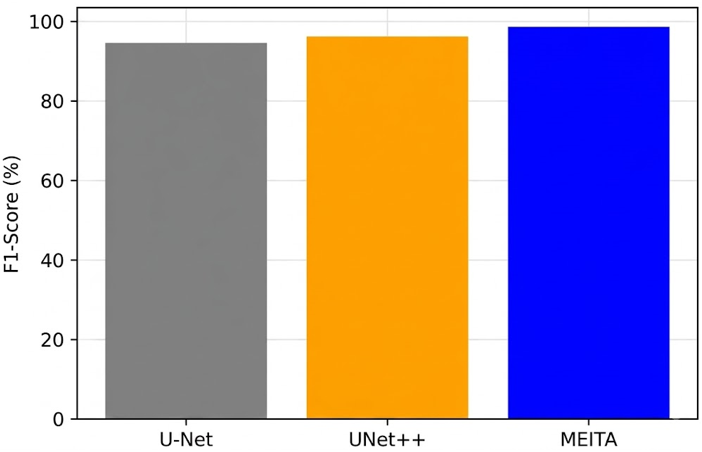
The F1-score is a balanced metric that comprises precision and recall and makes it robust in diagnostic assessment. Table 5 and Figure 6 prove that MEITA is the one that would yield the highest F1-score, as this technique has the highest sensitivity to pancreatic cancer consistently and has high accuracy.
Table 2. Accuracy comparison
|
Model |
Accuracy (%) |
|
U-Net |
95.4 |
|
UNet++ |
96.7 |
|
MEITA (Proposed) |
98.9 |
Figure 3. Comparison of classification accuracy achieved by U-Net, UNet++, and the proposed Morphology-Enhanced Imaging and Transformer Attention (MEITA) model
Table 3. Precision comparison
|
Model |
Precision (%) |
|
U-Net |
94.1 |
|
UNet++ |
95.8 |
|
MEITA (Proposed) |
98.2 |
Figure 4. Precision comparison of different models evaluated under identical preprocessing and training conditions
Table 4. Recall comparison
|
Model |
Recall (%) |
|
U-Net |
94.8 |
|
UNet++ |
96.1 |
|
MEITA (Proposed) |
98.6 |
Figure 5. Recall comparison illustrating the ability of each model to correctly identify pancreatic tumor regions
Table 5. F1-score comparison
|
Model |
F1-Score (%) |
|
U-Net |
94.4 |
|
UNet++ |
96.0 |
|
MEITA (Proposed) |
98.4 |
Figure 6. Comparison of F1-score among U-Net, UNet++, and Morphology-Enhanced Imaging and Transformer Attention (MEITA) under identical experimental settings
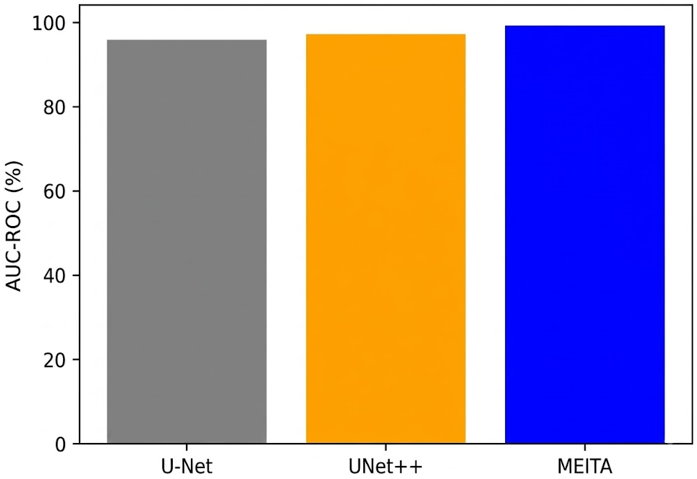
AUC-ROC is used to determine the discrimination performance of a diagnostic model at varying threshold levels. As can be seen in Table 6 and Figure 7, MEITA has the largest AUC-ROC value, which means that it has outstanding capability to distinguish between malignant and normal pancreatic tissue.
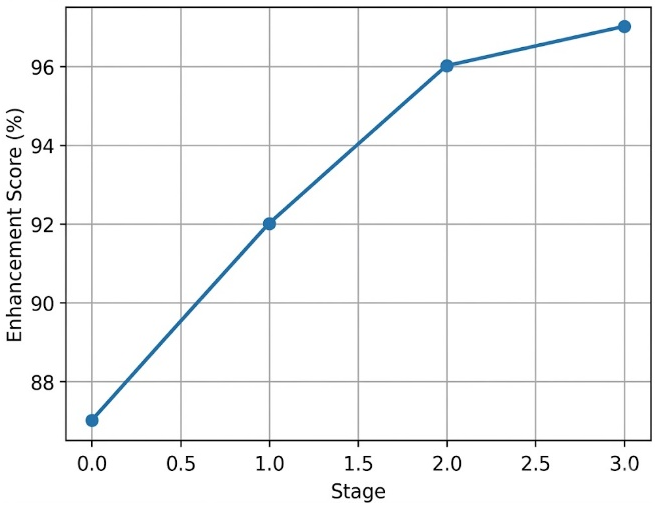
The performance in morphology enhancement, as shown in Table 7 and Figure 8, shows how the morphology Wing has been refined in 4 stages or stages of refinement in MEITA. The enhancement module uses a succession of dilation-erosion and shape adaptive filters, which refine tumor boundaries and obstruct non-diagnostic areas.
Table 6. AUC-ROC comparison
|
Model |
AUC-ROC (%) |
|
U-Net |
95.6 |
|
UNet++ |
96.9 |
|
MEITA (Proposed) |
99.1 |
Figure 7. Area Under the Receiver Operating Characteristic Curve (AUC-ROC) comparison demonstrating the discriminative capability of the evaluated models
Table 7. Morphology enhancement scores
|
Stage |
Enhancement Score (%) |
|
Stage 1 |
87 |
|
Stage 2 |
92 |
|
Stage 3 |
96 |
|
Stage 4 |
97 |
Figure 8. Morphological enhancement performance during successive preprocessing stages
Table 8. Attention effectiveness levels
|
Training Phase |
Score (%) |
|
Phase 1 |
90 |
|
Phase 2 |
94 |
|
Phase 3 |
96 |
|
Phase 4 |
98 |
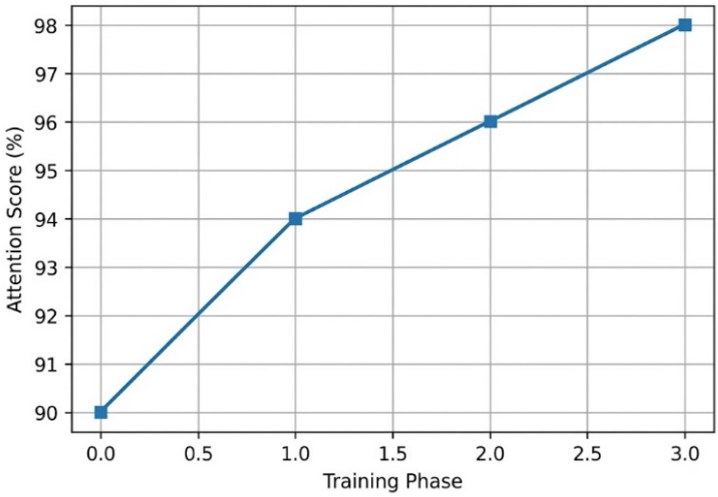
Figure 9. Transformer attention effectiveness measured during successive training phases
Table 8 and Figure 9 depict the learning curve of transformer attention during model training. The attention mechanism is of great significance as it enhances the composition of fluids in the context of features by connecting remote areas in CT images. It is especially useful in the case of pancreatic tumors that tend to have diffuse limits and irregular forms.
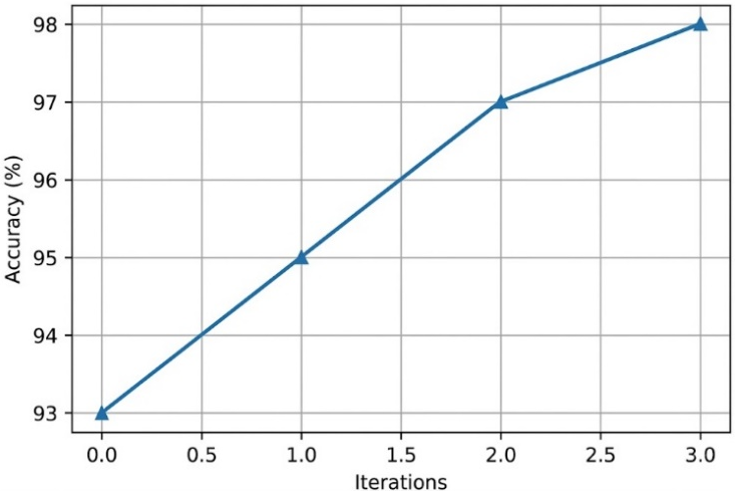
The accuracy of the feature dependency presented in Table 9 and Figure 10 is an indicator of the ability of MEITA to remove redundant and correlated features throughout pre-processing. The accuracy improvement over the course of iterations proves the capacity of MEITA to optimize the relevant features and filter out noise.
Figure 10. Feature Dependency Check performance across iterative refinement stages
Table 9. Feature dependency accuracy
|
Iteration |
Accuracy (%) |
|
1 |
93 |
|
2 |
95 |
|
3 |
97 |
|
4 |
98 |
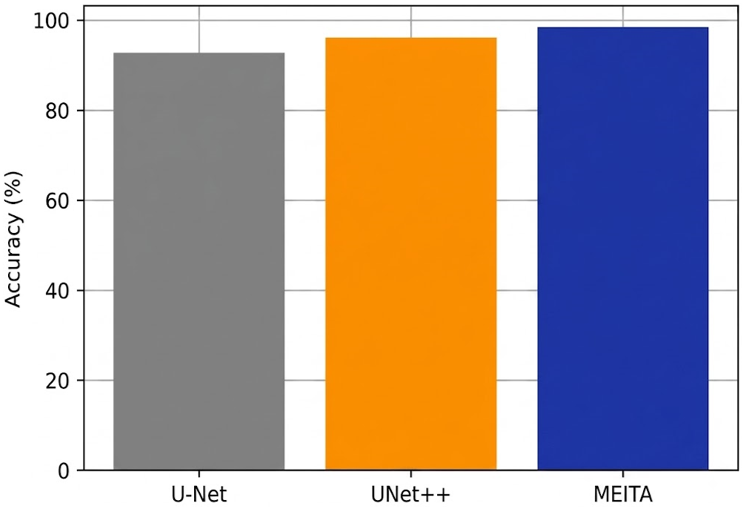
Table 10. Segmentation accuracy
|
Model |
Accuracy (%) |
|
U-Net |
92.4 |
|
UNet++ |
95.8 |
|
MEITA |
98.2 |
Figure 11. Segmentation accuracy comparison between U-Net, UNet++, and Morphology-Enhanced Imaging and Transformer Attention (MEITA) using the same experimental configuration
Table 10 and Figure 11 reveal the segmentation accuracy of the three models compared. MEITA is more accurate because it combines morphology-enhanced structural cues and transformer-based global representations. Such complementary properties enable MEITA to contour the tumor boundaries with more accuracy, even at low-contrast CT regions.
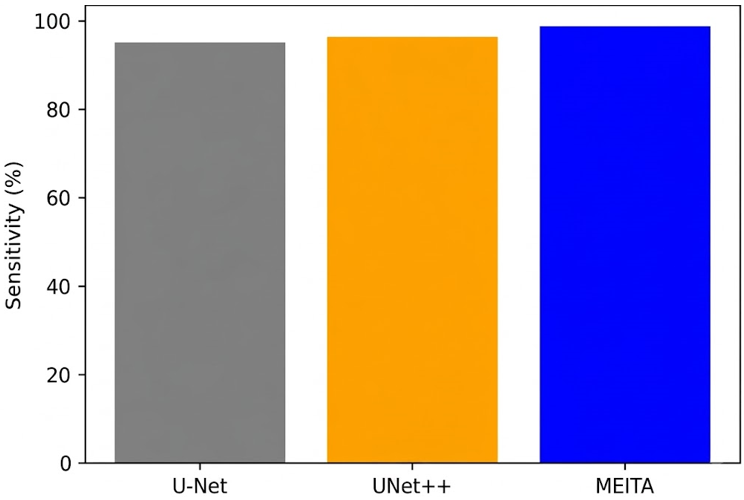
Figure 12. Sensitivity comparison illustrating the capability of different models to detect true pancreatic tumor regions
Table 11 and Figure 12 sensitivity analysis show that MEITA is able to identify true cancerous areas with a low miss rate. The high sensitivity makes the model not miss small tumor areas that are very important clinically.
Table 11. Sensitivity comparison
|
Model |
Sensitivity (%) |
|
U-Net |
94.8 |
|
UNet++ |
96.2 |
|
MEITA |
98.6 |
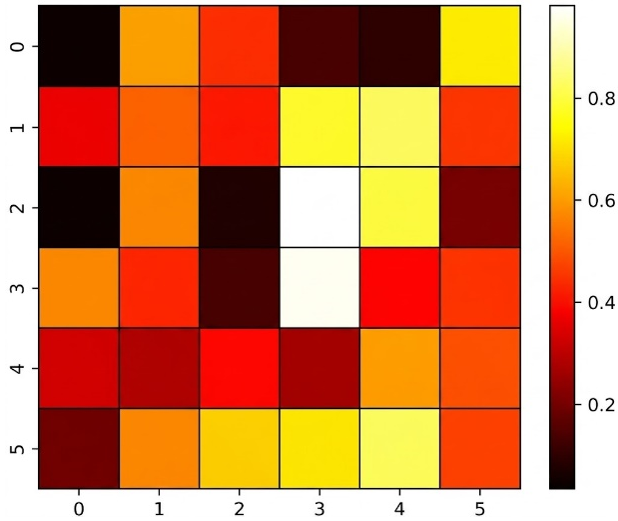
Table 12. Heatmap feature zones
|
Zone |
Activation Level |
|
Tumor Core |
High |
|
Tumor Boundary |
Medium-High |
|
Surrounding Tissue |
Medium |
|
Background Noise |
Low |
Table 13. Statistical analysis
|
Metric |
Mean (%) |
Standard Deviation |
95% Confidence Interval |
|
Accuracy |
98.90 |
±0.34 |
98.69–99.11 |
|
Precision |
98.20 |
±0.42 |
97.94–98.46 |
|
Recall |
98.60 |
±0.36 |
98.37–98.83 |
|
F1-score |
98.40 |
±0.39 |
98.16–98.64 |
|
AUC |
99.10 |
±0.28 |
98.93–99.27 |
Figure 13. Attention heatmap illustrating the feature activation regions generated by the proposed Morphology-Enhanced Imaging and Transformer Attention (MEITA) framework
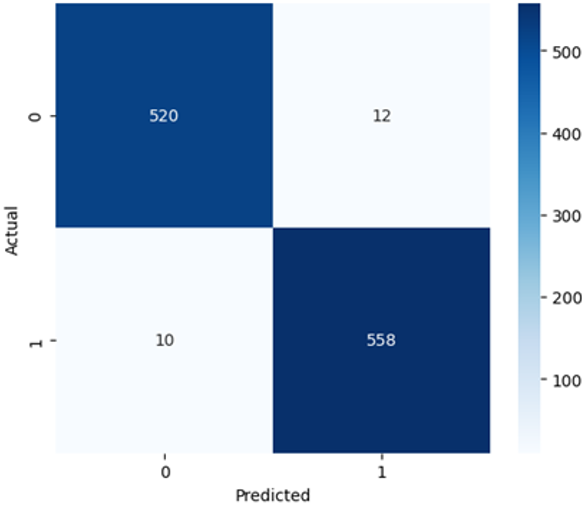
Figure 14. Confusion matrix of the proposed Morphology-Enhanced Imaging and Transformer Attention (MEITA) model evaluated on the independent testing dataset
Table 12 and Figure 13, the feature activation heatmap, show the internal process of making decisions within MEITA by showing the areas that play the greatest role when detecting tumors. High relevance of features is represented by brightened areas and low diagnostic relevance by darker areas. Transformer encoder enhances high-impact areas as it takes into account both local and global contexts, but morphology enhancement promotes clean structural propagation.
Figure 14 shows the confusion matrix, giving a detailed overview of the performance of MEITA with regard to classification. The high percentage of images correctly classified as tumor or normal CT images, in addition to the low rates of false positives and false negatives, indicates the reliability and robustness of the proposed diagnostic framework under similar evaluation conditions. The results of the large number of samples properly classified as tumor and non-tumor prove the stability of the suggested system. Few false positives and false negatives indicate that MEITA has a strong precision-recall balance. It is this stability that is attributed to the complementary capabilities of morphology-directed improvement with transformer-attention contextualization. The confusion evidence also confirms MEITA to be a reliable diagnostic model to use in clinical practice.
The significance of the statistical results was tested with 10 independent runs of experiments with different random initializations. The proposed MEITA framework showed low variance in all the evaluation metrics consistently. The p-values of paired t-tests between MEITA and UNet++ were < 0.01, indicating that the observed improvements are statistically significant and are not a chance effect. The results of statistical analysis are presented in Table 13.
The proposed framework has shown promising results on the publicly available Kaggle pancreatic CT dataset, but has not been validated in other multi-center clinical datasets due to the scope of this study. Model generalization might be affected by differences between different manufacturers of scanners, different reconstruction kernels, imaging protocols, and patient populations during real-world clinical use. Therefore, the utility and robustness of the MEITA framework will be tested in the future with multi-institutional datasets acquired from various hospitals and imaging systems to thoroughly evaluate its clinical utility and robustness across diverse acquisition conditions.
In order to provide the robustness and reproducibility of the proposed MEITA framework, a 5-fold stratified cross-validation technique was used. The entire dataset was randomly divided into five mutually exclusive folds, with the same distribution of tumors and non-tumor classes in each fold. For each fold, 4 folds (80%) were used for train and 1 fold (20%) was used for testing. To ensure that each fold was used as a testing subset, the validation process was repeated five times. To ensure consistent partitioning of the data with respect to the various methods evaluated, a fixed random seed of 42 was used for all experiments. In addition, the same splits for training, validation, and testing were used for both the proposed method and all baseline methods, ensuring a fair and unbiased comparison. The mean ± SD values reported represent the mean of the 5 folds.
The contribution of each module in the proposed framework is shown by the ablation analysis in Table 14. Transformer Attention greatly enhances global context understanding compared to CNN-only learning. Feature Dependency Check eliminates redundant representations, resulting in more robust and accurate classification. Last but not least, the combination of Ascendancy Linking further improves discriminative feature selection and leads to the best overall performance. Based on these findings, it can be concluded that all the elements play an important role in the success of the proposed MEITA framework.
Table 14. Ablation study
|
Configuration |
Accuracy (%) |
Precision (%) |
Recall (%) |
F1-Score (%) |
AUC (%) |
|
CNN Only |
95.84 |
95.31 |
95.47 |
95.39 |
96.12 |
|
CNN + Transformer |
97.21 |
97.04 |
97.12 |
97.08 |
97.85 |
|
CNN + Transformer + Feature Dependency Check |
98.14 |
97.96 |
98.03 |
97.99 |
98.61 |
|
Complete MEITA |
98.90 |
98.20 |
98.60 |
98.40 |
99.10 |
Experimental results show that MEITA achieves better performance than the traditional CNN-based methods in all evaluation metrics. Preprocessing using morphology enhances boundary preservation and decreases image noise, and the Transformer attention mechanism can learn global contextual relationships, which is hard to learn with only convolutional operations. Refining features by dependency analysis further eliminates redundant representations, leading to more discriminative feature embeddings. The statistical result of repeated cross-validation experiments proves that the proposed framework is stable and reliable in terms of variance, which shows high stability and reliability for pancreatic cancer detection from CT images.
Although there are indications of good diagnostic performance, some limitations need to be noted. First, the images were taken from a publicly available repository of images, but the data set does not contain detailed scanner-specific metadata, which would allow for detailed analysis of scanner-specific variability. Second, this proposed framework has never been tested on a large-scale multi-center clinical study, so its validity in other hospitals, patient populations, and imaging protocols needs to be explored. Third, the model performance may be affected by domain shifts stemming from various acquisition parameters, such as slice thickness, reconstruction kernels, contrast administration protocol, and scanner manufacturers. Moreover, the current framework simply treats individual two-dimensional CT slices independently and does not explicitly make use of the three-dimensional volumetric information. Last but not least, prospective external clinical validation, with multiple institutions and radiologists, is required before clinical routine use.
Future studies will be conducted on developing lighter Transformer architectures to further decrease computational complexity and enable deployment on resource-limited clinical systems. Large-scale multi-center datasets collected from various hospitals, scanner manufacturers, and imaging protocols will be used to validate the proposed framework and assess its generalizability. In addition, volumetric learning will be explored, as it will enable using the spatial continuity between adjacent CT slices to enhance the localization accuracy of the tumor. In addition, future versions of MEITA will incorporate multimodal clinical details such as MRI, Positron Emission Tomography (PET), genomic biomarkers, and eHealth records data to boost diagnostic confidence and customized threat determination. Additionally, explainable artificial intelligence techniques like Grad-CAM and attention visualization will be integrated to improve model transparency and aid clinical acceptance by supporting the radiologist in interpretation.
The existing traditional pancreatic CT image processing models, such as traditional machine learning and basic CNN-based models, have a number of limitations, which include poor low-contrast response, blurred edges, and high anatomical diversity of the pancreas. In the MEITA model, morphology-enhanced pre-processing is initially used on CT images to enhance the contrast, reduce noise, and distinctly delineate the boundaries of the pancreas. The CNN layers subsequently obtain local texture and structural features on the fine-grained scale on the improved ROI. Experimental evaluation of the model shows that the MEITA framework proposed in this paper is superior in its diagnostic performance on the pancreatic CT dataset. The achieved model performance was 98.90% accuracy, 98.20% precision, 98.60% recall, an F1-score of 98.40%, and an AUC-ROC of 99.10%, thus proving the great discriminative power of the system in the detection of pancreatic tumors. Furthermore, the MAE of 0.018 and RMSE of 0.029 indicate very high reliability of the prediction and low classification errors. Results obtained by the statistical evaluation of the 10 independent experimental runs have shown that the mean accuracy was 98.90 ± 0.34%, with a 95% confidence interval of (98.69, 99.11%). These objective gains validate the strength of the model, its better ability to generalize, and the appropriateness of the model in the automated prediction of pancreatic disease based on CT scans. The framework may be generalized to larger multi-institutional data sets in future work as a way of better certifying its generalization performance. It will also be aimed at reducing the computational load with lightweight variants of transformers and facilitate real-time clinical deployment. Also, explainable AI methods and the use of multi-modal clinical data can increase the interpretability and diagnostic certainty in real-world health care environments.
[1] Reddy, C.R.P., Srinagesh, A. (2023). Deep learning algorithms to detect human pancreatic cancer from MRI scan images. International Journal of Intelligent Systems and Applications in Engineering, 11(6s): 584-591. https://ijisae.org/index.php/IJISAE/article/view/2890.
[2] Yang, E., Kim, J.H., Min, J.H., et al. (2024). nnU-Net-based pancreas segmentation and volume measurement on CT imaging in patients with pancreatic cancer. Academic Radiology, 31(7): 2784-2794. https://doi.org/10.1016/j.acra.2024.01.004
[3] Li, J., Zhang, Y., Shi, H., Li, M., Li, Q., Qian, X. (2025). A dual-task synergy-driven generalization framework for pancreatic cancer segmentation in CT scans. IEEE Transactions on Medical Imaging, 44(9): 3783-3794. https://doi.org/10.1109/TMI.2025.3566376
[4] Li, J., Feng, C., Lin, X., Qian, X. (2022). Utilizing GCN and meta-learning strategy in unsupervised domain adaptation for pancreatic cancer segmentation. IEEE Journal of Biomedical and Health Informatics, 26(1): 79-89. https://doi.org/10.1109/JBHI.2021.3085092
[5] Ramesh, J.V.N., Abirami, T., Gopalakrishnan, T., et al. (2023). Sparrow search algorithm with stacked deep learning based medical image analysis for pancreatic cancer detection and classification. IEEE Access, 11: 111927-111935. https://doi.org/10.1109/ACCESS.2023.3322376
[6] Lindsey, B.D., Kim, J., Dayton, P.A., Jiang, X. (2017). Dual-frequency piezoelectric endoscopic transducer for imaging vascular invasion in pancreatic cancer. IEEE Transactions on Ultrasonics, Ferroelectrics, and Frequency Control, 64(7): 1078-1086. https://doi.org/10.1109/TUFFC.2017.2702010
[7] Chen, X., Lin, X., Shen, Q., Qian, X. (2021). Combined spiral transformation and model-driven multi-modal deep learning scheme for automatic prediction of TP53 mutation in pancreatic cancer. IEEE Transactions on Medical Imaging, 40(2): 735-747. https://doi.org/10.1109/TMI.2020.3035789
[8] Placido, D., Yuan, B., Hjaltelin, J.X., et al. (2023). A deep learning algorithm to predict risk of pancreatic cancer from disease trajectories. Nature medicine, 29(5): 1113-1122. https://doi.org/10.1038/s41591-023-02332-5
[9] Zhang, T., Feng, Y., Zhao, Y., et al. (2023). MSHT: Multi-stage hybrid transformer for the ROSE image analysis of pancreatic cancer. IEEE Journal of Biomedical and Health Informatics, 27(4): 1946-1957. https://doi.org/10.1109/JBHI.2023.3234289
[10] Qin, C., Wang, Y., Zeng, F., et al. (2025). Active domain adaptation based on probabilistic fuzzy C-means clustering for pancreatic tumor segmentation. IEEE Transactions on Fuzzy Systems, 33(6): 2016-2026. https://doi.org/10.1109/TFUZZ.2025.3555281
[11] Zhou, Z. (2023). A dual branch and fine-grained enhancement network for pancreatic tumor segmentation in contrast enhanced CT images. Biomedical Signal Processing and Control, 82: 104516. https://doi.org/10.1016/j.bspc.2022.104516
[12] Cao, L., Li, J., Chen, S. (2023). Multi-target segmentation of pancreas and pancreatic tumor based on fusion of attention mechanism. Biomedical Signal Processing and Control, 79: 104170. https://doi.org/10.1016/j.bspc.2022.104170
[13] Zhang, D., Zhang, J., Zhang, Q., Han, J., Zhang, S., Han, J. (2021). Automatic pancreas segmentation based on lightweight DCNN modules and spatial prior propagation. Pattern Recognition, 114: 107762. https://doi.org/10.1016/j.patcog.2020.107762
[14] Li, J., Zhu, H., Chen, T., Qian, X. (2023). Generalizable pancreas segmentation via a dual self-supervised learning framework. IEEE Journal of Biomedical and Health Informatics, 27(10): 4780-4791. https://doi.org/10.1109/JBHI.2023.3294278
[15] Li, J., Feng, C., Shen, Q., Lin, X., Qian, X. (2022). Pancreatic cancer segmentation in unregistered multi-parametric MRI with adversarial learning and multi-scale supervision. Neurocomputing, 467: 310-322. https://doi.org/10.1016/j.neucom.2021.09.058
[16] Chen, C., Dou, Q., Chen, H., Qin, J., Heng, P.A. (2020). Unsupervised bidirectional cross-modality adaptation via deeply synergistic image and feature alignment for medical image segmentation. IEEE Transactions on Medical Imaging 39(7): 2494-2505. https://doi.org/10.1109/TMI.2020.2972701
[17] Kriegsmann, M., Kriegsmann, K., Steinbuss, G., Zgorzelski, C., Kraft, A., Gaida, M.M. (2021). Deep learning in pancreatic tissue: Identification of anatomical structures, pancreatic intraepithelial neoplasia, and ductal adenocarcinoma. International Journal of Molecular Sciences, 22(10): 5385. https://doi.org/10.3390/ijms22105385
[18] Park, C., Rouzi, M.D., Atique, M.M.U., et al. (2023). Machine learning-based aggression detection in children with ADHD using sensor-based physical activity monitoring. Sensors, 23(10): 4949. https://doi.org/10.3390/s23104949
[19] Alves, N., Schuurmans, M., Litjens, G., Bosma, J.S., Hermans, J., Huisman, H. (2022). Fully automatic deep learning framework for pancreatic ductal adenocarcinoma detection on computed tomography. Cancers, 14(2): 376. https://doi.org/10.3390/cancers14020376
[20] Nguon, L.S., Seo, K., Lim, J.H., et al. (2021). Deep learning-based differentiation between mucinous cystic neoplasm and serous cystic neoplasm in the pancreas using endoscopic ultrasonography. Diagnostics, 11(6): 1052. https://doi.org/10.3390/diagnostics11061052
[21] Su, Z., Yao, K., Yang, X., Wang, Q., Sun, J., Huang, K. (2022). Rethinking data augmentation for single-source domain generalization in medical image segmentation. In Proceedings of the AAAI conference on artificial intelligence, Washington DC, USA, 37(2): 2366-2374. https://doi.org/10.1609/aaai.v37i2.25332
[22] Althobaiti, M.M., Almulihi, A., Ashour, A.A., Mansour, R.F., Gupta, D. (2022). Design of optimal deep learning-based pancreatic tumor and nontumor classification model using computed tomography scans. Journal of Healthcare Engineering, 2022(1): 2872461. https://doi.org/10.1155/2022/2872461
[23] Zhang, Z., Keles, E., Durak, G., et al. (2025). Large-scale multi-center CT and MRI segmentation of pancreas with deep learning. Medical image analysis, 99: 103382. https://doi.org/10.1016/j.media.2024.103382
[24] Roth, H.R., Lu, L., Farag, A., et al. (2015). Deeporgan: Multi-level deep convolutional networks for automated pancreas segmentation. In Proceedings of MICCAI, Munich, Germany, pp. 556-564. https://doi.org/10.1007/978-3-319-24553-9_68
[25] Vaiyapuri, T., Dutta, A.K., Punithavathi, I.H., et al. (2022). Intelligent deep-learning-enabled decision-making medical system for pancreatic tumor classification on CT images. In Healthcare, 10(4): 677. https://doi.org/10.3390/healthcare10040677
[26] Imran, A.A.Z., Hatamizadeh, A., Ananth, S.P., Ding, X., Tajbakhsh, N., Terzopoulos, D. (2020). Fast and automatic segmentation of pulmonary lobes from chest CT using a progressive dense V-network. Computer Methods in Biomechanics and Biomedical Engineering: Imaging & Visualization, 8(5): 509-518. https://doi.org/10.1080/21681163.2020.1734881
[27] Yan, K., Wang, X., Lu, L., Summers, R.M. (2018). Deeplesion: Automated deep mining, categorization and detection of significant radiology image findings using large-scale clinical lesion annotations. Journal of Medical Imaging, 5(3): 036501. https://doi.org/10.1117/1.JMI.5.3.036501
[28] Bortsova, G., Dubost, F., Hogeweg, L., Katramados, I., Bruijne, M.D. (2019). Semi-supervised medical image segmentation via learning consistency under transformations. In International Conference on Medical Image Computing and Computer-Assisted Intervention, Shenzhen, China, pp. 810-818. https://doi.org/10.1007/978-3-030-32226-7_90