Muhammad* | Tole Sutikno | Imam Riadi
© 2026 The authors. This article is published by IIETA and is licensed under the CC BY 4.0 license (http://creativecommons.org/licenses/by/4.0/).
OPEN ACCESS
Missing values in higher education datasets can compromise the reliability of educational data analytics by affecting downstream modeling and decision-making processes. Existing imputation approaches usually apply a single predefined method, which may not remain effective under heterogeneous data characteristics and varying levels of missingness. This study proposes Adaptive Missing Value Model for Higher Educational Data (EDU-AMVM), an explainable adaptive framework that selects appropriate imputation strategies according to attribute characteristics and missing-value severity. Unlike conventional approaches that modify individual imputation algorithms, EDU-AMVM introduces a rule-based strategy selection mechanism integrating three established methods: K-Nearest Neighbors (KNN), K-Means-based imputation, and Multivariate Imputation by Chained Equations (MICE). The framework was evaluated using a higher education dataset containing 300 student records under controlled low- and high-missingness scenarios. Performance was assessed using Root Mean Square Error (RMSE), Mean Absolute Error (MAE), Mean Absolute Percentage Error (MAPE), repeated masking experiments, and Wilcoxon signed-rank tests. The results indicate that static methods can achieve competitive accuracy under limited missingness, whereas their performance stability decreases as missing severity increases. EDU-AMVM maintains comparable imputation accuracy while reducing performance variation across different missing-data conditions. These findings demonstrate that adaptive selection of imputation strategies provides a transparent and practical approach for handling incomplete educational datasets. The proposed framework offers a reproducible solution for improving preprocessing reliability in higher education analytics without relying on complex black-box models.
missing value imputation, educational data analytics, adaptive strategy selection, explainable artificial intelligence, higher education datasets, data preprocessing
The rapid growth of data-driven decision-making in higher education has substantially increased institutional dependence on educational data analytics for academic evaluation, learning assessment, resource allocation, and strategic policy development [1, 2]. Modern higher education institutions continuously generate large volumes of heterogeneous data originating from academic information systems, learning management systems, online learning platforms, student assessments, and institutional surveys [3]. These data are increasingly used to support predictive modeling, educational data mining, and evidence-based policy formulation aimed at improving institutional performance and educational quality [4].
Despite these advancements, the reliability of educational analytics is strongly influenced by data quality, particularly the completeness and consistency of collected datasets [5]. One of the most persistent and challenging issues in educational data preprocessing is the presence of missing values [6]. Missing data commonly arise from incomplete data entry, survey non-response, integration inconsistencies across institutional systems, human error, and privacy-related limitations [7]. In practice, incomplete datasets may significantly reduce statistical validity, introduce analytical bias, decrease predictive accuracy, and compromise the reliability of institutional decision-making processes [8]. The problem becomes increasingly critical in higher education environments where datasets frequently combine numerical, categorical, demographic, and behavioral attributes with varying missingness characteristics [9].
To address this issue, missing value imputation has become an essential preprocessing task in educational data analytics [10]. Imputation aims to estimate incomplete data values using statistical, computational, or machine learning-based approaches [11]. Existing imputation techniques include statistical substitution methods, distance-based algorithms such as K-Nearest Neighbors (KNN), clustering-based approaches including K-Means, and multivariate statistical methods such as Multivariate Imputation by Chained Equations (MICE) [12-14]. Previous studies have demonstrated that appropriate imputation strategies can improve predictive performance, data consistency, and analytical reliability in educational analytics applications [15, 16].
Recent studies indicate that different imputation methods exhibit varying levels of effectiveness depending on dataset characteristics, missingness mechanisms, and missing value severity [17, 18]. Distance-based approaches generally perform well when local similarity structures are preserved; clustering-based methods leverage latent group characteristics, whereas multivariate methods exploit inter-variable statistical dependencies [19, 20]. These findings suggest that imputation performance is highly context-dependent and cannot be universally optimized using a single static method.
However, despite the growing diversity of imputation approaches, most existing studies still rely on static imputation strategies in which a single method is selected beforehand and uniformly applied across all datasets and missingness conditions [21]. Such approaches implicitly assume that one imputation technique can generalize effectively across heterogeneous educational data environments. In reality, educational datasets often exhibit substantial variations in attribute distributions, missingness severity, and data heterogeneity. These variations can cause the performance of static methods to become unstable across different scenarios [18, 22]. Moreover, existing studies rarely provide adaptive and explainable frameworks capable of dynamically selecting suitable imputation methods according to dataset conditions. Most prior works primarily focus on improving individual imputation algorithms rather than formalizing adaptive orchestration mechanisms for heterogeneous educational datasets [23]. This limitation reduces preprocessing robustness and weakens analytical reliability, particularly in high-stakes educational decision-making environments.
To address these research gaps, this paper proposes Adaptive Missing Value Model for Higher Educational Data (EDU-AMVM), an Adaptive Missing Value Imputation Framework specifically designed for higher education data analytics. The proposed framework dynamically selects appropriate imputation methods based on attribute-level data profiling and missing value severity through a transparent rule-based orchestration mechanism. EDU-AMVM integrates complementary imputation approaches, including KNN, K-Means, and MICE, combined with multi-metric performance evaluation using Root Mean Square Error (RMSE), Mean Absolute Error (MAE), and Mean Absolute Percentage Error (MAPE). Unlike conventional static approaches that prioritize single-method optimization, the proposed framework emphasizes adaptive stability, robustness, and explainability across varying missingness conditions.
The main contribution of this study lies in formalizing adaptive and transparent imputation strategy selection as a practical preprocessing framework for heterogeneous educational datasets. The proposed framework introduces an explainable rule-driven mechanism capable of dynamically orchestrating multiple imputation methods according to dataset characteristics and missing value severity. Experimental evaluations are conducted under both low and high missingness scenarios to analyze robustness, performance consistency, and analytical reliability across different levels of data incompleteness.
From a scientific perspective, this study advances missing value imputation research by formalizing adaptivity and explainability as fundamental design principles for educational data preprocessing frameworks. The proposed framework demonstrates that adaptive orchestration of complementary imputation methods can improve robustness and performance stability across heterogeneous missingness scenarios, thereby extending the applicability of imputation research beyond static single-method paradigms. From a practical perspective, EDU-AMVM provides higher education institutions with a transparent and reliable preprocessing framework capable of improving data quality under incomplete and heterogeneous educational environments. By enhancing the consistency and trustworthiness of educational analytics, the proposed framework can support more dependable predictive modeling, academic evaluation, and institutional decision-making processes. Furthermore, the explainable rule-based mechanism improves interpretability and operational transparency, which are increasingly important for accountable data-driven governance in higher education. The remainder of this paper is organized as follows. Section 2 presents related works, Section 3 describes the proposed methodology, Section 4 discusses the experimental results and analysis, and Section 5 concludes the paper.
2.1 Missing value imputation methods
Missing value imputation has been extensively studied as a fundamental data preprocessing task across statistics, machine learning, and data mining. Early approaches primarily relied on simple statistical techniques such as mean, median, or mode substitution due to their computational efficiency and ease of implementation [21]. However, these methods often distort data distributions and ignore inter-attribute relationships, leading to biased analytical results [22].
To address these limitations, distance-based methods such as KNN imputation were introduced, leveraging similarity among instances to estimate missing values [10, 23]. KNN-based approaches have demonstrated improved accuracy in datasets where local neighborhood structures are preserved, but their performance deteriorates in high-dimensional or sparse data scenarios [24]. Clustering-based imputation methods, including K-Means-based techniques, estimate missing values using cluster centroids or group-level statistics, offering improved scalability but remaining sensitive to cluster quality and initialization [15].
Multivariate statistical approaches, particularly MICE, model dependencies among variables through iterative regression-based estimation [17]. These methods are effective in capturing complex relationships but often incur higher computational costs and reduced stability under severe missing conditions [16].
2.2 Imputation in educational data analytics
In the context of educational data analytics, missing value imputation plays a critical role in ensuring the reliability of learning analytics, student performance prediction, and institutional decision-making. Prior studies have applied both traditional and advanced imputation techniques to improve model accuracy in higher education datasets [20]. Educational data are typically heterogeneous, comprising numerical, categorical, and behavioral attributes derived from academic records and learning management systems [2].
Several studies report that no single imputation method consistently outperforms others across different educational datasets and missingness patterns [15, 19]. The effectiveness of an imputation method is strongly influenced by missing value proportion, attribute types, and data distribution characteristics [13]. These findings highlight the limitations of applying static imputation strategies in complex educational environments.
2.3 Adaptive and hybrid imputation approaches
Recent research has explored hybrid and ensemble-based imputation approaches to mitigate the weaknesses of individual methods. Some studies combine multiple imputation techniques and select the best-performing method based on empirical evaluation [25], while others integrate imputation into learning pipelines using ensemble or optimization-based strategies [26, 27]. Although these approaches improve flexibility, they often rely on post-hoc performance comparison rather than systematic adaptivity driven by dataset profiling.
Adaptive imputation frameworks that dynamically adjust method selection remain limited, particularly in domain-specific contexts such as higher education. Existing adaptive approaches are often computationally intensive, lack interpretability, or are evaluated on generic benchmark datasets rather than real educational data [28, 29]. Moreover, performance stability under increasing missing value severity is rarely addressed explicitly.
Unlike traditional hybrid or ensemble methods that typically integrate results from multiple models through voting, averaging, or optimization techniques, EDU-AMVM utilizes an adaptive selection method based on deterministic attribute-level rules. The proposed framework does not aim to develop a new imputation algorithm or perform weighted prediction pooling across models. Instead, EDU-AMVM systematically organizes existing imputation methods by considering the extent of missing values and attribute characteristics. This approach emphasizes interpretability, reproducibility, and robustness across diverse higher education datasets, while avoiding the computational complexity and black-box characteristics common to deep learning or optimization-based adaptive imputation frameworks.
Recent research has begun to explore imputation methods based on deep learning, such as Masked Denoising Autoencoders and hybrid neural structures like Liquid Neural Network - Long Short-Term Memory (LNN-LSTM), to improve missing value estimation in complex data situations [12, 28]. These approaches have shown positive performance in modelling nonlinear relationships and time dependencies, especially on large datasets or highly dynamic datasets. However, these approaches generally have greater computational complexity, are less interpretable, and are highly dependent on the amount of data used for training. In the realm of educational data analysis, where datasets are typically medium-sized and maintaining institutional interpretability is crucial, a flexible, lightweight and explainable framework still offers practical benefits. Therefore, EDU-AMVM emphasizes adaptability through clear rule-based settings, rather than using black-box models or combinations of optimization techniques.
2.4 Research gap and positioning
The review of existing literature indicates three key limitations:
In response to these limitations, the present study proposes EDU-AMVM, an adaptive framework that systematically selects imputation methods based on data profiling and missing value severity. Unlike optimization-driven ensemble or black-box adaptive approaches, EDU-AMVM employs transparent rule-based orchestration at the attribute level to maintain interpretability and reproducibility. By emphasizing performance stability and explainability rather than single-method optimality, this work addresses an important gap in missing value imputation research for educational data analytics.
Based on the review presented in the Related Works section, this study employs an experimental, quantitative approach to develop and evaluate an adaptive model for handling missing values in higher education datasets. The approach was designed by leveraging findings from previous studies on the effectiveness of imputation methods such as KNN, K-Means, and MICE, which were subsequently integrated into the adaptive model. Therefore, a systematic research flow was established to ensure the construction of a robust adaptive imputation model. This section elaborates on several key components, including the research flow, dataset description, evaluation metrics, and tool environment.
3.1 Research flow
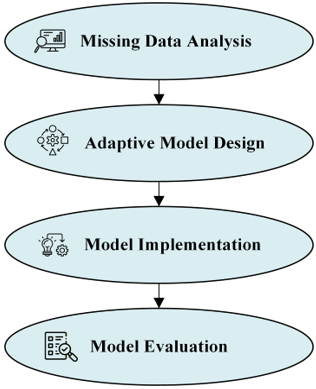
The research flow was systematically designed to ensure that each stage produces outputs that serve as inputs to subsequent stages, ultimately resulting in an adaptive model ready for empirical evaluation. In general, the research framework consists of four main phases, as illustrated in Figure 1.
Figure 1. Research flow
The first phase focused on exploring the characteristics of missing data to identify the patterns and proportions of missing values for each attribute. The second phase involved designing the adaptive model logic using a rule-based approach, which mapped dataset conditions to the most appropriate imputation method based on findings from the literature review and previous empirical studies.
The third phase involved implementing the designed framework on the higher education dataset under controlled missing-data scenarios. The fourth phase comprised the evaluation of the model's performance using three error metrics, namely RMSE, MAE, and MAPE, to assess imputation accuracy. In addition, repeated masking iterations and Wilcoxon signed-rank testing were employed to examine the consistency and statistical significance of the observed performance differences. These four phases are executed sequentially and in an integrated manner, with the final output being the EDU-AMVM, which can adjust imputation techniques based on the dataset's characteristics.
3.2 Proposed model
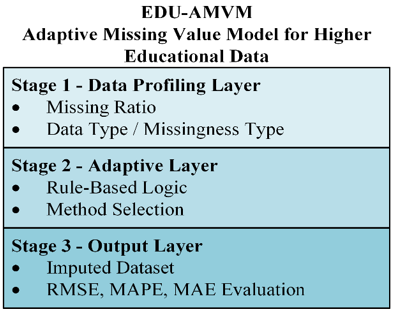
The proposed model for handling missing values in this study is illustrated in Figure 2.
Figure 2 presents the architecture of the EDU-AMVM proposed in this research. The model is designed as an adaptive framework that integrates data characteristic analysis, a rule-based mechanism for selecting imputation methods, and the evaluation of imputation results within a single, structured workflow.
EDU-AMVM consists of three main layers. The Data Profiling Layer is responsible for identifying the patterns and proportions of missing values in each attribute. The Adaptive Rule-Based Selection Layer then utilizes this information to determine the most appropriate imputation method based on the data characteristics. A rule-based approach is adopted to ensure that the method selection process is systematic and explainable. Subsequently, the Imputation and Evaluation Layer applies the selected method and evaluates the quality of the imputation results using relevant error metrics.
The integration of these three layers enables EDU-AMVM to function not only as an imputation model but also as a framework that dynamically adapts imputation strategies according to the characteristics of the data encountered. Accordingly, the model is designed to provide a more flexible and rational approach than single-imputation methods, particularly for higher education data, which often exhibit diverse missing-value patterns.
Figure 2. Proposed model
3.3 Adaptive rule specification of Adaptive Missing Value Model for Higher Educational Data
This subsection formally describes the adaptive rule-based mechanism used in EDU-AMVM to ensure transparency and reproducibility of the imputation method selection process. Rather than proposing a new imputation algorithm, EDU-AMVM operationalizes adaptivity through a deterministic mapping between data characteristics and established imputation techniques.
The adaptive rules are defined at the attribute level and are based on two primary criteria: (1) the proportion of missing values for each attribute, and (2) the semantic category of the attribute (academic or socio-economic). The missing value proportion is computed as the ratio between the number of missing entries and the total number of records for each attribute. Based on empirical findings in prior studies and preliminary data analysis, missing value severity is categorized into three levels as follows:
Using these thresholds, EDU-AMVM applies a deterministic rule set to select the most appropriate imputation method for each attribute. Academic attributes with low missing severity are handled using distance-based imputation to preserve local similarity structures. As missing severity increases, clustering-based methods are preferred to improve stability. For socio-economic attributes with high missing severity, multivariate imputation is employed to capture inter-attribute dependencies. Table 1 summarizes the adaptive rule specification used in EDU-AMVM.
The adaptive selection is applied independently to each attribute. Once the method selection is finalized, attributes assigned to the same imputation method are grouped and processed accordingly. This design ensures that the multivariate nature of MICE is preserved while avoiding interference with attributes better suited for distance-based or cluster-based estimation. By explicitly defining thresholds, decision rules, and execution flow, EDU-AMVM ensures that the adaptive imputation process is transparent, explainable, and reproducible. This formalization clarifies that the contribution of the proposed framework lies in systematic method selection rather than algorithmic modification, making it suitable for applied educational data analytics contexts.
In general, the EDU-AMVM working procedure can be formulated in Algorithm 1. This pseudocode includes adaptive decision-making steps that take place sequentially, starting from the analysis of missing values for each attribute, selecting the imputation method, and evaluating the results obtained.
Table 1. Adaptive rule specification of Adaptive Missing Value Model for Higher Educational Data (EDU-AMVM)
|
Attribute Category |
Missing Severity |
Selected Imputation Method |
|
Academic |
Low |
KNN |
|
Academic |
Medium |
K-Means |
|
Academic |
High |
K-Means |
|
Socio-economic |
Low |
KNN |
|
Socio-economic |
Medium |
K-Means |
|
Socio-economic |
High |
MICE |
|
Algorithm 1. EDU-AMVM Adaptive Imputation Workflow |
|
Input: Dataset D with missing values Output: Imputed dataset D*
Return D* |
This formalization of the process demonstrates that EDU-AMVM implements adaptation through rule-driven decisions, rather than a stochastic optimization approach. Therefore, the resulting imputation process remains structured, understandable, and consistent when applied to higher education data with varying missing value characteristics.
3.4 Dataset description
The dataset used in this study is data on prospective scholarship recipients, with each row representing an individual student. This dataset contains five numeric attributes covering academic and socioeconomic dimensions important in the scholarship eligibility assessment process. The presence of missing values in this dataset is not evenly distributed across attributes, reflecting the actual situation during scholarship data collection, particularly for socioeconomic attributes, which are often incompletely populated. Experimental evaluations were conducted using a dataset consisting of 300 records.
To assess the robustness of the model to missing values, artificial masking was performed on the original dataset to simulate two missingness scenarios: a low missing scenario and a high missing scenario. These two scenarios were created by assigning different proportions of missing values at the attribute level, while maintaining the original structural characteristics of the dataset. This controlled masking approach allows for systematic evaluation of imputation performance across varying levels of data incompleteness, while ensuring alignment with realistic higher education data patterns.
3.5 Performance evaluation metrics
Imputation performance was evaluated using three widely adopted error metrics: RMSE, MAE, and MAPE. These metrics provide complementary perspectives on estimation accuracy and are commonly used in missing value imputation studies [30, 31]. RMSE assesses the average squared deviation between the imputed and actual values. MAE measures the average absolute error regardless of direction, providing a general overview of the imputation accuracy [8]. Meanwhile, MAPE evaluates the error as a percentage relative to the actual value, making it more interpretable. The combination of these three metrics provides a comprehensive evaluation of the model's performance, covering both absolute accuracy and proportional stability of the imputation results.
In addition to these error metrics, repeated masking iterations were conducted to examine the consistency of imputation performance across different masked data subsets. The Wilcoxon signed-rank test was then applied to assess whether the observed performance differences between EDU-AMVM and the baseline methods were statistically significant. This additional statistical validation was used to strengthen the reliability of the performance evaluation beyond single-run metric comparison.
3.6 Tools environment
The proposed adaptive model was implemented in Python. Several widely used libraries were employed, including pandas and NumPy for data manipulation, scikit-learn for KNN and K-Means imputation, and IterativeImputer for MICE-based imputation.
All imputation processes were carried out using fixed parameter settings to guarantee experimental reproducibility. KNN imputation was implemented with k = 5. K-Means imputation employed three clusters k = 3 with a maximum of 300 iterations and a fixed random seed of 42 to ensure convergence consistency. MICE-based imputation was implemented using IterativeImputer with the default BayesianRidge estimator, 10 iterative refinement cycles, and a random seed of 42. These parameter values were selected based on commonly adopted configurations in prior imputation studies and preliminary stability testing to ensure both methodological consistency and reproducibility.
This section presents the results of the study related to the development of the EDU-AMVM.
4.1 Data profiling layer
This subsection presents the results of data profiling for the working dataset, which consists of 300 records. The analysis focuses on the distribution of missing values under two experimental scenarios, namely the low missing scenario and the high missing scenario, to identify patterns of data loss across attributes as part of the Data Profiling Layer. The data profiling process used a computational approach to measure the characteristics of missing values for each attribute. The missing value ratio was calculated by identifying empty entries and dividing their count by the total number of records in each scenario.
Table 2. Distribution of missing values
|
Attribute |
Low Scenario (%) |
High Scenario (%) |
Category |
|
×1 |
6.67 |
17.00 |
Academic |
|
×2 |
8.00 |
16.67 |
Academic |
|
×3 |
9.67 |
24.00 |
Academic |
|
×4 |
13.33 |
26.33 |
Socio-economic |
|
×5 |
15.00 |
29.00 |
Socio-economic |
As shown in Table 2, missing values are not evenly distributed across all attributes. Academic-related attributes, including semester (×1), grade point average (×2), and number of credits (×3), exhibit relatively lower proportions of missing values under both scenarios. In contrast, socioeconomic attributes, such as the number of dependents (×4) and parental income (×5), exhibit higher rates of missing data, particularly under the high missing scenario.
In addition to the missing value ratio, the data profiling stage also considers data types and characteristics of missingness. All attributes in the dataset are numerical and encompass academic and socioeconomic information. The observed missing data patterns indicate that missing values are not purely random across attributes. Higher proportions of missing values in socioeconomic attributes suggest dependence on attribute characteristics, suggesting a tendency toward Missing at Random (MAR) rather than completely random missingness. These findings confirm the heterogeneity in data completeness and provide an empirical basis for applying adaptive imputation strategies, as using a single imputation method may lead to suboptimal performance across all attributes. This pattern is consistent with common higher education data collection conditions, where socioeconomic information is frequently more incomplete due to reporting sensitivity or administrative limitations. Therefore, the masking scenarios used in this study were designed to preserve realistic missingness characteristics within the educational data context.
4.2 Adaptive method selection layer
This subsection discusses the behavior of the Adaptive Rule-Based Selection Layer within the EDU-AMVM framework, specifically how data profiling results from the previous stage are used to determine the most appropriate imputation method for each attribute. This stage does not aim to evaluate the numerical performance of imputation; rather, it demonstrates the model's ability to make adaptive, systematic method-selection decisions based on data characteristics.
The adaptive selection mechanism is designed using a rule-based approach that leverages information obtained from the Data Profiling Layer, particularly the level of missing values and attribute categories. Adaptive rules are defined to map attributes with different characteristics to suitable imputation methods deterministically. Academic attributes with low levels of missing data are processed using distance-based methods, whereas higher levels of missingness prompt the use of cluster-based methods. In contrast, socioeconomic attributes with high levels of missing data are handled using multivariate imputation to capture more complex inter-variable relationships. This approach ensures that the selection of the imputation method is conducted consistently and can be replicated based on the identified data characteristics.
Under the low missing scenario, the results of the adaptive selection are presented in Table 3. All academic attributes, Semester (×1), GPA (×2), and Number of Credits (×3) exhibit low levels of missing data and are mapped to the KNN method. This decision is based on the relatively homogeneous nature of the academic attributes and the limited extent of missingness. Meanwhile, the socioeconomic attributes, namely Number of Dependents (×4) and Parental Income (×5), exhibit moderate levels of missing data and are mapped using the K-Means method, which is better suited to handling greater data variability than purely distance-based approaches.
Subsequently, the results of the adaptive selection under the high missing scenario are presented in Table 4.
Table 3. Adaptive method selection under low missing scenario
|
Attribute |
Category |
Missing Ratio Level |
Selected Imputation Method |
|
×1 |
Academic |
Low |
KNN |
|
×2 |
Academic |
Low |
KNN |
|
×3 |
Academic |
Low |
KNN |
|
×4 |
Socio-economic |
Medium |
K-Means |
|
×5 |
Socio-economic |
Medium |
K-Means |
Table 4. Adaptive method selection under high missing scenario
|
Attribute |
Category |
Missing Ratio Level |
Selected Imputation Method |
|
×1 |
Academic |
Medium |
K-Means |
|
×2 |
Academic |
Medium |
K-Means |
|
×3 |
Academic |
High |
K-Means |
|
×4 |
Socio-economic |
High |
MICE |
|
×5 |
Socio-economic |
High |
MICE |
In this condition, the level of missing data in academic attributes increases to moderate to high, leading to a shift toward K-Means to maintain the stability of the imputation results. On the other hand, socioeconomic attributes exhibit high levels of missing data. They are handled using the MICE method, which is more effective at modelling multivariate relationships among attributes under conditions of substantial data loss.
The differences in method selection results between the low missing scenario and the high missing scenario indicate that the model does not maintain a single imputation strategy across all data conditions. Instead, EDU-AMVM deterministically selects imputation methods based on the identified data characteristics, ensuring transparent, explainable, and easily replicable decisions.
4.3 Imputation execution results
This subsection presents the results of the imputation execution stage. Based on the output of the Adaptive Rule-Based Selection Layer, each dataset attribute was mapped to a specific imputation method. Based on this mapping, attributes were grouped according to the selected methods: KNN, K-Means, and MICE. The imputation process was then applied separately to each group, ensuring that every method operated only on attributes aligned with their identified missing data characteristics.
4.3.1 Completion of missing values
Table 5 summarizes the status of missing values before and after imputation across both experimental scenarios. Before imputation, missing values were present across all target attributes in both the low missing and high missing scenarios. After the imputation process, all missing values were successfully imputed, resulting in fully completed datasets.
The results in Table 5 confirm that the imputation execution stage produced complete datasets while preserving the original data structure. This outcome confirms that the imputation procedures were consistently applied across all attributes identified during the adaptive selection stage.
4.3.2 Utilization of imputation methods
To further illustrate the adaptive behavior of the proposed framework during execution, Table 6 presents the distribution of imputation methods applied across attributes under each scenario.
As shown in Table 6, different imputation methods were utilized depending on the severity of missing data. The low missing scenario predominantly employed distance- and clustering-based methods, whereas the high missing scenario used more multivariate imputation. This variation demonstrates that the imputation execution stage faithfully followed the adaptive decisions generated earlier, rather than applying a uniform strategy across different data conditions. The results of this stage indicate that the proposed framework operationalizes adaptive method selection into concrete imputation procedures. The resulting imputed datasets serve as the direct output of the execution stage and provide a consistent basis for subsequent performance evaluation.
4.4 Imputation performance evaluation
The quantitative results indicate that under the low missing scenario, static imputation methods, particularly MICE, achieve competitive error values across the evaluated metrics. This outcome is expected, as datasets with relatively low missing proportions still preserve sufficient information structure, allowing conventional imputation techniques to perform effectively. In this condition, the adaptive mechanism of EDU-AMVM does not yield a substantial advantage, suggesting that adaptivity is not critical when data incompleteness remains limited. This observation is reflected in the absolute RMSE values reported in Table 7, where several static methods slightly outperform the adaptive framework under low missing severity. The RMSE Change (%) represents the relative difference in RMSE values between the low missing and high missing scenarios, computed to reflect performance degradation as missing severity increases.
In contrast, under the high missing scenario, performance degradation is observed across all methods, reflecting the increased difficulty of imputing data with higher missing severity. However, the degree of degradation differs notably between methods. Distance-based approaches such as KNN exhibit larger error fluctuations, indicating higher sensitivity to missing data severity. Multivariate methods such as MICE demonstrate more stable behavior but still experience noticeable performance changes. As shown in Table 6, EDU-AMVM achieves RMSE values comparable to the best-performing static methods under the high missing scenario. More importantly, the relative RMSE change indicates that the adaptive framework maintains competitive performance as missing severity increases, supporting its intended role as a robust imputation strategy rather than a metric-dominant one.
Table 5. Missing value (MV) before and after imputation
|
Scenario |
Rows Total |
Attribute with Missing |
MV (Before) |
MV (After) |
|
Low Missing |
300 |
5 |
158 |
0 |
|
High Missing |
300 |
5 |
339 |
0 |
Table 6. Imputation method utilization across scenarios
|
Scenario |
KNN |
K-Means |
MICE |
|
Low Missing |
3 attributes |
2 attributes |
0 |
|
High Missing |
0 |
3 attributes |
2 attributes |
Table 7. RMSE comparison and relative performance
|
Method |
RMSE (Low- Missing) |
RMSE (High- Missing) |
RMSE Change (%) |
|
KNN |
245,268.87 |
222,914.92 |
9.1 |
|
K-Means |
276,412.22 |
226,909.44 |
17.9 |
|
MICE |
234,245.37 |
216,447.67 |
7.6 |
|
EDU-AMVM |
276,412.18 |
216,447.58 |
21.7 |
Figure 3. Relative performance degradation from low to high missing scenarios across imputation methods
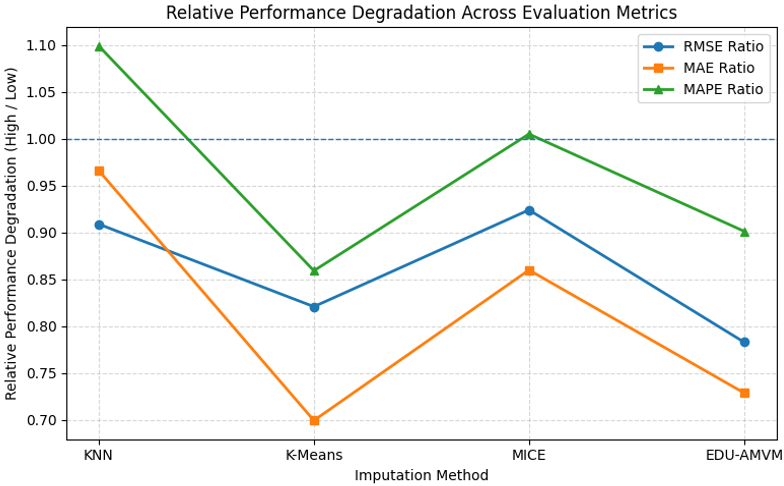
To further analyze robustness, Figure 3 illustrates the relative performance degradation of each method when transitioning from the low to the high missing scenario.
Instead of comparing absolute error values, this figure emphasizes the change in performance across scenarios, thereby highlighting method stability. The vertical axis in Figure 3 represents the percentage change in RMSE when transitioning from low to high missing scenarios, where lower values indicate greater performance stability across missingness conditions. Figure 3 shows that EDU-AMVM exhibits a more gradual degradation trend compared to static methods. While EDU-AMVM does not consistently achieve the lowest absolute error under all conditions, its error increase from low to high missing scenarios is more controlled. This behavior suggests that the adaptive selection of imputation strategies contributes to mitigating performance deterioration as data incompleteness intensifies. Importantly, this finding aligns with the design objective of EDU-AMVM, which prioritizes robustness and adaptability rather than dominance under favorable conditions. The results demonstrate that adaptivity becomes increasingly beneficial as the missing data problem becomes more severe.
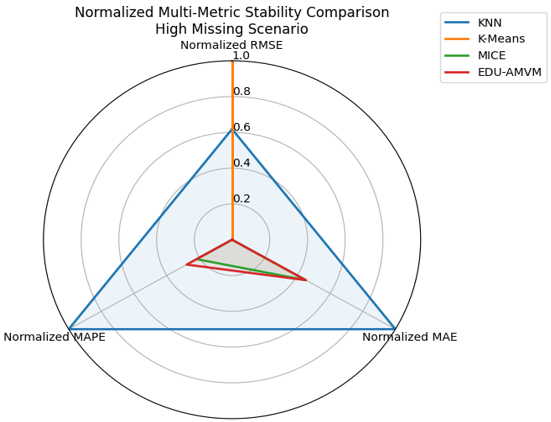
To complement the degradation analysis, Figure 4 presents a radar-based comparison of metric-wise stability under the high missing scenario. By normalizing RMSE, MAE, and MAPE values, this visualization highlights the balance of each method across heterogeneous evaluation criteria.
Figure 4. Normalized multi-metric stability comparison under the high-missing scenario
The radar chart presents normalized values of RMSE, MAE, and MAPE to enable cross-metric comparison. Metric values were normalized to the range [0,1], where lower normalized values indicate better relative imputation performance. The radar plot reveals that static methods tend to exhibit uneven performance profiles, excelling in certain metrics while underperforming in others. In contrast, EDU-AMVM demonstrates a more proportionate shape across all three metrics, indicating a balanced error distribution. This suggests that the proposed framework does not optimize a single metric at the expense of others but instead maintains consistent performance across multiple evaluation perspectives.
Taken together, the evaluation results indicate that the primary strength of EDU-AMVM lies in its stability and adaptability rather than in consistently achieving the lowest error values. While static methods may outperform the adaptive framework under specific conditions or metrics, their performance tends to degrade more sharply as missing severity increases. These findings confirm that adaptive imputation strategies are particularly advantageous in complex and adverse data conditions, such as those commonly encountered in real-world higher education datasets. By dynamically selecting imputation methods based on data characteristics, EDU-AMVM provides a robust alternative to single-method approaches, especially when data incompleteness cannot be reliably controlled.
From a theoretical perspective, the results validate adaptivity as an effective design principle for missing value imputation in heterogeneous domains. Rather than proposing a new imputation algorithm, EDU-AMVM demonstrates that systematic method selection guided by data profiling can yield more consistent outcomes across varying missingness levels. This finding extends existing imputation literature by shifting the focus from algorithm-centric performance to framework-level robustness.
In practical terms, the results indicate that higher education institutions should avoid relying on a single imputation method when dealing with incomplete data. The adaptive framework proposed in this study offers a practical and explainable solution that can be integrated into existing educational data pipelines. By maintaining stable performance under high missing conditions, EDU-AMVM supports more reliable analytics for academic evaluation, early warning systems, and institutional decision-making.
4.5 Statistical significance analysis
The statistical significance analysis was conducted using repeated masking iterations, and therefore the reported RMSE values represent averaged results across 30 experimental runs rather than the single-run values presented in Table 7. To assess the consistency of the observed performance differences, the Wilcoxon signed-rank test was applied across 30 masking iterations for each missing-value scenario.
The test results show that in the low missing scenario, EDU-AMVM shows statistically significant performance differences over KNN, K-Means, and MICE (p < 0.05). In this situation, traditional approaches, especially MICE, yield lower absolute RMSE values, indicating that adaptive method selection does not provide additional benefits when the level of incomplete data remains relatively low. In the high missing scenario, EDU-AMVM shows a statistically significant difference compared to KNN and K-Means (p < 0.05), but does not show a significant difference with MICE (p = 0.06356). The results of this study indicate that under conditions of higher missing values, EDU-AMVM achieves performance statistically comparable to the best baseline while still maintaining its adaptive flexibility. This finding supports the main idea of EDU-AMVM as an adaptive imputation framework that prioritizes robustness, especially for higher education datasets with increasing levels of missing values.
The stable performance demonstrated by EDU-AMVM can be theoretically associated with the heterogeneous characteristics of higher education datasets, where academic and socioeconomic attributes often exhibit different missing-value behaviors and statistical dependencies. Under low missing-value conditions, local similarity structures across observations remain relatively preserved, allowing conventional methods such as KNN and MICE to achieve competitive performance. However, as the level of missing values increases, interattribute variation and feature dependency become more dominant, making single-method imputation strategies less consistently reliable across variables. Through an adaptive method selection mechanism based on attribute characteristics and missing-value severity, EDU-AMVM reduces reliance on a single estimation assumption and maintains stable performance under heterogeneous incomplete-data conditions. This behavior is particularly relevant in higher education data environments, where missingness patterns frequently differ between academic indicators and socioeconomic attributes.
4.6 Limitations of Adaptive Missing Value Model for Higher Educational Data
Although EDU-AMVM has shown adaptability and reliability in different situations involving missing data, it is important to recognize several constraints associated with it. To begin with, the existing model has only been assessed on numerical characteristics related to higher education. As a result, its performance on categorical or hybrid educational datasets remains unproven. Because imputation for categorical data typically requires different similarity metrics and probabilistic estimation methods, the existing rule-based selection process may need additional modifications to accommodate these circumstances. In addition, although EDU-AMVM maintained stable performance under the evaluated high-missing scenario, its behavior under extremely sparse conditions remains uncertain, as distance and clustering-based imputations may deteriorate when neighborhood consistency and cluster stability are reduced.
Secondly, the assessment was performed using a mid-sized higher education dataset characterized by limited dimensional complexity and a regulated proportion of missing data. Consequently, the performance of the framework has not been thoroughly analyzed on much larger, more intricate, or high-dimensional datasets. Since EDU-AMVM employs data profiling along with adaptive method allocation, the number of computational resources required may increase as the number of attributes and the variety of data increase. Furthermore, the assessment concentrated on educational data related to scholarships within a particular institutional framework. Although the suggested adaptive orchestration approach aims to maintain versatility across various educational data areas, additional validation across different institutions is necessary to determine its applicability to a wide range of educational settings, student demographics, and administrative data formats.
Third, this study used KNN, K-Means, and MICE as the main baselines because these methods are widely used imputation approaches and represent different imputation strategies, including local-similarity-based, clustering-based, and iterative multivariate estimation. These methods were also selected because they are directly relevant to the adaptive orchestration mechanism developed in EDU-AMVM. However, this study did not include comparisons with Random Forest, ensemble learning, or deep learning-based imputation methods, as the main focus was to develop an explainable and reproducible adaptive imputation framework for moderate-scale higher education datasets. Broader comparative evaluation involving modern large-scale imputation approaches should therefore be considered in future work.
Fourth, this research assessed the quality of direct imputation using RMSE, MAE, and MAPE, and further enhanced this assessment by implementing repeated masking and Wilcoxon signed-rank tests. Nevertheless, the effects of imputation on predictive tasks, including classification and regression, were not addressed in this study. Future studies should include relevant metrics for tasks, such as classification accuracy, F1-score, or R-squared, to investigate how the quality of imputation influences subsequent educational analytics activities. Additionally, subsequent investigations should look into learning-based adaptive rule adjustments to increase the adaptability of EDU-AMVM when it is applied to datasets with significantly varied structural features.
This paper presented EDU-AMVM, an adaptive framework for handling missing values in higher education data. The framework was developed not as a new imputation algorithm, but as a structured mechanism for selecting appropriate imputation methods according to attribute characteristics and missing-value severity. EDU-AMVM combines data profiling, deterministic rule-based selection, and multi-metric evaluation to support a more transparent imputation process.
The experimental results show that conventional methods still perform well when the missing-value level is low. In this condition, the available data structure remains relatively sufficient for methods such as KNN, K-Means, or MICE to produce competitive results. However, under higher missing-value conditions, EDU-AMVM shows more stable behavior by assigning different imputation methods according to the characteristics of the affected attributes. The relative RMSE variation of approximately 21.7% indicates that the proposed framework is more oriented toward maintaining performance stability than achieving absolute dominance in every metric. The Wilcoxon signed-rank test across repeated masking iterations also supports this interpretation, particularly in the high-missing scenario where EDU-AMVM remains statistically comparable to the strongest baseline.
Overall, this study highlights the importance of adaptive and explainable method selection in missing-value imputation for heterogeneous educational datasets. EDU-AMVM can serve as a practical preprocessing framework for higher education data analytics, especially when missing values occur with different patterns across academic and socioeconomic attributes. Future studies may extend the framework to mixed-type and larger-scale datasets, include broader comparisons with other imputation approaches, evaluate the impact of imputation on downstream predictive tasks, and validate the framework across different institutional settings.
[1] Beerkens, M. (2022). An evolution of performance data in higher education governance: A path towards a ‘big data’era? Quality in Higher Education, 28(1): 29-49. https://doi.org/10.1080/13538322.2021.1951451
[2] Kaspi, S., Venkatraman, S. (2023). Data-driven decision-making (DDDM) for higher education assessments: A case study. Systems, 11(6): 306. https://doi.org/10.3390/systems11060306
[3] Bruni, R., Daraio, C., Aureli, D. (2021). Imputation techniques for the reconstruction of missing interconnected data from higher educational institutions. Knowledge-Based Systems, 212: 106512. https://doi.org/10.1016/j.knosys.2020.106512
[4] Seu, K., Kang, M.S., Lee, H. (2022). An intelligent missing data imputation techniques: A review. International Journal on Informatics Visualization, 6(1-2): 278-283. https://dx.doi.org/10.30630/joiv.6.1-2.935
[5] Keerin, P., Boongoen, T. (2021). Improved KNN imputation for missing values in gene expression data. Computers, Materials and Continua, 70(2): 4009-4025. https://doi.org/10.32604/cmc.2022.020261
[6] Zhang, Z. (2016). Missing data imputation: Focusing on single imputation. Annals of Translational Medicine, 4(1): 9. https://doi.org/10.3978/j.issn.2305-5839.2015.12.38
[7] Lin, W.C., Tsai, C.F. (2020). Missing value imputation: A review and analysis of the literature (2006–2017) W.-C. Lin, C.-F. Tsai. Artificial Intelligence Review, 53(2): 1487-1509. https://doi.org/10.1007/s10462-019-09709-4
[8] Li, J., Guo, S., Ma, R., et al. (2024). Comparison of the effects of imputation methods for missing data in predictive modelling of cohort study datasets. BMC Medical Research Methodology, 24(1): 41. https://doi.org/10.1186/s12874-024-02173-x
[9] Kabir, G., Tesfamariam, S., Hemsing, J., Sadiq, R. (2020). Handling incomplete and missing data in water network database using imputation methods. Sustainable and Resilient Infrastructure, 5(6): 365-377. https://doi.org/10.1080/23789689.2019.1600960
[10] Pujianto, U., Wibawa, A.P., Akbar, M.I. (2019). K-nearest neighbor (k-NN) based missing data imputation. In 2019 5th International Conference on Science in Information Technology (ICSITech), Yogyakarta, Indonesia, pp. 83-88. https://doi.org/10.1109/ICSITech46713.2019.8987530
[11] Jadhav, A., Pramod, D., Ramanathan, K. (2019). Comparison of performance of data imputation methods for numeric dataset. Applied Artificial Intelligence, 33(10): 913-933. https://doi.org/10.1080/08839514.2019.1637138
[12] Marco, R., Ahmad, S.S.S. (2024). Imputation of missing data using masked denoising autoencoder with L2-norm regularization in software effort estimation. International Journal of Intelligent Engineering & Systems, 17(4): 299-313. https://doi.org/10.22266/ijies2024.0831.23
[13] Fadlil, A., Herman, Praseptian M.D. (2023). Single imputation using statistics-based and k nearest neighbor methods for numerical datasets. Ingénierie des Systèmes d’Information, 28(2): 451-459. https://doi.org/10.18280/isi.280221
[14] Oktaviani, I.D., Putrada, A.G. (2022). KNN imputation to missing values of regression-based rain duration prediction on BMKG data. Jurnal Infotel, 14(4): 249-254. https://doi.org/10.20895/infotel.v14i4.840
[15] Muhammad, M., Sutikno, T., Riadi, I. (2025). K-means clustering as an imputation strategy for missing values in scholarship candidate data. Mantik Journal, 8(4): 2685-4236. https://doi.org/10.35335/mantik.v8i4.5904
[16] Mera-Gaona, M., Neumann, U., Vargas-Canas, R., López, D.M. (2021). Evaluating the impact of multivariate imputation by MICE in feature selection. PLOS ONE, 16(7): e0254720. https://doi.org/10.1371/journal.pone.0261739
[17] Hegde, H., Shimpi, N., Panny, A., Glurich, I., Christie, P., Acharya, A. (2019). MICE vs PPCA: Missing data imputation in healthcare. Informatics in Medicine Unlocked, 17: 100275. https://doi.org/10.1016/j.imu.2019.100275
[18] Memon, S.M., Wamala, R., Kabano, I.H. (2023). A comparison of imputation methods for categorical data. Informatics in Medicine Unlocked, 42: 101382. https://doi.org/10.1016/j.imu.2023.101382
[19] Muhammad, M., Sutikno, T., Riadi, I. (2025). A comparative study of k-means and KNN imputation for handling missing data in scholarship applicant datasets. Jurnal Informatika, 13(3): 245-254. https://doi.org/10.30595/juita.v13i3.26502
[20] Aureli, D., Bruni, R., Daraio, C. (2021). Optimization methods for the imputation of missing values in Educational Institutions Data. MethodsX, 8: 101208. https://doi.org/10.1016/j.mex.2020.101208
[21] Mohammed, M.B., Zulkafli, H.S., Adam, M.B., Ali, N., Baba, I.A. (2021). Comparison of five imputation methods in handling missing data in a continuous frequency table. AIP Conference Proceedings, 2355(1): 040006. https://doi.org/10.1063/5.0053286
[22] Cheng, Y., Ma, X., Yuan, L., Sun, Z., Wang, P. (2023). Evaluating imputation methods for single-cell RNA-seq data. BMC Bioinformatics, 24(1): 302. https://doi.org/10.1186/s12859-023-05417-7
[23] Swetha, B., Rani, K.U. (2025). AW K-NN: An adaptive weighted k-nearest neighbour framework for handling missing data. International Journal of Intelligent Engineering & Systems, 18(3): 625-637. https://doi.org/10.22266/ijies2025.0430.43
[24] Fadlil, A., Herman, P.M.D. (2022). K nearest neighbor imputation performance on missing value data graduate user satisfaction. Jurnal RESTI (Rekayasa Sistem dan Teknologi Informasi), 6(4): 570-576.
[25] Baro, P., Borah, M.D. (2023). A factor based multiple imputation approach to handle class imbalance. Procedia Computer Science, 218: 103-112. https://doi.org/10.1016/j.procs.2022.12.406
[26] Mantuano, C., Omoyele, O., Hoffmann, M., Weinand, J.M., Panella, M., Stolten, D. (2025). Data imputation methods for intermittent renewable energy sources: Implications for energy system modeling. Energy Conversion and Management, 339: 119857. https://doi.org/10.1016/j.enconman.2025.119857
[27] Van Loon, W., Fokkema, M., De Vos, F., Koini, M., Schmidt, R., De Rooij, M. (2024). Imputation of missing values in multi-view data. Information Fusion, 111: 102524. https://doi.org/10.1016/j.inffus.2024.102524
[28] Murtaza, S., Raj, S., Yun, G.Y., et al. (2025). Adaptive neural temporal hybridization for missing data imputation in building energy use datasets: An integrated LNN-LSTM weighted model. Journal of Building Engineering, 112: 113774. https://doi.org/10.1016/j.jobe.2025.113774
[29] Gómez-Sánchez, A., Ruckebusch, C., Tauler, R., de Juan, A. (2024). Dealing with missing data blocks in multivariate curve resolution. Towards a general framework based on a single factorization model. TrAC Trends in Analytical Chemistry, 179: 117869. https://doi.org/10.1016/j.trac.2024.117869
[30] Chicco, D., Warrens, M.J., Jurman, G. (2021). The coefficient of determination R-squared is more informative than SMAPE, MAE, MAPE, MSE and RMSE in regression analysis evaluation. Peerj Computer Science, 7: e623. http://doi.org/10.7717/peerj-cs.623
[31] Khair, U., Fahmi, H., Al Hakim, S., Rahim, R. (2017). Forecasting error calculation with mean absolute deviation and mean absolute percentage error. Journal of Physics: Conference Series, 930(1): 012002. http://doi.org/10.1088/1742-6596/930/1/012002