Rozzi Kesuma Dinata* | Bustami | Muhammad Fikry | Defi Irwansyah
© 2026 The authors. This article is published by IIETA and is licensed under the CC BY 4.0 license (http://creativecommons.org/licenses/by/4.0/).
OPEN ACCESS
Tuberculosis (TB) surveillance requires analytical approaches capable of integrating patient outcomes, spatial variations, and temporal disease trends. This study develops an integrated machine learning framework for predictive TB surveillance in Aceh, Indonesia, by combining patient-level classification, regional risk clustering, and temporal forecasting. TB surveillance data collected from 2019 to 2024 were analyzed using three complementary approaches: Support Vector Machine (SVM) for treatment outcome classification, Grey Relational Analysis (GRA)-optimized K-Medoids for district-level risk clustering, and polynomial regression for future case prediction. The SVM evaluation showed that the linear kernel achieved the highest cross-validation accuracy of 98.4% for classifying treatment outcomes into Not Started, Incomplete, and Completed categories. Compared with conventional K-Medoids, the GRA-based initialization strategy improved clustering performance, increasing the average Calinski–Harabasz Index (CH Index) from 122.61 to 128.01 and reducing the Davies–Bouldin Index (DBI) from 0.95 to 0.90. Temporal forecasting identified increasing TB case trends up to 2030, with Pidie, Aceh Utara, and Aceh Timur emerging as priority regions for intervention planning. By integrating multiple analytical dimensions within a unified framework, this study provides a data-driven approach for identifying high-risk populations, detecting regional disparities, and supporting evidence-based TB surveillance strategies.
tuberculosis surveillance, machine learning, predictive analytics, Support Vector Machine, Grey Relational Analysis, K-Medoids clustering, Indonesia
Tuberculosis (TB), a contagious infectious disease caused by Mycobacterium TB, remains a major public health challenge in Indonesia, particularly in high-burden provinces such as Aceh [1]. Despite comprehensive efforts through national TB control programs, including active case finding, treatment supervision, and community awareness campaigns, TB continues to contribute significantly to morbidity and mortality. These persistent challenges reflect ongoing gaps in healthcare accessibility, patient adherence, early detection, and resource allocation across districts [2]. Moreover, the complex epidemiology of TB, shaped by socio-economic disparities, population mobility, environmental conditions, and variations in healthcare infrastructure, further complicates disease surveillance and intervention planning [3].
A thorough understanding of TB trends and associated risk factors is essential for designing effective public health strategies. Analyses encompassing patient-level treatment adherence, district-level clustering of TB incidence, and temporal patterns of disease transmission offer critical insights into the distribution and propagation of TB within communities. Such insights allow policymakers to prioritize high-risk areas, allocate resources more efficiently, and implement targeted interventions to reduce disease burden [4]. However, conventional epidemiological and statistical approaches often fail to capture the multidimensional interactions among patient behaviors, spatial heterogeneity, and temporal variations, limiting their capacity to support responsive and adaptive TB surveillance systems [5]. In recent years, machine learning has emerged as a powerful analytical tool capable of processing large, complex datasets to identify hidden patterns and generate predictive insights for classification, clustering, and forecasting in infectious disease surveillance [6]. Although machine learning has been applied to TB for various analytical tasks, most existing studies focus on a single dimension, leaving a gap in integrated frameworks that holistically address patient, spatial, and temporal characteristics.
To address these limitations, this study proposes a hybrid machine learning model for TB surveillance, an integrated framework designed to optimize smart TB surveillance in Aceh. The integrated model consists of three complementary modules: (i) patient-level treatment adherence classification using Support Vector Machine (SVM), (ii) district-level TB risk clustering using K-Medoids enhanced with Grey Relational Analysis (GRA) for optimized medoid initialization, and (iii) temporal prediction of TB incidence using polynomial regression. By combining these analytical components, the hybrid model simultaneously captures patient, spatial, and temporal dimensions of TB, enabling more accurate identification of high-risk patients, vulnerable districts, and future case trajectories. This hybrid approach overcomes the limitations of single-dimensional analyses and offers a scalable, data-driven model applicable to other high-burden regions.
The main contributions of this study are as follows:
•Hybrid machine learning approach: Integrating classification, prediction, and clustering into a unified TB surveillance framework.
•Enhanced patient-level classification: Utilizing SVM with multiple kernel functions to identify key predictors of treatment adherence.
•Robust temporal forecasting: Applying regression-based modeling to project future TB incidence trends.
•Optimized spatial clustering: Employing GRA-based medoid selection within the K-Medoids algorithm to more accurately identify high-risk districts.
The remainder of this paper is structured as follows: Section 2 reviews existing literature on TB surveillance and machine learning applications. Section 3 describes the dataset, preprocessing procedures, and methodological framework. Section 4 presents the experimental results, including model performance and clustering analyses. Section 5 discusses the findings, their implications for TB control programs, and directions for future research. Through this integrated model, the study seeks to enhance smart TB surveillance and strengthen evidence-based decision-making in Aceh.
Bartolomeu-Gonçalves et al. [7] reviewed traditional and advanced TB diagnostics, including Polymerase Chain Reaction (PCR), Loop-mediated Isothermal Amplification (LAMP), novel biomarkers, and AI-based imaging, highlighting improvements in diagnostic sensitivity and specificity as well as challenges posed by drug-resistant strains. Kontsevaya et al. [8] discussed host- and pathogen-centered innovations such as immune-based methods, X-ray imaging, molecular assays, and next-generation sequencing. Teibo et al. [9] identified global barriers to diagnosis and treatment, including limited patient knowledge, transportation constraints, decentralized services, delayed diagnosis, stigma, and socioeconomic limitations. Zaporojan et al. [10] summarized advances in microscopy, solid–liquid culture methods, and molecular assays for detecting resistance. Di Gennaro et al. [11] reported diagnostic delays among native and migrant patients in Italy, with migrants experiencing longer patient-related delays and natives facing greater system-related delays.
Ejiyi et al. [12] introduced ResfEANet, an external attention network for automated chest X-ray diagnosis, achieving high accuracy with reduced computational cost. Broger et al. [13] emphasized diagnostic yield as a key metric for evaluating novel tests in non-sputum-producing populations. Ye et al. [14] examined how diabetes-related immunological disruption reduces diagnostic sensitivity. Jennings et al. [15] observed decreased diagnostic success and increased loss-to-follow-up during the COVID-19 pandemic. Mugenyi et al. [16] highlighted rapid drug-susceptibility testing as essential for global TB control. Assefa et al. [17] found that more than half of Ethiopian TB patients faced catastrophic expenses despite free national TB services. Wu et al. [18] demonstrated that targeted next-generation sequencing improves positivity rates and diagnostic concordance for drug-resistance detection. Du et al. [19] showed that Artificial Intelligence enhances lesion detection and diagnostic performance in radiological imaging. Naidoo et al. [20] emphasized community-driven transmission, limited resistance diagnostics, and socioeconomic barriers in managing drug-resistant TB.
Although these studies offer valuable contributions, most address only a single analytical dimension diagnosis, clinical risk factors, spatial distribution, or imaging without integrating patient-level behavior, district-level heterogeneity, and temporal disease trends into one cohesive framework. This fragmented approach limits the ability of health systems to conduct precise, adaptive, and predictive surveillance.
Unlike previous studies that primarily focus on isolated dimensions such as diagnosis, imaging, or classification, the proposed framework integrates patient-level treatment classification, spatial risk clustering, and temporal forecasting within a unified TB surveillance system. This integrated approach enables simultaneous analysis of patient, regional, and temporal characteristics, thereby improving surveillance responsiveness and decision-support capability.
From an information systems perspective, the proposed framework supports an integrated TB surveillance architecture consisting of data acquisition, predictive analytics, clustering-based regional monitoring, and decision-support reporting. The system can facilitate feedback-driven intervention planning by enabling health authorities to monitor treatment completion, identify high-risk regions, and evaluate temporal transmission trends through a unified analytical platform.
To overcome this gap, the present study introduces an integrated hybrid machine learning model that simultaneously performs treatment-adherence classification, spatial risk clustering, and temporal incidence forecasting. The objective is to optimize the performance of a smart TB surveillance system in Aceh by enhancing precision, responsiveness, and decision-support capacity across patient, spatial, and temporal dimensions.
3.1 Proposed method—Hybrid machine learning model
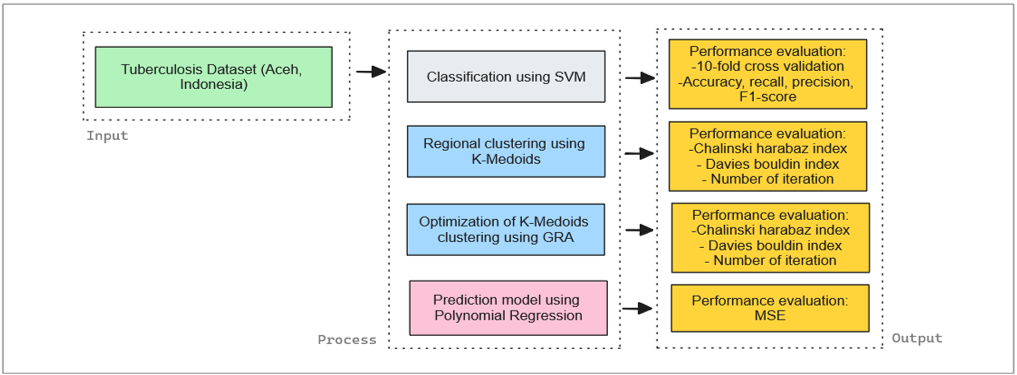
The proposed hybrid machine learning model integrates three complementary analytical modules designed to address patient-level, regional, and temporal dimensions of TB surveillance in Aceh, Indonesia. The overall workflow, combining classification, clustering, and prediction processes, is illustrated in Figure 1.
Figure 1. Workflow of the proposed method
The first module focuses on treatment completion classification using SVM, which categorizes patients into treatment completed and treatment not completed. This classification provides essential insights into individual treatment outcomes that influence recovery rates and overall disease control. The second module performs regional risk clustering at the district level. The K-Medoids algorithm is used to group districts with similar incidence patterns, while GRA is applied to optimize medoid initialization. This hybrid clustering approach enhances stability and accuracy, enabling more reliable identification of high-risk and low-risk districts. The third module is responsible for predicting TB spread using Polynomial Regression to capture non-linear temporal trends from historical case data. This predictive component supports the forecasting of transmission dynamics and assists in formulating proactive intervention strategies.
3.2 Data preprocessing
Before model development, several preprocessing steps were applied to improve data quality, consistency, and reproducibility. Missing values in critical attributes were removed, while limited missing numerical values were imputed using mean substitution. Outliers were identified using the Interquartile Range (IQR) method. However, extreme values reflecting actual epidemiological conditions were retained unless confirmed as data-entry errors.
Numerical features were normalized using Min–Max scaling to reduce variations in feature magnitude and improve computational stability. For the classification module, the dataset was divided into training and testing sets using a stratified 80:20 split to preserve the original class distribution. All randomized processes, including train-test splitting and medoid initialization, were conducted using a fixed random seed of 42 to ensure reproducibility.
Class imbalance was also evaluated, as the “Completed” category dominated the dataset compared to the “Not Started” and “Incomplete” classes. Although the original distribution was maintained to reflect real surveillance conditions, imbalance-aware techniques such as Synthetic Minority Oversampling Technique (SMOTE), class-weight adjustment, and ensemble learning are recommended for future improvement. In addition, clustering experiments were repeated multiple times, and the reported Calinski–Harabasz Index (CH Index) and Davies–Bouldin Index (DBI) values represent average results to reduce sensitivity to random initialization.
3.3 Patient treatment completion using Support Vector Machine
This module uses the SVM algorithm [21-23] to classify TB patients into three treatment categories: Not Started, Incomplete, and Completed. Each patient is represented by a multidimensional feature vector of demographic, clinical, and treatment-related attributes. The multi-class problem is handled via the one-versus-rest scheme, where a binary classifier is trained for each class, and the category with the highest decision score is assigned. Performance is evaluated using cross-validation [24] and class-wise metrics, supporting data-driven monitoring of treatment adherence and early identification of patients at risk of non-completion. The complete procedure of the proposed patient treatment completion classification module is summarized in Algorithm 1.
|
Algorithm 1. Patient treatment completion classification using Support Vector Machine (SVM) |
|
The decision boundary is defined by a hyperplane, as shown in Eq. (1) [25].
$f(x)=w^T x+b$ (1)
The SVM optimization seeks to maximize the margin while allowing certain misclassifications, formulated as in Eq. (2) [26]:
$\min _{w, b} \frac{1}{2}\|w\|^2+C \sum_{i=1}^N \xi_i$ (2)
subject to the constraint expressed in Eq. (3) [27]:
$\mathcal{Y}_i\left(w^T x_i+b\right) \geq 1-\xi_i, \forall_i$ (3)
where, C is the regularization parameter, and ξi represents slack variables.
The classification performance is evaluated using standard metrics derived from the confusion matrix. Accuracy, precision, recall, and F1-score are calculated respectively as shown in Eqs. (4)–(7) [28]:
Accuracy $=\frac{T P+T N}{T P+T N+F P+F N}$ (4)
Precision $=\frac{T P}{T P+F P}$ (5)
Recall $=\frac{T P}{T P+F N}$ (6)
$F 1=2 \times \frac{\text { Precision × Recall }}{\text { Precision }+ \text { Recall }}$ (7)
The patient-level data for classification of TB treatment outcomes in Aceh, obtained from the Provincial Health Office for the period 2019–2024, are presented in Table 1. Each record contains a set of treatment indicators (HRZE1–HRZE8 and HR1–HR16), represented as binary values, indicating the presence or absence of specific treatment responses. The final column denotes the treatment status, categorized as Not Started, Incomplete, or Completed.
Table 1. Dataset information for tuberculosis (TB) treatment outcome classification
|
Attribute |
Type |
Description |
|
HRZE1–HRZE8 |
Binary (1, –1) |
Indicators of treatment response during the intensive-phase regimen (HRZE), where 1 indicates the presence of a specific clinical or laboratory response and –1 indicates its absence. |
|
HR1–HR16 |
Binary (1, –1) |
Indicators of treatment response during the continuation phase (HR), represented as 1 for presence and –1 for absence of each condition. |
|
Treatment Status |
Categorical |
Final treatment outcome categorized into Not Started, Incomplete, or Completed, as recorded in the surveillance system. |
|
Year |
Numerical |
The year associated with each patient record, covering 2019–2024, obtained from the Aceh Provincial Health Office. |
|
Total Records |
Numerical |
730 patient-level observations included in the dataset. |
The low F1-scores observed in the “Not Started” and “Incomplete” categories indicate substantial class imbalance within the surveillance dataset. Misclassification of these minority groups may delay intervention for patients at risk of treatment discontinuation. Future improvements should incorporate imbalance-aware approaches such as SMOTE, class-weighted SVM optimization, and ensemble learning strategies to improve minority-class detection reliability.
3.4 Regional risk clustering (K-Medoids and Grey Relational Analysis + K-Medoids)
To identify TB risk patterns across districts, two clustering approaches are implemented. The conventional K-Medoids algorithm [29-31] groups districts based on similarities in incidence rates, while the GRA + K-Medoids method improves cluster stability by optimizing medoid initialization. Cluster quality is assessed using the CH Index [32] and DBI [33-35]. The overall workflow of the proposed regional risk clustering approach is outlined in Algorithm 2.
|
Algorithm 2. Regional risk clustering using K-Medoids and GRA + K-Medoids |
|
Given a dataset {x1, x2, …, xn} and the desired number of clusters k, the dissimilarity between two objects is computed using the Manhattan distance, as shown in Eq. (8):
$d\left(x_i, x_j\right)=\sum_{m=1}^p\left|x_{i m}-x_{j m}\right|$ (8)
The clustering cost is calculated as the sum of distances between each object and its assigned medoid, as expressed in Eq. (9):
Cost $=\sum_{m=1}^n\left(x_i, m\left(x_i\right)\right)$ (9)
The K-Medoids algorithm proceeds as follows [36]:
1) Initialization:
Select k objects as the initial medoids (either randomly or using GRA optimization).
2) Assignment step:
Assign each object to the nearest medoid based on the Manhattan distance.
3) Update step:
For each cluster, compute the total cost if the current medoid is replaced by another object within the cluster. The object that minimizes the clustering cost becomes the new medoid.
4) Iteration:
Repeat the assignment and update steps until medoids do not change or the total cost converges to a minimum.
To improve the robustness of medoid initialization, GRA is employed. The normalized value of each indicator is obtained as in Eq. (10):
$x_i^{\prime}(k)=\frac{x_i(k)-\min (x(k))}{\max (x(k))-\min (x(k))}$ (10)
The Grey Relational Coefficient (GRC) is then computed as shown in Eq. (11):
$\xi_i(k)=\frac{\Delta_{\min }+\rho \Delta_{\max }}{\Delta_i(k)+\rho \Delta_{\max }}$ (11)
where, $\Delta_i(k)=\left|x_0(k)-x_i(k)\right|$ and $\rho \in[0,1]$ is the distinguishing coefficient, typically set to 0.5. The overall Grey Relational Grade (GRG) is then calculated as in Eq. (12):
$\gamma_i=\frac{i}{n} \sum_{k=1}^n \xi_i(k)$ (12)
Table 2. District-level tuberculosis (TB) incidence data in Aceh
|
Region |
Year |
Population |
Detected |
Percentage |
|
Aceh Besar |
2024 |
418132 |
319 |
0.00076 |
|
Bireuen |
2019 |
469944 |
450 |
0.00096 |
|
Aceh Utara |
2019 |
595445 |
570 |
0.00096 |
|
. |
. |
. |
. |
. |
|
Sabang |
2024 |
42870 |
49 |
0.00114 |
|
Pidie |
2020 |
435275 |
500 |
0.00115 |
|
Aceh Utara |
2024 |
632195 |
820 |
0.00130 |
|
Aceh Besar |
2019 |
397839 |
530 |
0.00133 |
|
Aceh Singkil |
2020 |
126514 |
170 |
0.00134 |
|
. |
. |
. |
. |
. |
|
Gayo Lues |
2023 |
104856 |
150 |
0.00143 |
|
Bireuen |
2024 |
481427 |
700 |
0.00145 |
|
Simeulue |
2024 |
96510 |
140 |
0.00145 |
|
Banda Aceh |
2024 |
261780 |
612 |
0.00234 |
Districts with the highest GRG values are selected as initial medoids for clustering. Cluster quality is assessed using the CH and the DBI. The CH Index is defined as in Eq. (13):
$C H=\frac{T_r\left(B_k\right) /(k-1)}{T_r\left(W_k\right) /(n-k)}$ (13)
while the DBI is calculated as in Eq. (14):
$D B I=\frac{1}{k} \sum_{i=1}^k \max _{j \neq 1} \frac{s_i+s_j}{d\left(c_i, c_j\right)}$ (14)
where, si is the average intra-cluster distance and d(ci, cj) is the distance between centroids. A high CH index and a low DBI indicate optimal clustering quality. Table 2 presents the district-level TB incidence data, including population, detected cases, and corresponding incidence percentages, which serve as input for the clustering analysis.
3.5 Tuberculosis spread prediction (Polynomial Regression)
Historical TB case data are analyzed using Polynomial Regression to capture non-linear transmission trends. The model forecasts potential future case counts at the district level. Prediction accuracy is evaluated using the Mean Squared Error (MSE) metric. Let the dataset be denoted as (xi, yi), where xi corresponds to the temporal variable (e.g., year) and yi represents the number of recorded TB cases. The complete procedure of the proposed TB spread prediction module is summarized in Algorithm 3.
|
Algorithm 3. Tuberculosis spread prediction using polynomial regression |
|
The polynomial regression model of degree d is formulated as shown in Eq. (15) [37]:
$\hat{\mathcal{Y}}=\beta_0+\beta_1 x+\beta_2 x^2+\ldots+\beta_d x^d$ (15)
In matrix representation, the model can be expressed compactly as in Eq. (16) [38]:
$\hat{\mathcal{Y}}=X \beta$ (16)
where, X denotes the design matrix constructed from the polynomial terms of the predictor variable, and β is the coefficient vector to be estimated. The parameter estimation is performed using the Ordinary Least Squares (OLS) method, which minimizes the sum of squared residuals, as expressed in Eq. (17):
$\hat{\beta}=\left(X^T X\right)^{-1} X^T y$ (17)
The predictive accuracy of the model is evaluated using the MSE, which measures the average squared difference between the observed values and the predicted values, as defined in Eq. (18) [39]:
$\mathrm{MSE}=\frac{1}{n} \sum_{i=1}^n\left(\mathcal{Y}_i-\hat{\mathcal{Y}}_i\right)^2$ (18)
A lower MSE value indicates that the polynomial regression provides a more reliable fit to the observed TB case trends [40].
The historical TB case data, organized by district and year as presented in Table 3, serve as input for polynomial regression to forecast future case counts.
Table 3. Historical tuberculosis (TB) cases for prediction
|
Region |
Year |
Detected |
|
Banda Aceh |
2019 |
390 |
|
Langsa |
2019 |
220 |
|
Bener Meriah |
2019 |
180 |
|
. |
. |
. |
|
Bener Meriah |
2020 |
190 |
|
Banda Aceh |
2021 |
280 |
|
Gayo Lues |
2021 |
70 |
|
Aceh Tengah |
2021 |
150 |
|
Bireuen |
2022 |
590 |
|
Lhokseumawe |
2022 |
310 |
|
Aceh Besar |
2023 |
980 |
|
Pidie |
2023 |
900 |
|
. |
. |
. |
|
Aceh Tengah |
2023 |
370 |
|
Gayo Lues |
2024 |
130 |
|
Aceh Tengah |
2024 |
340 |
|
Bener Meriah |
2024 |
280 |
Although polynomial regression effectively captured short-term nonlinear trends, occasional negative prediction values may occur during extrapolation and are not epidemiologically realistic. In the current implementation, negative outputs were constrained to zero during interpretation. Future work should investigate constrained regression techniques, Poisson-based approaches, and hybrid forecasting models to improve reliability for count-based TB surveillance data.
4.1 Results of patient treatment completion classification
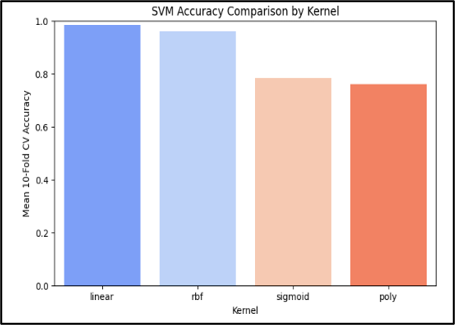
The SVM classifier is evaluated using 10-fold cross-validation across multiple kernel functions and hyperparameter settings. The linear kernel yields the highest performance, reaching 98.49% accuracy at C = 10 and remaining stable at C = 50 and C = 100. As shown in Table 4, the linear kernel achieves a mean accuracy of 98.4%, followed by Radial Basis Function (RBF) at 96.0%, while polynomial and sigmoid kernels perform substantially lower at 76.1% and 78.4%. These results indicate that the dataset is predominantly linearly separable, making the linear kernel the most appropriate configuration, as illustrated in Figure 2. For non-linear kernels, the effect of the γ parameter was also examined. As shown in Table 5, the highest accuracy (90.9%) was achieved with γ = 0.01. Performance decreased progressively as γ increased, with the lowest result observed at γ = 0.20. This indicates that larger γ values caused the model to overfit the training data, while smaller values promoted better generalization. The optimal configuration with a linear kernel and C equal to 10 is evaluated on the independent test set and yields an overall accuracy of 92.5 percent. Performance for the Completed class remains near perfect, with precision, recall, and F1-score around 0.99.
Table 4. Mean 10-fold cross-validation accuracy per kernel
|
Kernel |
Mean Accuracy |
|
Linear |
0.9841 |
|
RBF |
0.9603 |
|
Sigmoid |
0.7842 |
|
Polynomial |
0.7609 |
Figure 2. Accuracy comparison of Support Vector Machine (SVM) classifiers under different kernel functions
Based on Table 5, variations in the gamma parameter for non-linear kernels show a significant influence on the performance of the SVM model. The gamma value of 0.010 produces the highest mean accuracy of 0.9087 and therefore represents the most optimal configuration in this evaluation. This result shows that the model captures complex patterns effectively at this level without leading to overfitting. When gamma is too small, such as 0.001, the accuracy drops to 0.7638.
Table 5. Mean accuracy for varying gamma values (non-linear kernels)
|
Gamma |
Mean Accuracy |
|
0.001 |
0.7638 |
|
0.010 |
0.9087 |
|
0.100 |
0.8546 |
|
0.200 |
0.8133 |
A very low gamma makes the model too simple, and the decision boundary does not separate the classes adequately. In contrast, higher gamma values of 0.100 and 0.200 also reduce accuracy to 0.8546 and 0.8133. At these values, the model becomes overly sensitive to the training data, which increases the risk of overfitting. The findings show that selecting an appropriate gamma value is essential for optimizing SVM performance with non-linear kernels. The gamma value of 0.010 provides the best balance between model complexity and generalization. In contrast, the minority classes Not Started and Incomplete exhibit considerably lower F1-scores of 0.25 and 0.44, respectively, as detailed in Table 6.
Table 6. Classification report for the test set
|
Class |
Precision |
Recall |
F1-Score |
Support |
|
Not Started |
0.25 |
0.25 |
0.25 |
4 |
|
Incomplete |
0.40 |
0.50 |
0.44 |
4 |
|
Completed |
1.00 |
0.99 |
0.99 |
72 |
|
Accuracy |
0.93 |
80 |
||
|
Macro avg |
0.55 |
0.58 |
0.56 |
80 |
|
Weighted avg |
0.93 |
0.93 |
0.93 |
80 |
The classifier demonstrated near-perfect performance for the majority “Completed” class, while the minority classes “Not Started” and “Incomplete” produced lower F1-scores due to class imbalance.
Misclassification of these minority categories may reduce the effectiveness of early intervention strategies for patients at risk of treatment discontinuation. To address this limitation, future work should incorporate imbalance-aware approaches such as SMOTE, class-weighted SVM optimization, and ensemble learning methods to improve minority-class detection reliability.
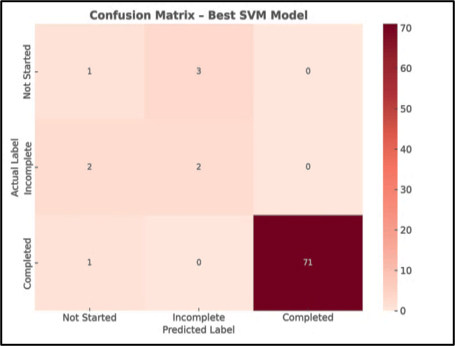
As shown in Figure 3, the confusion matrix provides a detailed view of the classification outcomes.
Figure 3. Confusion matrix of Support Vector Machine (SVM) classification results on the test set
4.2 Results of regional risk clustering (K-Medoids and Grey Relational Analysis + K-Medoids)
Regional clustering analyzes TB risk across districts in Aceh Province using two approaches: the conventional K-Medoids algorithm, which directly applies raw surveillance data, and the hybrid GRA + K-Medoids method, which computes GRG via GRA before clustering. The GRG values normalize features, reducing the impact of heterogeneous scales and enhancing sensitivity to relative risk differences. Comparative results show that GRA +K-Medoids outperforms conventional K-Medoids. The conventional approach produces less distinct cluster boundaries with inconsistent groupings, whereas the hybrid method yields stable, coherent clusters through optimized medoid initialization guided by GRG rankings. The GRG-based rankings used for initialization appear in Table 7.
Table 7. Grey Relational Grade (GRG) ranking results
|
Data No. |
GRG Value |
Rank |
|
9 |
0.333438139 |
1 |
|
10 |
0.344199994 |
2 |
|
111 |
0.345557703 |
3 |
|
7 |
0.350414288 |
4 |
|
87 |
0.350806834 |
5 |
|
12 |
0.352691442 |
6 |
|
109 |
0.354943104 |
7 |
|
99 |
0.355380987 |
8 |
|
8 |
0.355637865 |
9 |
|
110 |
0.358810382 |
10 |
|
11 |
0.360375828 |
11 |
|
27 |
0.361004125 |
12 |
|
85 |
0.361590898 |
13 |
|
105 |
0.362359024 |
14 |
|
112 |
0.362739529 |
15 |
|
69 |
0.363960166 |
16 |
|
123 |
0.364303755 |
17 |
|
81 |
0.365034111 |
18 |
|
86 |
0.366210294 |
19 |
|
88 |
0.370296725 |
20 |
|
. |
. |
. |
|
48 |
0,718611693 |
124 |
|
17 |
0,743266813 |
125 |
|
47 |
0,75422621 |
126 |
Table 8 summarizes the performance metrics for each configuration, providing a clear comparison of clustering effectiveness under GRA-optimized initialization. Optimal clustering occurs in Test 15, Test 19, and Test 20, which achieve the highest CH scores of 147.354 and low DBI scores of 0.884, demonstrating that GRA-based medoid initialization enhances cluster quality compared to random initialization. The resulting clusters reveal three TB risk levels in Aceh Province. The low-risk cluster comprises ten districts with a total of 10,217 cases, averaging 1,021 cases per district. The moderate-risk cluster comprises five districts with 9,960 cases, averaging 1,992 cases per district. The high-risk cluster comprises six districts with 20,293 cases, averaging 3,382 cases per district, representing the highest disease burden. A detailed summary of these clustering results is presented in Table 9.
Table 8. Performance evaluation of initial medoid configurations (GRA +K-Medoids)
|
Test No. |
Initial Medoids (Index) |
CH Score |
DBI Score |
Iterations |
|
1 |
[0, 39, 80] |
87.755 |
0.984 |
2 |
|
2 |
[1, 40, 81] |
87.755 |
0.984 |
2 |
|
3 |
[2, 41, 82] |
87.755 |
0.984 |
3 |
|
4 |
[3, 42, 83] |
130.819 |
0.896 |
4 |
|
5 |
[4, 43, 84] |
87.755 |
0.984 |
1 |
|
6 |
[5, 44, 85] |
130.819 |
0.896 |
4 |
|
7 |
[6, 45, 86] |
144.095 |
0.866 |
4 |
|
8 |
[7, 46, 87] |
130.819 |
0.896 |
3 |
|
9 |
[8, 47, 88] |
144.095 |
0.866 |
5 |
|
10 |
[9, 48, 89] |
130.819 |
0.896 |
4 |
|
11 |
[10, 49, 90] |
144.095 |
0.866 |
3 |
|
12 |
[11, 50, 91] |
130.819 |
0.896 |
3 |
|
13 |
[12, 51, 92] |
130.819 |
0.896 |
3 |
|
14 |
[13, 52, 93] |
144.095 |
0.866 |
2 |
|
15 |
[14, 53, 94] |
147.354 |
0.884 |
2 |
|
16 |
[15, 54, 95] |
144.095 |
0.866 |
3 |
|
17 |
[16, 55, 96] |
130.819 |
0.896 |
1 |
|
18 |
[17, 56, 97] |
130.819 |
0.896 |
2 |
|
19 |
[18, 57, 98] |
147.354 |
0.884 |
3 |
|
20 |
[19, 58, 99] |
147.354 |
0.884 |
3 |
|
Average |
128,01 |
0,904 |
2,85
|
|
Table 9. Summary of clustering results
|
Cluster |
Number of Districts |
Average Cases |
Total Cases |
|
Low Risk |
10 |
1,021.7 |
10,217 |
|
Moderate Risk |
5 |
1,992.0 |
9,960 |
|
High Risk |
6 |
3,382.2 |
20,293 |
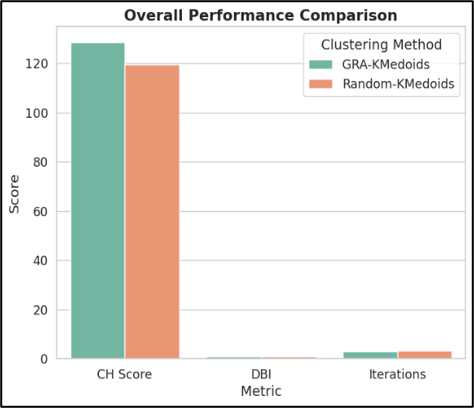
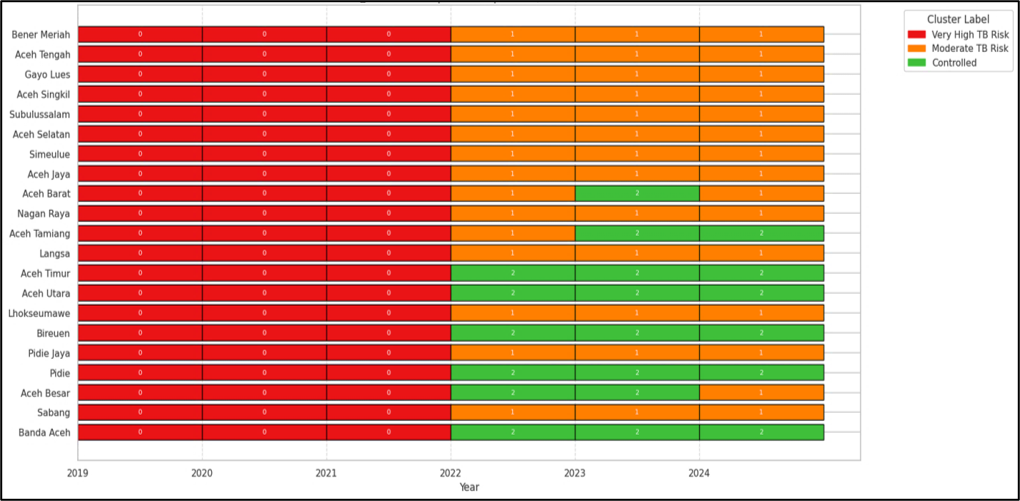
The low-risk cluster comprises Sabang, Pidie Jaya, Nagan Raya, Bener Meriah, Simeulue, Aceh Tengah, Aceh Singkil, Aceh Jaya, Gayo Lues, and Subulussalam, which record fewer cases and are generally less urbanized. The moderate-risk cluster includes Aceh Barat, Aceh Selatan, Aceh Tamiang, Lhokseumawe, and Langsa, with intermediate case burdens. The high-risk cluster consists of Aceh Besar, Pidie, Aceh Timur, Aceh Utara, Banda Aceh, and Bireuen, all densely populated with elevated incidence rates. Its performance is compared with conventional K-Medoids using random medoid initialization. Multiple runs with different seeds evaluate each configuration by Calinski–Harabasz scores, DBI, and convergence iterations, summarized in Table 10, with a comparative overview in Figure 4. These results show that the GRG + K-Medoids method effectively differentiates districts by TB risk, providing insights for targeted interventions, as illustrated in the heatmap in Figure 5.
Table 10. Results of performance evaluation of initial random medoid configurations (conventional K-Medoids)
|
Test No. |
Initial Medoids (Index) |
CH Score |
DBI Score |
Iterations |
|
1 |
[28, 106, 70] |
147.354 |
0.884 |
3 |
|
2 |
[53, 103, 15] |
130.819 |
0.896 |
3 |
|
3 |
[30, 81, 106] |
140.126 |
0.911 |
5 |
|
4 |
[13, 43, 89] |
87.755 |
0.984 |
4 |
|
5 |
[70, 106, 15] |
144.095 |
0.866 |
5 |
|
6 |
[43, 107, 97] |
91.216 |
1.075 |
3 |
|
7 |
[70, 28, 106] |
147.354 |
0.884 |
4 |
|
8 |
[103, 53, 15] |
130.819 |
0.896 |
1 |
|
9 |
[70, 15, 106] |
144.095 |
0.866 |
3 |
|
10 |
[106, 81, 30] |
140.126 |
0.911 |
3 |
|
11 |
[106, 81, 30] |
140.126 |
0.911 |
4 |
|
12 |
[106, 81, 30] |
140.126 |
0.911 |
1 |
|
13 |
[113, 97, 43] |
91.234 |
1.075 |
1 |
|
14 |
[90, 28, 74] |
89.889 |
1.299 |
2 |
|
15 |
[15, 103, 53] |
130.819 |
0.896 |
3 |
|
16 |
[70, 106, 28] |
147.354 |
0.884 |
3 |
|
17 |
[43, 97, 107] |
91.216 |
1.075 |
1 |
|
18 |
[103, 43, 121] |
82.651 |
0.978 |
3 |
|
19 |
[89, 13, 43] |
87.755 |
0.984 |
2 |
|
20 |
[106, 28, 70] |
147.354 |
0.884 |
6 |
|
Average |
122.61 |
0.95
|
3.00
|
|
Figure 4. Performance evaluation of conventional and Grey Relational Analysis (GRA)-optimized K-Medoids, showing that incorporation of GRA leads to improved cluster compactness and reduced computational iterations
Figure 5. Heatmap of tuberculosis (TB) risk clustering across districts in Aceh Province using the Grey Relational Grade (GRG) + K-Medoids method. Darker color intensity indicates higher tuberculosis risk levels, while lighter colors represent lower incidence concentrations across districts
As shown in Table 10, the conventional K-Medoids algorithm with random initialization produced relatively inconsistent clustering results. Although certain runs (e.g., Test 1, Test 7, and Test 20) achieved high CH scores comparable to the GRG + K-Medoids approach, several configurations recorded much lower scores and higher DBI values, indicating less distinct and less compact clusters. On average, the random initialization yielded a CH score of 122.61, a DBI score of 0.95, and required around 3.00 iterations for convergence. By contrast, the GRG + K-Medoids method achieved a higher average CH score (128.01), a lower DBI score (0.90), and slightly fewer iterations (2.85), confirming its superior clustering performance and stability.
To improve reproducibility, all randomized procedures, including train-test splitting and medoid initialization, were conducted using a fixed random seed of 42. Furthermore, clustering experiments were repeated 20 times under different initialization settings, and the reported CH Index and DBI values represent the average results across repeated runs to minimize the impact of random initialization variability.
4.3 Results of Tuberculosis spread prediction (Polynomial Regression)
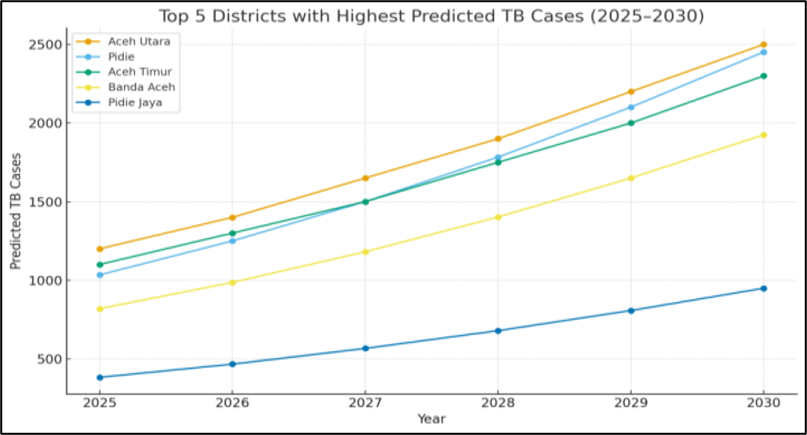
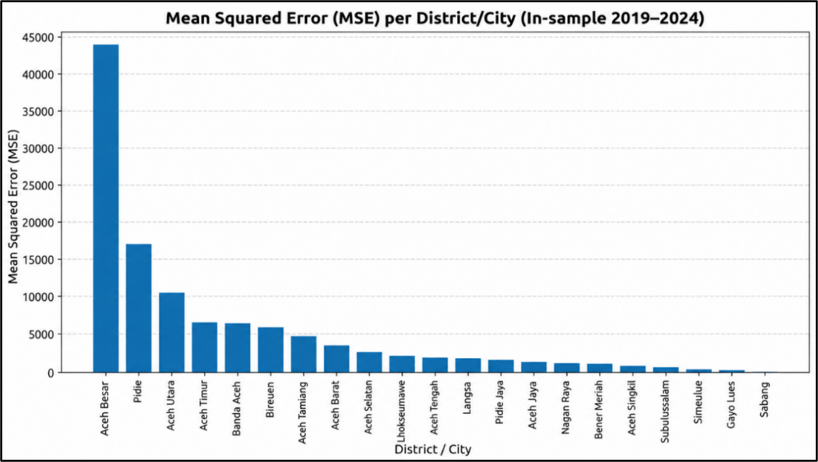
The polynomial regression model forecasts TB spread in Aceh Province from 2025 to 2030 based on historical data from 2019 to 2024. Table 11 shows an overall increasing trend, with Pidie, Aceh Utara, and Aceh Timur exhibiting the highest projected case counts, indicating priority areas for targeted intervention. Figure 6 visualizes annual predictions, enabling clear identification of high-risk districts. The forecast reveals heterogeneous growth across the province. High-burden districts such as Pidie, Aceh Utara, Aceh Timur, Bireuen, and Banda Aceh record the largest increases. Moderate growth appears in Aceh Tamiang, Aceh Barat, Langsa, Aceh Selatan, and Lhokseumawe, while smaller districts including Sabang, Simeulue, Subulussalam, Aceh Jaya, Aceh Singkil, Gayo Lues, Aceh Tengah, and Bener Meriah show slower but consistent rises, requiring continued monitoring and preventive measures. This finding highlights the need for hybrid modeling that integrates socioeconomic, healthcare access, and climatic variables to improve forecasting reliability in complex settings. Districts with higher MSE values offer important cues for prioritizing surveillance and resource allocation, as weaker prediction performance indicates the need for closer monitoring. As shown in Figure 7, higher errors appear in high-burden districts such as Aceh Besar, Pidie, Aceh Utara, and Aceh Timur.
Table 11. Predicted tuberculosis (TB) cases in Aceh Province (2025–2030)
|
District |
2025 |
2026 |
2027 |
2028 |
2029 |
2030 |
|
Banda Aceh |
819 |
986 |
1181 |
1402 |
1650 |
1925 |
|
Sabang |
64 |
79 |
97 |
118 |
143 |
171 |
|
Pidie |
1034 |
1250 |
1500 |
1783 |
2101 |
2452 |
|
Pidie Jaya |
382 |
466 |
566 |
679 |
807 |
949 |
|
Bireuen |
913 |
1089 |
1293 |
1525 |
1784 |
2070 |
|
Lhokseumawe |
541 |
667 |
814 |
984 |
1175 |
1388 |
|
Aceh Utara |
1074 |
1279 |
1518 |
1791 |
2096 |
2436 |
|
Aceh Timur |
929 |
1133 |
1369 |
1638 |
1940 |
2274 |
|
Langsa |
457 |
558 |
676 |
811 |
964 |
1133 |
|
A. Tamiang |
692 |
845 |
1023 |
1227 |
1455 |
1709 |
|
Nagan Raya |
377 |
461 |
561 |
675 |
804 |
947 |
|
Aceh Barat |
630 |
760 |
910 |
1082 |
1274 |
1487 |
|
Aceh Jaya |
307 |
363 |
427 |
500 |
581 |
670 |
|
Simeulue |
179 |
208 |
243 |
282 |
325 |
374 |
|
Aceh Selatan |
576 |
702 |
849 |
1018 |
1208 |
1420 |
|
Subulussalam |
240 |
285 |
338 |
398 |
465 |
540 |
|
Aceh Singkil |
301 |
361 |
431 |
512 |
604 |
706 |
|
Gayo Lues |
169 |
198 |
233 |
272 |
315 |
364 |
|
Aceh Tengah |
462 |
565 |
686 |
823 |
978 |
1150 |
|
Bener Meriah |
377 |
461 |
561 |
675 |
804 |
947 |
Figure 6. Predicted tuberculosis (TB) cases (2025–2030) in the top five high-risk districts of Aceh Province
Figure 7. Mean squared error (MSE) distribution of polynomial regression forecasts across districts in Aceh Province. Higher MSE values indicate larger prediction errors and lower forecasting stability in high-burden regions
Although the proposed framework demonstrated stable performance across repeated experiments, robustness across different temporal and regional distributions remains an important limitation. Future work should incorporate cross-year validation, cross-region testing, and sensitivity analysis to further evaluate model generalizability and operational reliability under diverse epidemiological conditions.
This study introduced an integrated Hybrid Machine Learning Framework for TB surveillance in Aceh Province, combining patient-level classification, district-level clustering, and temporal forecasting. Together, these modules form a decision-support pipeline that provides complementary insights for more effective intervention planning and resource allocation. The classification module employed SVM with systematic kernel and parameter tuning under 10-fold cross-validation. The linear kernel achieved the best performance (mean accuracy = 98.4%, optimal C = 10 with test accuracy 92.5%), while the RBF kernel performed moderately well, and polynomial and sigmoid kernels yielded considerably weaker results. The classifier demonstrated near-perfect accuracy for the majority “Completed” class but struggled with minority categories due to class imbalance, highlighting the need for imbalance-aware approaches if detection of minority classes is operationally important. District-level clustering was performed using K-Medoids with GRA for medoid initialization. Compared with random initialization, the GRA-based method achieved higher clustering quality (CH = 128.0 vs. 122.6; DBI = 0.904 vs. 0.95) and required fewer iterations. The final stratification grouped districts into three risk categories, with six high-risk districts (including Pidie, Aceh Utara, Aceh Timur, Banda Aceh, Bireuen, and Aceh Besar) bearing the heaviest TB burdens. This spatial risk mapping provides a stable and interpretable basis for geographically prioritized interventions.
Polynomial regression was applied to temporal case trends and revealed a general upward trajectory for 2025–2030, with the steepest increases in Pidie, Aceh Utara, and Aceh Timur. While the forecasts provided useful directional signals for short- to medium-term planning, occasional implausible negative values underscored the limitations of polynomial extrapolation, emphasizing the need for epidemiological validation before operational use. The integrated framework carries clear implications for policy and practice. At the clinical level, SVM classification can flag non-adherent patients for follow-up. At the programmatic level, GRA-based clustering enables health authorities to prioritize high-burden districts for surveillance and treatment resources. At the strategic level, temporal forecasting supports procurement, staffing, and budget planning. When combined, these modules allow for a more coordinated and efficient approach to TB control. Future work should enhance both granularity and robustness by incorporating socioeconomic, healthcare access, mobility, and environmental data into the clustering and forecasting modules; testing ensemble and deep-learning models for temporal prediction; and applying imbalance-aware classification strategies to improve detection of minority adherence classes. Real-time data integration would further strengthen operational responsiveness, while extending the framework to other provinces would help test its generalizability and inform national-level TB control strategies.
This study developed a multi-stage machine learning model to enhance TB surveillance in Aceh Province, Indonesia. By integrating SVM classification, GRA-initialized K-Medoids clustering, and polynomial regression forecasting, the framework provided a comprehensive analytical pipeline for handling patient-level, spatial, and temporal TB data. The SVM model successfully identified patients at risk of treatment non-completion with high accuracy, although limited sensitivity toward minority classes indicated persistent challenges associated with class imbalance. In the clustering stage, K-Medoids effectively grouped districts into low-, medium-, and high-risk categories, while GRA-based initialization improved cluster stability and alignment with epidemiological patterns, thereby supporting resource prioritization. Polynomial regression generated forecasts for 2025–2030, capturing increasing burden trends across multiple districts, although sensitivity to historical fluctuations required cautious interpretation. The combined approach demonstrated the practical value of hybrid modeling in supporting clinical decision-making, surveillance prioritization, and programmatic planning efforts. Despite its strengths, the framework was constrained by imbalanced datasets, dependency on routine surveillance records, and inherent limitations of polynomial forecasting in highly variable epidemiological contexts. Nonetheless, the modular design of our proposed model allows flexible adaptation to different geographic regions or datasets by retraining each component with localized information. Future work was recommended to expand the framework to multi-provincial or national-scale datasets, explore ensemble or deep-learning-based architectures to improve classification and prediction accuracy, and incorporate additional determinants such as socioeconomic indicators, healthcare accessibility, and environmental conditions. These extensions were expected to enhance predictive robustness, increase policy relevance, and support more effective TB control strategies in high-burden areas. The proposed framework can support regional health authorities as a decision-support system for TB surveillance and intervention planning. However, practical deployment may require sufficient computational infrastructure, continuous data integration, and periodic model retraining to maintain predictive performance. Real-time implementation may also be constrained by reporting delays and data completeness in low-resource healthcare environments. Future work will focus on extending the framework to multi-provincial and national TB surveillance systems through integration with regional health databases and standardized reporting platforms. Model retraining procedures will be conducted periodically using updated surveillance records, while cross-region validation and sensitivity analysis will be implemented to evaluate model generalizability and operational robustness across heterogeneous epidemiological conditions.
The authors gratefully acknowledge Universitas Malikussaleh for its support of this research. This study was funded by Universitas Malikussaleh through the 2025 PNBP Applied Research Scheme under Contract No. 25.01.FT.54.
[1] Sebong, P.H., Ferdiana, A., Tegu, F.A.R., et al. (2025). Participatory development of Indonesia’s national action plan for zero leprosy: Strategies and interventions. Frontiers in Public Health, 13. https://doi.org/10.3389/fpubh.2025.1453470
[2] Sohn, H., Sweeney, S., Mudzengi, D., et al. (2021). Determining the value of TB active case-finding: Current evidence and methodological considerations. International Journal of Tuberculosis and Lung Disease, 25(3): 171-181. https://doi.org/10.5588/ijtld.20.0565
[3] Kunjok, D.M., Mwangi, J.G., Kairu-Wanyoike, S., Kinyua, J., Mambo, S. (2025). Spatial epidemiology of tuberculosis diagnostic delays, healthcare access disparities, and socioeconomic inequities in Nairobi County, Kenya. PLoS ONE, 20(8): e0329984. https://doi.org/10.1371/journal.pone.0329984
[4] Ayenew, B., Belay, D.M., Gashaw, Y., Gimja, W., Gardie, Y. (2024). WHO’s end of TB targets: Unachievable by 2035 without addressing under nutrition, forced displacement, and homelessness: Trend analysis from 2015 to 2022. BMC Public Health, 24(1): 961. https://doi.org/10.1186/s12889-024-18400-5
[5] Owolabi, B.O., Owolabi, F.A. (2025). Predictive AI-driven epidemiology for tuberculosis outbreak prevention in achieving Zero TB City vision. International Journal of Research Publication and Reviews, 2(5): 318-340. https://doi.org/10.55248/gengpi.6.0525.1994
[6] Cheah, B.C.J., Vicente, C.R., Chan, K.R. (2025). Machine learning and artificial intelligence for infectious disease surveillance, diagnosis, and prognosis. Viruses, 17(7): 882. https://doi.org/10.3390/v17070882
[7] Bartolomeu-Gonçalves, G., Souza, J.M. de, Fernandes, B.T., et al. (2024). Tuberculosis diagnosis: Current, ongoing, and future approaches. Diseases, 12(9): 202. https://doi.org/10.3390/diseases12090202
[8] Kontsevaya, I., Cabibbe, A.M., Cirillo, D.M., et al. (2024). Update on the diagnosis of tuberculosis. Clinical Microbiology and Infection, 30(9): 1115-1122. https://doi.org/10.1016/j.cmi.2023.07.014
[9] Teibo, T.K.A., Andrade, R.L. de P., Rosa, R.J., et al. (2024). Barriers that interfere with access to tuberculosis diagnosis and treatment across countries globally: A systematic review. ACS Infectious Diseases, 10(8): 2600-2614. https://doi.org/10.1021/acsinfecdis.4c00466
[10] Zaporojan, N., Negrean, R.A., Hodișan, R., Zaporojan, C., Csep, A., Zaha, D.C. (2024). Evolution of laboratory diagnosis of tuberculosis. Clinics and Practice, 14(2): 388-416. https://doi.org/10.3390/clinpract14020030
[11] Di Gennaro, F., Cotugno, S., Guido, G., et al. (2025). Disparities in tuberculosis diagnostic delays between native and migrant populations in Italy: A multicenter study. International Journal of Infectious Diseases, 150: 107279. https://doi.org/10.1016/j.ijid.2024.107279
[12] Ejiyi, C.J., Qin, Z., Nnani, A.O., et al. (2024). ResfEANet: ResNet-fused external attention network for tuberculosis diagnosis using chest X-ray images. Computer Methods and Programs in Biomedicine Update, 5: 100133. https://doi.org/10.1016/j.cmpbup.2023.100133
[13] Broger, T., Marx, F.M., Theron, G., et al. (2024). Diagnostic yield as an important metric for the evaluation of novel tuberculosis tests: Rationale and guidance for future research. The Lancet Global Health, 12(7): e1184-e1191. https://doi.org/10.1016/s2214-109x(24)00148-7
[14] Ye, Z., Li, L., Yang, L., et al. (2024). Impact of diabetes mellitus on tuberculosis prevention, diagnosis, and treatment from an immunologic perspective. Exploration, 4(5): 20230138. https://doi.org/10.1002/exp.20230138
[15] Jennings, K., Lembani, M., Hesseling, A.C., et al. (2024). A decline in tuberculosis diagnosis, treatment initiation and success during the COVID-19 pandemic, using routine health data in Cape Town, South Africa. PLoS ONE, 19(9): e0310383. https://doi.org/10.1371/journal.pone.0310383
[16] Mugenyi, N., Ssewante, N., Baruch Baluku, J., et al. (2024). Innovative laboratory methods for improved tuberculosis diagnosis and drug-susceptibility testing. Frontiers in Tuberculosis, 1: 1295979. https://doi.org/10.3389/ftubr.2023.1295979
[17] Assefa, D.G., Dememew, Z.G., Zeleke, E.D., Manyazewal, T., Bedru, A. (2024). Financial burden of tuberculosis diagnosis and treatment for patients in Ethiopia: A systematic review and meta-analysis. BMC Public Health, 24(1): 240. https://doi.org/10.1186/s12889-024-17713-9
[18] Wu, X., Tan, G., Sun, C., et al. (2025). Targeted next-generation sequencing - A promising approach in the diagnosis of Mycobacterium tuberculosis and drug resistance. Infection, 53(3): 967-979. https://doi.org/10.1007/s15010-024-02411-w
[19] Du, J., Su, Y., Qiao, J., et al. (2024). Application of artificial intelligence in diagnosis of pulmonary tuberculosis. Chinese Medical Journal, 137(5): 559-561. https://doi.org/10.1097/cm9.0000000000003018
[20] Naidoo, K., Perumal, R., Cox, H., et al. (2024). The epidemiology, transmission, diagnosis, and management of drug-resistant tuberculosis—Lessons from the South African experience. The Lancet Infectious Diseases, 24(9): e559-e575. https://doi.org/10.1016/s1473-3099(24)00144-0
[21] Rivera-Romero, C.A., Munoz-Minjares, J.U., Lastre-Dominguez, C., Lopez-Ramirez, M. (2024). Optimal image characterization for in-bed posture classification by using SVM algorithm. Big Data and Cognitive Computing, 8(2): 13. https://doi.org/10.3390/bdcc8020013
[22] Guo, J., Wu, H., Chen, X., Lin, W. (2024). Adaptive SV-Borderline SMOTE-SVM algorithm for imbalanced data classification. Applied Soft Computing, 150: 110986. https://doi.org/10.1016/j.asoc.2023.110986
[23] Hasdyna, N., Dinata, R.K. (2025). A hybrid optimization of supervised learning models using information gain-based feature selection. International Journal of Computing, 24(1): 178-189. https://doi.org/10.47839/ijc.24.1.3890
[24] Allgaier, J., Pryss, R. (2024). Cross-validation visualized: A narrative guide to advanced methods. Machine Learning and Knowledge Extraction, 6(2): 1378-1388. https://doi.org/10.3390/make6020065
[25] Kavitha, S.S., Kaulgud, N. (2024). Quantum machine learning for support vector machine classification. Evolutionary Intelligence, 17(2): 819-828. https://doi.org/10.1007/s12065-022-00756-5
[26] Nie, F., Hao, Z., Wang, R. (2024). Multi-class support vector machine with maximizing minimum margin. Proceedings of the AAAI Conference on Artificial Intelligence, 38(13): 14466-14473. https://doi.org/10.1609/aaai.v38i13.29361
[27] Piccialli, V., Sciandrone, M. (2022). Nonlinear optimization and support vector machines. Annals of Operations Research, 314(1): 15-47. https://doi.org/10.1007/s10479-022-04655-x
[28] Montesinos López, O.A., Montesinos López, A., Crossa, J. (2022). Support vector machines and support vector regression. In Multivariate Statistical Machine Learning Methods for Genomic Prediction, pp. 337-378. https://doi.org/10.1007/978-3-030-89010-0_9
[29] De Mathelin, A., Cecchi, N.E., Deheeger, F., Mougeot, M., Vayatis, N. (2025). OneBatchPAM: A fast and frugal K-medoids algorithm. Proceedings of the AAAI Conference on Artificial Intelligence, 39(15): 16172-16180. https://doi.org/10.1609/aaai.v39i15.33776
[30] Sobrinho Campolina Martins, A., Ramos de Araujo, L., Rosana Ribeiro Penido, D. (2024). K-Medoids clustering applications for high-dimensionality multiphase probabilistic power flow. International Journal of Electrical Power & Energy Systems, 157: 109861. https://doi.org/10.1016/j.ijepes.2024.109861
[31] Shakoor, M. (2025). A k-medoids-based partitioned method for computational homogenization of heterogeneous materials. Computers & Structures, 316: 107875. https://doi.org/10.1016/j.compstruc.2025.107875
[32] Tatikonda, R., Veeravalli, S.D., G, R., Bittla, S.R., Ajsan Salami, Z. (2025). Customer behavior analysis for e-commerce and retail using improved K-Means clustering with Calinski Harabasz index. In 2025 International Conference on Intelligent Computing and Knowledge Extraction (ICICKE), Bengaluru, India, pp. 1-6. https://doi.org/10.1109/icicke65317.2025.11136454
[33] Khan, I.K., Daud, H.B., Zainuddin, N.B., et al. (2024). Determining the optimal number of clusters by enhanced gap statistic in K-mean algorithm. Egyptian Informatics Journal, 27: 100504. https://doi.org/10.1016/j.eij.2024.100504
[34] Wasilewski, A., Juszczyszyn, K., Suryani, V. (2024). Multi-factor evaluation of clustering methods for e-commerce application. Egyptian Informatics Journal, 28: 100562. https://doi.org/10.1016/j.eij.2024.100562
[35] Gueye, P.E.A., Deme, C.B., Ngom, D., Basse, A. (2025). Hybrid improved stacking over tabular temporal features with blockchain-certified data: Millet yield prediction and explainability. Information Dynamics and Applications, 4(4): 238-256. https://doi.org/10.56578/ida040405
[36] He, X., Little, M.A. (2024). EKM: An exact, polynomial-time algorithm for the K-medoids problem. arXiv preprint arXiv:2405.12237. https://doi.org/10.48550/ARXIV.2405.12237
[37] Passarella, R., Setiawan, M.I., Yamani, Z. (2025). Comparative analysis of machine learning models for predicting Indonesia’s GDP growth. Acadlore Transactions on AI and Machine Learning, 4(3): 157-173. https://doi.org/10.56578/ataiml040302
[38] Belany, P., Hrabovsky, P., Sedivy, S., Cajova Kantova, N., Florkova, Z. (2024). A comparative analysis of polynomial regression and artificial neural networks for prediction of lighting consumption. Buildings, 14(6): 1712. https://doi.org/10.3390/buildings14061712
[39] García García, C., Salmerón Gómez, R., García Pérez, J. (2022). A review of ridge parameter selection: Minimization of the mean squared error vs. mitigation of multicollinearity. Communications in Statistics - Simulation and Computation, 53(8): 3686-3698. https://doi.org/10.1080/03610918.2022.2110594
[40] Serefoglu Cabuk, K., Cengiz, S.K., Guler, M.G., et al. (2024). Chasing the objective upper eyelid symmetry formula; R2, RMSE, POC, MAE, and MSE. International Ophthalmology, 44: 303. https://doi.org/10.1007/s10792-024-03157-y