Fatima De Los Angeles Pacheco-Anton | Fabrizzio Alejandro Pauca-Muñoz | Allimson Julissa Borromeo-Quispe | Alex Jhoan Lozano-Villalobos | Jose Miguel Pariona-Sanchez | Maritza Raquel Cabana-Cáceres | Cristian Castro-Vargas*
© 2026 The authors. This article is published by IIETA and is licensed under the CC BY 4.0 license (http://creativecommons.org/licenses/by/4.0/).
OPEN ACCESS
This paper presents the design, implementation, and preliminary validation of a low-cost portable device for real-time monitoring of basic vital signs, namely heart rate and peripheral oxygen saturation (SpO₂), intended for preventive cardiovascular screening outside specialized clinical settings. The system integrates an ESP32 microcontroller with a MAX30102 photoplethysmography (PPG) sensor and a TFT display, and embeds a TensorFlow Lite Micro classifier mapping four features into five descriptive categories, with values transmitted over Wi-Fi to a cloud database. Bench accuracy was assessed against a commercial Food and Drug Administration (FDA)-cleared pulse oximeter (Contec CMS50D). In a short single-session comparison, the prototype showed a mean absolute percentage error (MAPE) of 1.8% for SpO₂ and 2.3% for heart rate, sub-500 ms latency, and six hours of autonomy. These results are derived from a single-session, single-participant comparison and are preliminary and not yet confirmed on a larger sample. The embedded classifier executed correctly in real time but is presented as a functional demonstrative module, since formal accuracy metrics on an independent test set were not collected. The work integrates real-time PPG acquisition, cloud telemetry, and on-device classification on a single low-cost platform, separating preliminary accuracy figures from the classifier's unvalidated status. Results suggest the architecture is a technically promising, economically accessible alternative for continuous monitoring in resource-constrained settings, pending larger-scale validation.
biomedical instrumentation, embedded machine learning, ESP32, Internet of Things, MAX30102, photoplethysmography, telemedicine, wearable device
Continuous monitoring of vital signs is a cornerstone of preventive and acute clinical care, enabling early detection of cardiovascular and respiratory deterioration [1]. Universal access to simple measurements such as heart rate and peripheral oxygen saturation (SpO₂) has been identified as a priority in regions where hospital infrastructure and specialized equipment remain scarce [1], and the broader literature on wearable sensor-based health monitoring has long emphasized the need for low-cost biomedical instrumentation that remains accurate while operating outside controlled clinical environments [2]. The emergence of integrated photoplethysmographic sensors, such as the MAX30102, has enabled the development of compact, low-cost wearable devices suitable for home and field use [3], while their pairing with Wi-Fi/Bluetooth-enabled microcontrollers such as the ESP32 has facilitated wireless transmission and remote management of biomedical data within Internet of Things (IoT) ecosystems [4, 5].
In many middle- and low-income countries, access to continuous vital-sign measurement devices is constrained by cost and technical complexity, a gap extensively documented in reviews of IoT-based healthcare-monitoring systems [6]. This gap is particularly relevant in Peru, where national health-survey data report that 14.2% of the population aged 15 years and older presented elevated blood pressure readings in 2024, with several regions exceeding 16% [7], underscoring the need for accessible cardiovascular screening tools that can operate outside specialized clinical settings. A portable, economical, and easy-to-use system that streams measurements to a remote platform addresses this gap by enabling preventive telemedicine and telemonitoring while reducing the dependency on dedicated hospital equipment, consistent with low-cost oximeter and IoT vital-sign monitoring proposals reported for similar contexts [8, 9], and aligns with the broader case made for smart-healthcare technologies and large-scale IoT patient-monitoring deployments [10, 11].
The general objective of this work is to design and implement a portable, low-cost device based on the ESP32 microcontroller and the MAX30102 sensor for the real-time monitoring of basic vital signs. The specific objectives are: (i) to develop the hardware architecture integrating the biometric sensor and a local display unit; (ii) to implement wireless connectivity for data transmission and cloud storage; (iii) to embed a compact machine learning classifier capable of mapping the acquired signals to descriptive physiological categories directly on the microcontroller; and (iv) to experimentally validate the accuracy of the optical measurements against a commercial pulse oximeter used as a reference device.
The measurement principle is based on photoplethysmography (PPG), a non-invasive optical technique that detects volumetric blood changes in tissue using red and infrared light, with adaptive filtering techniques commonly applied to improve heart-rate estimation from low-cost sensors [12], and digital signal-processing approaches remaining an active area of research for reducing motion and ambient-light noise in PPG acquisition [13]. The MAX30102 module integrates both emitters together with a photodetector, producing a signal from which heart rate and SpO₂ are derived after digital filtering. The ESP32 acts as the central processing unit, providing sufficient computational headroom, Wi-Fi/Bluetooth connectivity, and low power consumption, which together make it well suited for embedded biomedical IoT applications, as demonstrated by portable ESP32-based health-monitoring frameworks [14] and ESP32-based edge-computing architectures reported in the recent literature [15].
Several works have addressed the design of low-cost IoT vital-sign monitoring devices using the ESP32/MAX30102 combination. Dobbertin-Sanchez and Chinchay-Espino [8] developed a NodeMCU-based pulse oximeter targeting Peru's non-specialized population, reporting a low-cost design and basic SpO₂ monitoring without cloud connectivity or alerting. Contardi et al. [4] coupled an ESP32 to a MAX30102 sensor in a web-server architecture for continuous point-of-care SpO₂ and heart-rate monitoring, achieving stable continuous acquisition but without battery-powered portability or push alerts. Ashraf et al. [3] presented an open-source IoT health-monitoring system integrated with a cloud platform, reporting good telemedicine performance at the cost of higher firmware complexity. At a higher level of complexity, Alnajjar [16] developed a comprehensive wearable IoT cardiovascular platform including multi-parameter risk prediction, achieving high precision but with substantially greater hardware cost. Vyas et al. [14] reported a portable ESP32-based health-monitoring framework for home-based patient care, while Waleed et al. [11] conducted a systematic analysis of IoT patient-monitoring data challenges, identifying cloud connectivity and large-scale data handling as key open problems.
To state the key technical differences from these three closely related ESP32/MAX30102 prototypes explicitly, as requested during review: relative to Dobbertin-Sanchez and Chinchay-Espino [8] and Contardi et al. [4], both of which are restricted to a local web server without battery-powered portability or an automated alerting mechanism, the present device adds persistent cloud synchronization, a rechargeable battery power stage, and a threshold-based alerting pipeline. Relative to Vyas et al. [14], whose home-care framework does not report an on-device classification stage, the present work adds an embedded five-class TensorFlow Lite Micro classifier executing directly on the ESP32. A corresponding structured comparison is provided in Section 6. It should be emphasized, however, that this positioning reflects architectural scope rather than a demonstrated performance improvement: no head-to-head quantitative benchmark against these three specific systems was conducted, and the comparison should be read as a qualitative feature-level contrast rather than evidence that the present device outperforms them on any measured metric.
At the review level, Abdulmalek et al. [6] surveyed IoT-based healthcare-monitoring systems and highlighted accessible cardiovascular screening as a recurring unmet need in resource-constrained settings, while Ghazal et al. [10] reviewed smart-healthcare technologies more broadly and identified cloud-assisted, alert-capable architectures as a desirable direction for future IoT health devices. Regarding the embedded classifier, Tucker et al. [17] reviewed machine-learning deployment workflows for microcontroller-class hardware, while Filgueiras et al. [18] evaluated the accuracy of low-cost wearable sensors against medical-grade equipment, reporting error margins of the same order as those targeted in this work. Zhang et al. [19] proposed a convolutional classifier for ECG-based biometric identification, illustrating the broader use of curated, clinically derived datasets for biometric classification tasks, in contrast to the synthetic-data approach adopted here. On the communication side, Wytrębowicz et al. [20] compared IoT messaging protocols and reported latency and overhead advantages for publish-subscribe alternatives over simple HTTP/REST at larger deployment scales. Finally, Maqbool et al. [21] presented a smart sensing platform for diabetes patients, Georgieva-Tsaneva et al. [22] reported an IoT-based cardio-monitoring system for underserved contexts, and Uddin and Koo [23] reviewed multi-hop IoT patient-monitoring architectures aimed at extending remote-monitoring reach, and Verma et al. [24] evaluated a wearable continuous-temperature-monitoring device against medical-grade equipment, reporting accuracy figures of comparable order to those targeted in this work. Relative to these antecedents, the present work contributes a mid-complexity design that adds a persistent cloud back-end and an on-device five-class classifier to the existing ESP32/MAX30102 hardware baseline, while maintaining a low component cost and a single-battery form factor.
3.1 Research approach
The system was developed following a waterfall methodology comprising five sequential phases: requirements analysis, design, implementation, verification, and maintenance, which provided a structured and traceable development process well suited to a single-iteration hardware/firmware prototype, consistent with the development approach reported for comparable open-source IoT health-monitoring systems [3]. Each phase was completed and reviewed before the subsequent stage began, allowing early correction of design errors and consistent documentation of design decisions, in line with practices reported for other ESP32-based IoT device implementations [5].
3.2 Requirements analysis
Functional requirements specify that the device must: (i) measure heart rate and SpO₂ in real time; (ii) display results clearly on an integrated screen; (iii) transmit data through Wi-Fi/Bluetooth connectivity for later analysis; and (iv) remain portable and low-cost for use in domestic or rural settings. Non-functional requirements specify a minimum autonomy of six hours on a rechargeable battery, low energy consumption through efficient use of the microcontroller, a simple and intuitive user interface, and a compact, modular enclosure resistant to basic environmental conditions.
3.3 System architecture
The architecture is organized into five functional modules, following design principles for low-cost wearable cardiovascular monitoring systems reported in a previous study [16]: (1) a processing and communication module built around the ESP32 DevKit V1, responsible for signal processing, display control, and wireless data transmission; (2) a cloud back-end used for historical data storage, authentication, and the generation of alerts when critical thresholds are detected; (3) a data acquisition module comprising the MAX30102 optical sensor, which communicates with the microcontroller through the I²C bus; (4) a user-interface module composed of a 1.8-inch TFT display and a manual ON/OFF switch; and (5) a power module integrating a 3.7 V lithium-polymer battery, a TP4056 charging circuit, and a step-up/step-down voltage regulator. This modular separation of concerns follows recommendations for scalable embedded health-monitoring architectures, similar to ESP32-based wireless patient-monitor designs that separate sensing, processing, and communication layers [25], and allows future sensors, such as ECG front ends, to be integrated without redesigning the core firmware. Figure 1 summarizes the resulting block-level architecture and the interfaces connecting each module.
Figure 1. System architecture and module interconnections
3.4 Data flow
Upon power-up, the microcontroller initializes the I²C bus, configures the MAX30102 sensor, and attempts to join the configured Wi-Fi network. Once a finger is detected through an infrared-amplitude threshold, the sensor continuously samples red and infrared PPG signals; a peak-detection algorithm identifies systolic pulses and computes the inter-beat interval, from which heart rate is derived. Each valid beat triggers an SpO₂ estimate and a temperature reading, with continuous temperature monitoring being a recognized complementary indicator for early detection of physiological deterioration in wearable health devices [24], and the addition of a new sample to a rolling measurement session. Processed values are displayed locally and published to the cloud database through HTTP/REST calls. This acquisition-to-cloud pipeline mirrors validation methodologies reported for low-cost wearable vital-sign systems benchmarked against commercial reference devices [18], and the complete acquisition cycle repeats continuously while the device remains powered, minimizing latency between acquisition, processing, and remote visualization.
To specify the acquisition chain in the detail requested during review, the MAX30102 is configured with a sampling rate of 100 Hz (adequate for cardiac signals up to 180 bpm under the Nyquist criterion), an 8-sample internal averaging window to attenuate high-frequency noise, an LED pulse width of 411 μs, and a 12-bit ADC resolution (4096 counts). Finger presence is detected via a fixed infrared-amplitude threshold, below which no samples are processed. Beat detection uses a threshold-crossing peak-detection algorithm applied to the filtered PPG waveform: each detected systolic peak is timestamped, and the resulting inter-beat interval is converted to an instantaneous heart-rate estimate that is accepted only if it falls within a physiologically plausible range of 40–200 bpm, with out-of-range detections discarded as artifacts rather than propagated to the measurement session. This threshold-based scheme was chosen over a more elaborate adaptive filter, such as a Kalman or wavelet-based filter, for its low computational overhead on the ESP32; its robustness under motion artifacts, low-perfusion conditions, and varying skin pigmentation was not systematically characterized in this work, a limitation discussed further in Section 7.
3.5 Embedded classifier design
A compact neural network was integrated on-device using TensorFlow Lite for Microcontrollers, implementing embedded machine learning to provide a descriptive classification layer on top of the raw measurements. The network receives four input features: heart rate, SpO₂, MAX30102 sensor (auxiliary) temperature, and short-term heart-rate variability (computed as the standard deviation of the last ten beat-to-beat intervals), and maps them, through two dense hidden layers of 16 and 8 ReLU units with 20% dropout, to a five-class softmax output: normal, bradycardia, tachycardia, hypoxia, and an arrhythmia-like high-variability pattern. The complete model totals approximately 400 trainable parameters and requires a 10 KB static tensor arena, making it compatible with the memory budget of the ESP32.
Heart-rate variability is computed on-device using a two-pass algorithm over the circular buffer of the last N = 10 beat-to-beat intervals, and each of the four input features is normalized using a z-score transformation with fixed mean and standard deviation constants obtained during training (StandardScaler). The output layer applies the softmax function over the five output logits, and the predicted class is the index that maximizes the resulting probability (argmax), with the corresponding value reported on-screen as the confidence percentage. The formal definitions of these operations are given in Section 5.
The training dataset was synthetically generated rather than collected from real patients, using Gaussian and uniform distributions parameterized according to physiological ranges reported in the literature for each condition (60–90 bpm and 95–100% SpO₂ for the normal class; 100–130 bpm for tachycardia; 82–94% SpO₂ for hypoxia), producing 5000 balanced samples (1000 per class). This straightforward parameterized-distribution approach is considerably simpler than the more sophisticated synthetic-data generation methods described by Tucker et al. [17], but follows the same underlying motivation: producing usable training data for machine-learning healthcare software when access to large annotated clinical datasets is limited. The network was trained in Python with TensorFlow/Keras using the Adam optimizer, a sparse categorical cross-entropy loss, early stopping, and learning-rate reduction on plateau, for a maximum of 100 epochs. The trained model was subsequently quantized and converted into a C byte-array header file for direct inclusion in the ESP32 firmware, following the deployment workflow described for TinyML applications on microcontroller-class hardware [26]. It is important to note that this classifier is presented as a functional demonstrative module: it was exercised successfully on the physical prototype during live testing sessions, but a formal accuracy evaluation on an independent, held-out test partition was not performed at this stage; the full extent of this limitation and the corresponding validation plan are detailed in Section 6.3.
3.6 Communication model
The communication model follows a client-server architecture within the broader Internet of Things ecosystem, supported by the Wi-Fi connectivity of the ESP32. Processed heart-rate and SpO₂ values are transmitted via HTTP/REST to a cloud Realtime Database, where they are stored in a structured, queryable hierarchy. Communication is organized in three logical levels: at the acquisition level, the MAX30102 transmits PPG samples to the microcontroller over I²C; at the local-processing level, the ESP32 filters the signal and computes HR and SpO₂ using digital signal-processing algorithms; and at the external-communication level, processed data are published to the cloud and, when out-of-range values are detected, an instant notification can be issued to a companion messaging channel. HTTP/REST was favored over more specialized IoT messaging protocols for this prototype given its simplicity and broad library support, although a pragmatic comparison of IoT messaging protocols indicates that publish-subscribe alternatives may offer latency and overhead advantages at larger deployment scales [20]. A timeout-based fallback mechanism allows the device to continue local operation and on-screen display even if cloud authentication fails, which is a design requirement for biomedical devices that must remain functional under intermittent connectivity.
3.7 Hardware components and specifications
Table 1 summarizes the technical specifications of the microcontroller, and Table 2 summarizes the optical sensor used for signal acquisition. Component selection followed criteria of biometric accuracy, low power consumption, and ease of use reported as desirable for a non-specialized portable wearable device [3, 5]. Figure 2 and Figure 3 show the actual ESP32 DevKit V1 and MAX30102 modules used in the prototype assembly.
Table 1. ESP32 DevKit V1 technical specifications
|
Parameter |
Value |
|
Core |
Dual-core Xtensa LX6 |
|
Operating voltage |
3.3 V (logic) / 5 V (VIN / USB) |
|
Current consumption |
160–260 mA (Wi-Fi Tx); <10 µA (deep sleep) |
|
I/O ports |
Up to 30 GPIO (PWM, ADC, UART, I²C, SPI) |
|
Connectivity |
Wi-Fi 802.11 b/g/n, Bluetooth v4.2 BLE |
|
Role in system |
Central processing unit; sensor acquisition, classification, display, and wireless transmission |
Table 2. MAX30102 optical sensor specifications
|
Parameter |
Value |
|
Sensor type |
Optical heart-rate and SpO₂ sensor (photoplethysmography (PPG)) |
|
Operating voltage |
1.8 V (core); 3.3-5 V (module supply) |
|
Current consumption |
~600 µA (active); <1 µA (standby) |
|
Communication interface |
I²C (default address 0x57) |
|
Main components |
Red and infrared LEDs, high-sensitivity photodiode |
|
Role in system |
Captures the PPG signal used to derive heart rate and SpO₂ |
Figure 2. ESP32 DevKit V1 microcontroller module
Figure 3. MAX30102 optical photoplethysmography (PPG) sensor module (GY-MAX30102)
Local visualization is provided by a 1.8-inch TFT display (ST7735 controller, 128 × 160 px) communicating with the microcontroller over SPI, while portable power is supplied by a 3.7 V lithium-polymer battery managed by a TP4056 charging module with overcharge, over-discharge, and short-circuit protection. Table 3 lists the complete bill of materials used to assemble the protoboard prototype.
To substantiate the "low-cost" characterization used throughout this paper, approximate unit prices for the components listed in Table 3 were obtained from public electronics marketplaces rather than from the authors’ own itemized purchase records, which were not retained during assembly: the ESP32 DevKit V1 (approximately US\$5–10), the MAX30102 module (approximately US\$3–8), the ST7735 TFT display (approximately US\$4–8), the TP4056 charging module (approximately US\$1–2), the 2000 mAh LiPo battery (approximately US\$5–10), and minor components including protoboard, wiring, and switch (approximately US\$3–5), together totaling approximately US\$21–43 in component cost at generic-marketplace pricing, before shipping, taxes, or labor. This range is offered as an order-of-magnitude estimate rather than an itemized project expenditure, and should be interpreted accordingly. For comparison, basic single-function commercial fingertip pulse oximeters, including Food and Drug Administration (FDA)-cleared models such as the Contec CMS50D used as the reference instrument in this work, are also available at retail prices in a broadly overlapping or in some cases lower range; the present prototype should therefore not be characterized as unambiguously cheaper than a basic commercial oximeter, but rather as adding capabilities that basic oximeters lack, namely wireless connectivity, cloud synchronization, an on-device classification stage, and automated alerting, at a broadly comparable component cost. A rigorous cost comparison would additionally need to account for the certification, calibration, and quality-assurance costs embedded in commercial medical-device pricing, which are not incurred by this uncertified prototype.
Table 3. Bill of materials
|
Item |
Component |
Qty. |
Function |
|
1 |
ESP32 DevKit V1 |
1 |
Central processing and connectivity |
|
2 |
MAX30102 (GY-MAX30102) |
1 |
Optical photoplethysmography (PPG) sensor (HR / SpO₂) |
|
3 |
TFT display ST7735, 1.8" |
1 |
Local visualization (128 × 160 px) |
|
4 |
TP4056 charging module |
1 |
LiPo battery charge protection |
|
5 |
LiPo battery, 3.7 V |
1 |
Portable power source |
|
6 |
Half-size protoboard |
1 |
Temporary prototype assembly |
|
7 |
Dupont wires (M-M / M-F) |
15 |
Inter-module connections |
|
8 |
Miniature ON/OFF switch |
1 |
Manual power control |
3.8 Physical connections
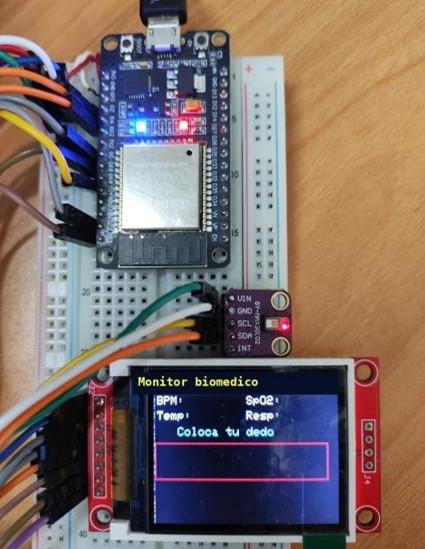
The MAX30102 sensor communicates with the ESP32 through the I²C bus using GPIO21 (SDA) and GPIO22 (SCL), while the TFT display uses the SPI interface, with chip-select, data/command, and reset control lines mapped to separate GPIOs. All modules share a common 3.3 V supply rail and ground plane on the protoboard. This wiring scheme allowed validation of every subsystem before transition to a dedicated enclosure. Figure 4 shows the assembled prototype, including the ESP32 microcontroller, the MAX30102 sensor module, and the TFT display prompting the user to place a finger on the sensor window. For reference, Figure 5 presents the schematic wiring diagram used to plan these connections prior to physical assembly; a top-down photograph of the actual physical wiring is presented in Section 4.5, alongside the functional validation results.
Figure 4. Assembled prototype hardware
Figure 5. Schematic wiring diagram of the prototype (ESP32, MAX30102, and TFT display)
3.9 Experimental validation procedure
Before physical assembly, the logical connections among the ESP32, the MAX30102, and the TFT display were verified using circuit-design and simulation tools (Proteus Design Suite and Tinkercad Circuits), employing a generic optical-sensor model with simulated voltage outputs to validate signal flow, since no native MAX30102 library exists for these tools. Firmware routines were subsequently tested through the Arduino IDE serial monitor to confirm correct analog-to-digital conversion and the heart-rate/SpO₂ computation pipeline. HTTP transmission to the cloud database was simulated to confirm transfer integrity prior to live testing.
After verifying the logic of the system, the physical prototype was assembled on a protoboard and tested under real conditions with several volunteer participants for general functional verification, following a real-time field-testing protocol similar to that reported for ESP32-based wireless health-monitoring systems validated under live patient-data conditions [27]. The quantitative accuracy comparison reported in Section 4.1 was conducted separately with a single volunteer participant. Optical readings were compared, beat by beat, against a Contec CMS50D commercial FDA-cleared pulse oximeter used as the reference instrument. Tests were repeated under ambient lighting and moderate-motion conditions to assess the stability of the filtering algorithm and the consistency of the sampling rate maintained by the ESP32. Continuous Wi-Fi connectivity to the cloud database was monitored over a two-hour session to evaluate transmission reliability and latency.
4.1 Accuracy against a clinical reference
Accuracy was quantified using the mean absolute percentage error (MAPE), formally defined in Section 5, where xi denotes the i-th prototype reading and ri the corresponding clinical-reference reading taken simultaneously. The reported error figures were obtained from a short bench-comparison session conducted with a single volunteer participant and a Contec CMS50D commercial FDA-cleared pulse oximeter as the reference instrument, rather than from a large, statistically powered sample; the resulting paired readings yielded a MAPE of 1.8% for SpO₂ and 2.3% for heart rate. These deviations are of the same order of magnitude as the error margins typically reported in the literature for low-cost optical pulse-oximetry sensors [4, 5, 14], suggesting that the prototype's accuracy is plausibly within an acceptable range for non-diagnostic, preventive monitoring applications; however, this single-session comparison should be treated as a preliminary indication rather than a statistically validated accuracy claim, and a larger, multi-participant validation is identified as necessary future work in Section 7. Figure 6 illustrates representative paired readings from this session, consistent with the reported error margin between the prototype and the reference instrument.
Figure 6. Comparison with clinical reference oximeter
The Contec CMS50D is an FDA-cleared pulse oximeter that has been employed as a reference instrument in PPG and vital-sign research, including studies using PPG-based machine learning classifiers [28]; its manufacturer-specified accuracy tolerance is ±2% for SpO₂ over the 70–100% range and ±2 bpm or ±2% (whichever is larger) for pulse rate [29]. No independent calibration certificate was obtained for the specific unit used in this comparison, and its measurement uncertainty was not verified against a calibration standard prior to testing. Consequently, part of the observed 1.8%/2.3% discrepancy between the prototype and the reference instrument may reflect the reference device's own specified tolerance rather than error intrinsic to the prototype, and the reported figures should be interpreted as an upper bound on prototype-specific error rather than an isolated measure of it.
This comparison carries substantial statistical limitations that constrain the strength of any accuracy claim. The evaluation involved a single volunteer participant in a single short session, without repeated-measures trials, without stratification across age groups or skin tones, and without a sample size sufficient to support confidence intervals or formal significance testing; the reported 1.8%/2.3% MAPE values should therefore be read strictly as observations from a single case rather than as a validated performance metric. Internationally accepted instrument-agreement methods, specifically Bland–Altman limits-of-agreement analysis and a correlation coefficient, such as Pearson's r or Lin's concordance correlation coefficient, were not applied, since the single-session dataset does not provide a sufficient number of independent paired observations across a clinically meaningful range of SpO₂ and heart-rate values to support a meaningful agreement analysis; reporting only a mean error value under these conditions could otherwise overstate the strength of the evidence, and this limitation is stated explicitly here rather than omitted. A statistically powered, multi-subject protocol with Bland–Altman analysis and correlation reporting is identified as a prerequisite for any future claim of measurement equivalence and is stated as required future work in Section 7.
4.2 Transmission latency
End-to-end latency from sensor acquisition to cloud-database update was measured at five points during a continuous two-hour monitoring session. The average delay increased gradually from 420 ms at the start of the session to 490 ms after two hours (Figure 7), remaining below the 500 ms threshold throughout the test and confirming that the device sustains near-real-time updates suitable for remote visualization without perceptible lag for the end user [20, 10]. No packet loss was observed during the monitored session.
Figure 7. End-to-end transmission latency over time
4.3 Energy autonomy
With a 2000 mAh lithium-polymer battery, the prototype sustained approximately six hours of continuous operation with Wi-Fi transmission active, meeting the non-functional requirement defined in Section 3.2. This autonomy is consistent with values reported for comparable ESP32-based wearable health-monitoring prototypes operating with active wireless connectivity.
This six-hour figure was obtained as a single end-to-end runtime measurement (time from full charge to automatic shutdown) rather than from an instrumented current-draw profile; no current waveform, no breakdown between active Wi-Fi-transmission states and idle/sensing-only states, and no repeated-trial variance are reported. Consequently, the reported autonomy should be read as a single-trial, whole-system estimate rather than a characterized power budget, and a more granular measurement protocol using a current-sense instrument to separate the Wi-Fi-transmission, sensing, and display-refresh power states is identified as necessary future work in Section 7.
4.4 Synthetic dataset characterization
Table 4 summarizes the heart-rate distribution generated for each of the five classifier classes, characterizing the 5,000-sample synthetic dataset (1,000 samples per class) used to train the embedded classifier. The normal, bradycardia, and tachycardia classes were generated within explicit physiological ranges reported in the literature, while the hypoxia and arrhythmia classes were generated from Gaussian distributions specified only by mean and standard deviation, without an explicitly bounded range; both characterizations are reported as originally defined, rather than approximating an unstated range. The cited ranges for the normal, bradycardia, and tachycardia classes reflect general clinical reference intervals reported in the literature rather than population statistics specific to the deployment context of this device, and no formal statistical comparison, such as distributional distance or overlap testing, was performed between the synthetic samples and real clinical measurement distributions. Because the classifier is trained exclusively on synthetic, noise-free feature vectors rather than on features extracted from real, sensor-derived PPG signals affected by motion artifacts, inter-individual variability, or skin-tone-dependent signal quality, a meaningful domain-shift gap between training and deployment conditions is expected but was not characterized in this work; this risk is stated explicitly as a limitation rather than left implicit, and its quantification against a real-patient dataset is identified as necessary future work in Section 7.
Figure 8. Synthetic dataset: Heart-rate distribution per class
Table 4. Heart-rate distribution per class in the synthetic training dataset
|
Class |
Samples |
Heart-Rate Distribution |
Distinguishing Feature |
|
Normal |
1,000 |
60–90 bpm (range) |
Healthy autonomic regulation |
|
Bradycardia |
1,000 |
40–60 bpm (range) |
Reduced heart rate |
|
Tachycardia |
1,000 |
100–130 bpm (range) |
Elevated heart rate, low variability |
|
Hypoxia |
1,000 |
mean 95, SD 12 bpm |
SpO₂ 82–94% (range) |
|
Arrhythmia |
1,000 |
mean 85, SD 20 bpm |
Highest heart-rate variability (15–30 ms) |
Figure 8 illustrates the same heart-rate distributions graphically, showing the explicit ranges for the normal, bradycardia, and tachycardia classes alongside the mean and one-standard-deviation interval reported for the hypoxia and arrhythmia classes.
4.5 Functional validation of the embedded classifier
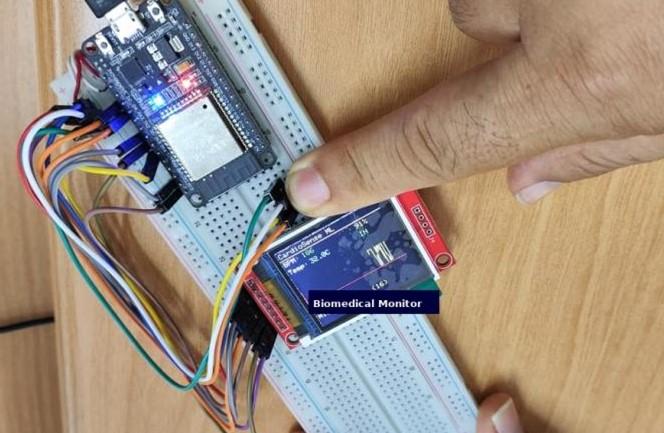
The on-device classifier was exercised successfully during live testing sessions, correctly executing inference on the four normalized input features and returning a class label together with a softmax-derived confidence percentage, displayed in real time on the local TFT screen and published to the cloud database. Figure 9 shows a top-down view of the assembled prototype during a live testing session, with the MAX30102 sensor, ESP32 microcontroller, and TFT display visibly wired and operating together, confirming end-to-end sensor acquisition, on-device inference, and local display under realistic operating conditions. This confirms that the inference pipeline, including feature normalization, tensor allocation, and the TensorFlow Lite Micro interpreter, executes correctly within the memory and timing constraints of the ESP32. As noted in Section 3.5, a formal accuracy assessment of the classifier on an independent, statistically representative test set was not performed at this stage of the work; the model should therefore be regarded as a functional demonstrative module rather than a clinically validated diagnostic classifier, a limitation examined in full in Section 6.3.
Figure 9. Physical connections between ESP32, MAX30102 sensor (GY-MAX30102), and TFT display, validated during functional testing
4.6 Comparison with related work
Table 5 compares the proposed system against closely related ESP32/MAX30102-based monitoring prototypes reported in the recent literature, in terms of measured parameters, connectivity, and reported error or accuracy figures, including precise-timing-oriented ESP32 IoT architectures [30] and broader connected-health ecosystems built on similar IoT-enabled monitoring principles [31]. Table 5 should be read as a qualitative, feature-level comparison rather than a quantitative benchmark: the reported outcomes for each system were obtained under different validation protocols and are not directly comparable performance metrics.
Table 5. Comparison with related ESP32/MAX30102-based monitoring systems
|
Study |
Hardware |
Parameters |
Connectivity |
Reported Outcome |
|
This work |
ESP32 + MAX30102 + TFT |
HR, SpO₂, temp. |
Wi-Fi + cloud DB |
Preliminary MAPE 1.8% SpO₂ / 2.3% HR (n = 1 session); <500 ms latency |
|
Dobbertin-Sanchez and Chinchay-Espino [8] |
NodeMCU + MAX30102 |
HR, SpO₂ |
Local web server |
Low-cost design; no cloud alerting |
|
Contardi et al. [4] |
ESP32 + MAX30102 |
HR, SpO₂ |
Local web server |
Stable continuous monitoring; no battery/alerts |
|
Ashraf et al. [3] |
ESP32 + sensors |
Basic vitals |
IoT cloud |
Good telemedicine performance; higher complexity |
|
Alnajjar [16] |
Wearable IoT |
Cardiovascular panel |
IoT + advanced analytics |
High precision; higher cost and complexity |
|
Ya'acob et al. [27] |
ESP32 |
Vitals |
Real-time IoT |
Stable communication; no local display |
5.1 Heart-rate variability
Heart-rate variability is computed on-device using a two-pass algorithm over the circular buffer of the last N = 10 beat-to-beat intervals B = {b₁, b₂, ..., bN}. First, the arithmetic mean of the buffer is computed as in Eq. (1):
$\bar{b}=\frac{1}{N}\underset{i=1}{\overset{N}{\mathop \sum }}\,{{b}_{i}}$ (1)
The variability feature is then obtained as the sample standard deviation of the same buffer, as in Eq. (2):
$HRV=\sqrt{\frac{1}{N}\underset{i=1}{\overset{N}{\mathop \sum }}\,{{\left( {{b}_{i}}-\bar{b} \right)}^{2}}}$ (2)
5.2 Feature normalization and classification
Prior to inference, each of the four input features x (heart rate, SpO₂, temperature, and HRV) is normalized using the z-score transformation given in Eq. (3), where μ and σ are the per-feature mean and standard deviation computed on the training set and stored as fixed constants (StandardScaler) for use at runtime.
${x}'=\frac{\left( x-\mu \right)}{\sigma }$ (3)
The output layer applies the softmax function given in Eq. (4) over the five output logits z, converting them into a probability distribution across the five descriptive classes:
${{p}_{k}}=\frac{exp\left( {{z}_{k}} \right)}{\mathop{\sum }_{j=1}^{5}exp\left( {{z}_{j}} \right)}$ (4)
The predicted class is the index that maximizes pk (argmax), with the corresponding probability displayed on the local screen and published to the cloud database as the confidence percentage.
5.3 Accuracy metric
Bench accuracy against the clinical reference instrument was quantified using the MAPE, defined in Eq. (5):
$MAPE=\frac{100}{n}\underset{i=1}{\overset{n}{\mathop \sum }}\,\left| \frac{{{x}_{i}}-{{r}_{i}}}{{{r}_{i}}} \right|$ (5)
6.1 Interpretation of the validation results
The MAPEs obtained from the single-session bench comparison (1.8% for SpO₂ and 2.3% for heart rate) are of the same order of magnitude as values commonly reported for consumer-grade PPG sensors when benchmarked against clinical reference instruments, consistent with accuracy figures reported for comparable low-cost wearable biomedical instrumentation evaluated against medical-grade equipment [24]. However, these results should not yet be interpreted as a statistically validated accuracy claim, given the limited validation sample.
This preliminary level of agreement would be adequate for preventive, non-diagnostic screening if confirmed by additional validation, including larger sample sizes, motion-artifact stress-testing, and inter-device repeatability studies, before being considered for clinical decision support; this observation is consistent with continuous wearable-device temperature-monitoring studies that similarly stress the gap between bench-level accuracy and clinical-grade validation [24].
The sub-500 ms transmission latency observed over a two-hour session indicates that the chosen communication stack, HTTP/REST over Wi-Fi to a cloud Realtime Database, is adequate for near-real-time remote visualization.
Nevertheless, latency showed a mild upward drift over time that merits further investigation, possibly related to growing database indexing overhead or background Wi-Fi stack activity on the microcontroller.
Table 6 contrasts each non-functional requirement defined in Section 3.2 with the corresponding experimental outcome.
Table 6. Non-functional requirements versus experimental outcomes
|
Requirement (Section 3.2) |
Target |
Observed Outcome |
Status |
|
Battery autonomy |
Greater than or equal to 6 h |
Approximately 6 h with Wi-Fi active |
Yes |
|
Measurement accuracy |
Not formally specified |
MAPE 1.8% SpO₂, 2.3% HR vs clinical reference (single-session, single-participant comparison) |
Partial |
|
Transmission latency |
Near real time |
420 to 490 ms over a 2 h session |
Yes |
|
Portability and cost |
Low-cost, compact |
Protoboard prototype, commodity components |
Yes |
|
Classifier validation |
Functional integration |
Executes correctly; accuracy not yet measured |
Partial |
6.2 Positioning relative to the literature
Compared with earlier ESP32/MAX30102 prototypes that rely on a local web server for visualization [8], the system described here adds a persistent cloud back-end and an on-device classifier, extending the design toward the cloud-assisted, alert-capable architectures advocated in recent IoT-health reviews [10, 11]. At the same time, more elaborate wearable systems that integrate multi-parameter cardiovascular risk models report higher overall precision but at substantially greater hardware cost and design complexity [16]. The proposed device is therefore positioned as an intermediate solution, more capable than a bare local-display prototype, yet considerably simpler and lower-cost than a fully clinical-grade wearable platform.
6.3 Role and limitations of the embedded classifier
The decision to use embedded machine learning, via a compact TensorFlow Lite Micro classifier running directly on the ESP32, rather than relying solely on cloud-side inference, follows the broader movement toward edge-based biomedical signal processing on microcontroller-class hardware, which reduces dependency on connectivity and improves response time for borderline-condition flagging [26]. However, two limitations must be stated explicitly. First, the training dataset was synthetically generated from parameterized statistical distributions rather than collected from real patients, following established methods for generating synthetic patient data when annotated clinical datasets are not yet available [17]; while this allowed rapid prototyping of the inference pipeline, it does not substitute for a dataset derived from clinically annotated recordings, a limitation also acknowledged in biometric classification work that relies on curated reference datasets [21]. Second, and most importantly, no formal accuracy, precision, recall, or F1-score evaluation was performed on an independent, held-out test partition that was never used during training. The Python-side development pipeline used to train the model did include a separate internal validation split during training, used solely for training control (early-stopping and hyperparameter monitoring) rather than as an independent test set. This internal split was also used for per-class evaluation (precision, recall, F1-score, and a confusion matrix) as part of standard model-development practice; however, the specific numeric results of that internal-split evaluation were not retained or reported for this manuscript, and this internal validation split should not be read as equivalent to a formal, independent test-set evaluation. This reporting gap is distinct from, and in addition to, the absence of a dedicated post-deployment validation on the embedded target. No cross-validation was performed at any stage, and the train/validation split ratio used during development is not reported here. Consequently, the classifier is presented strictly as a functional demonstrative module: it correctly executes the complete inference pipeline on real sensor data in real time, rather than functioning as a validated diagnostic tool, and none of its class-prediction outputs used elsewhere in this paper should be read as having been independently verified against ground-truth labels. Reporting this limitation transparently is preferable to presenting unverified performance figures, and a fully documented train/validation/test protocol with quantitative metrics and a confusion matrix is stated as a required next step for the project in Section 7.
6.4 Implications for resource-constrained settings
The combination of low component cost, six-hour battery autonomy, and cloud connectivity supports the telemedicine use case originally motivating this work: preventive cardiovascular screening in settings with limited access to specialized equipment [6], a need also highlighted by intelligent sensing platforms designed for chronic-disease populations [22] and by IoT-based cardio-monitoring systems aimed at similar underserved contexts [23]. The modular architecture also facilitates classroom and laboratory use for engineering education, since each subsystem, namely acquisition, processing, display, connectivity, and power, can be assembled, tested, and replaced independently using standard prototyping tools, consistent with pedagogical goals reported for similar wireless health-monitoring teaching platforms [20], and supports broader use of low-cost biomedical instrumentation in engineering curricula.
6.5 Limitations of the study
Several additional limitations qualify the present findings and are summarized below.
This work presented the design, implementation, and preliminary experimental validation of a portable, low-cost IoT wearable device for monitoring basic vital signs, namely heart rate and SpO₂, built around an ESP32 microcontroller and a MAX30102 optical sensor, complemented by a compact on-device machine-learning classifier and cloud-based remote storage. A short, single-session bench comparison against a clinical pulse oximeter showed a MAPE of 1.8% for SpO₂ and 2.3% for heart rate, and the system sustained sub-500 ms cloud-transmission latency and approximately six hours of autonomy on a single battery charge. These preliminary results are encouraging and suggest that the proposed architecture is a plausible, accessible alternative for continuous physiological monitoring outside specialized clinical environments, comparing favorably in design scope with related ESP32/MAX30102 prototypes that omit cloud connectivity or persistent alerting, as summarized in Section 4.6; however, the accuracy figures should be read as a preliminary indication rather than a statistically validated claim, given the limited validation sample. The principal novelty lies not in any single component, since each is individually well established in the literature, but in their integration into a single reproducible, low-cost platform that explicitly separates these preliminary bench-accuracy figures from the classifier's current demonstrative status.
The embedded classifier demonstrated correct end-to-end functional operation, including signal acquisition, feature normalization, and on-device inference, but was not subjected to a formal accuracy evaluation in this stage of the work; this is identified explicitly as a priority for subsequent research rather than presented as a validated outcome. Future work should therefore prioritize: (i) conducting a larger, multi-participant bench validation with a statistically meaningful number of paired readings to confirm the preliminary accuracy figures reported in Section 4.1; (ii) collecting a labeled dataset from real participants under institutional ethical approval to retrain and rigorously evaluate the classifier, including precision, recall, and F1-score on a held-out test partition; (iii) migrating the prototype from a protoboard assembly to a dedicated printed circuit board and an enclosed, ergonomic wearable-device housing; (iv) extending the sensing front end with complementary signals such as single-lead ECG; and (v) benchmarking latency and battery autonomy under sustained multi-day operation rather than the two-hour session evaluated here. Taken together, the results support the continued development of compact, edge-capable IoT devices as a practical, technically grounded contribution toward more accessible preventive cardiovascular health monitoring in resource-constrained settings, while transparently identifying the larger-scale validation still required before broader deployment.
In direct response to the additional methodological gaps identified during review, three further items are added to this future-work agenda. First, the planned multi-participant validation should apply internationally accepted instrument-agreement methods, specifically Bland–Altman limits-of-agreement analysis and a correlation coefficient, rather than a mean-error value alone, and should report the calibration status of the reference instrument used. Second, the classifier retraining described above should include k-fold cross-validation in addition to a held-out test partition, with the full confusion matrix and per-class metrics reported rather than aggregate accuracy alone. Third, because PPG-based optical sensing is known to be sensitive to skin pigmentation, motion artifacts, and peripheral perfusion, with documented racial bias reported for clinical-grade pulse oximeters [32], the planned validation protocol should explicitly stratify participants by skin tone and include controlled motion and activity conditions, none of which were tested in the present single-session, single-participant evaluation.
All bench and field validation sessions described in this work involved adult volunteer participants (including a faculty member acting as a test user) who were verbally informed of the purpose and non-invasive nature of the optical measurements and gave their informed verbal consent prior to participation. No clinical, diagnostic, or identifying personal health data were collected or retained beyond the immediate validation session; only aggregate heart-rate, SpO₂, and latency measurements reported in Section 4 were recorded for analysis. A formal institutional ethics-committee review was not required for this bench-validation stage, as no clinical intervention, vulnerable population, or invasive procedure was involved; such formal approval is planned for the future, larger-scale validation study described in Section 7.
To answer directly how this determination was reached: no formal application was submitted to, and no exemption was granted by, an institutional ethics committee or review board for this bench-validation stage. The assessment that formal review was not required was made informally by the research team and supervising faculty, based on the activity involving only non-invasive optical measurement of consenting adult volunteers, no clinical diagnosis or treatment, no vulnerable population, and no retention of identifying data, rather than through a documented institutional exemption process. The authors recognize that this informal, team-level determination does not carry the same weight as a documented institutional ethics review and state this explicitly as a limitation of the present study rather than presenting it as equivalent to one. The larger, multi-participant validation study identified as future work in Section 7 will be submitted for formal institutional ethical review prior to any data collection, and the resulting approval or exemption documentation will be obtained and reported at that stage.
The authors thank the Facultad de Ingeniería Electrónica e Informática (FIEI), Universidad Nacional Federico Villarreal (UNFV), for institutional support during the development of this work.
|
b̄ |
running arithmetic mean of the beat-to-beat interval buffer, ms |
|
bi |
i-th beat-to-beat interval in the buffer, ms |
|
HRV |
short-term heart-rate variability feature, ms |
|
MAPE |
mean absolute percentage error, % |
|
N |
size of the beat-to-beat interval buffer (N = 10), dimensionless |
|
n |
number of paired samples in the bench-comparison session, dimensionless |
|
pk |
softmax output probability for class k, dimensionless |
|
ri |
i-th clinical-reference reading, dimensionless |
|
x |
raw input feature value prior to normalization, dimensionless |
|
x' |
normalized input feature value, dimensionless |
|
xi |
i-th prototype reading, dimensionless |
|
zk |
output logit for class k prior to softmax, dimensionless |
|
Greek symbols |
|
|
μ |
per-feature mean computed on the training set, dimensionless |
|
σ |
per-feature standard deviation computed on the training set, dimensionless |
|
Subscripts |
|
|
i |
index over the beat-to-beat buffer or the paired-sample sequence |
|
j, k |
index over the five output classes of the softmax layer |
|
max, min |
upper and lower bound of the configured physiological alerting range |
[1] Ansermino, J. (2013). Universal access to essential vital signs monitoring. Anesthesia & Analgesia, 117(4): 883-890. https://doi.org/10.1213/ANE.0b013e3182a1f22f
[2] Pantelopoulos, A., Bourbakis, N.G. (2010). A survey on wearable sensor-based systems for health monitoring and prognosis. IEEE Transactions on Systems, Man, and Cybernetics, Part C (Applications and Reviews), 40(1): 1-12. https://doi.org/10.1109/TSMCC.2009.2032660
[3] Ashraf, S., Khattak, S.P., Iqbal, M.T. (2023). Design and implementation of an open-source and Internet-of-Things-based health monitoring system. Journal of Low Power Electronics and Applications, 13(4): 57. https://doi.org/10.3390/jlpea13040057
[4] Contardi, U.A., Morikawa, M., Brunelli, B., Thomaz, D.V. (2022). MAX30102 photometric biosensor coupled to ESP32-webserver capabilities for continuous point of care oxygen saturation and heartrate monitoring. Engineering Proceedings, 16(1): 9. https://doi.org/10.3390/IECB2022-11114
[5] Hercog, D., Lerher, T., Truntič, M., Težak, O. (2023). Design and implementation of ESP32-based IoT devices. Sensors, 23(15): 6739. https://doi.org/10.3390/s23156739
[6] Abdulmalek, S., Nasir, A., Jabbar, W.A., et al. (2022). IoT-based healthcare-monitoring system towards improving quality of life: A review. Healthcare, 10(10): 1993. https://doi.org/10.3390/healthcare10101993
[7] Instituto Nacional de Estadística e Informática (INEI). (2025). Perú: Enfermedades No Transmisibles y Transmisibles, 2024. https://www.gob.pe/institucion/inei/informes-publicaciones/6813669-peru-enfermedades-no-transmisibles-y-transmisibles-2024.
[8] Dobbertin-Sanchez, S.E., Chinchay-Espino, H.A. (2023). Low-cost IoT-based oximeter controlled by NodeMCU and MAX30102 targeting Peru's non-specialized population in 2022. SSRN 4361276. https://doi.org/10.2139/ssrn.4361276
[9] Vela Mosquera, J.C., Mera Otoya, E.P., Palacios Acosta, E.A. (2024). Propuesta de un sistema de monitoreo de indicadores de salud mediante IoT para la toma de signos vitales. Revista Social Fronteriza, 4(1): e41169. https://doi.org/10.59814/resofro.2024.4(1)169
[10] Ghazal, T.M., Hasan, M.K., Alshurideh, M.T., et al. (2021). IoT for smart cities: Machine learning approaches in smart healthcare—A review. Future Internet, 13(8): 218. https://doi.org/10.3390/fi13080218
[11] Waleed, M., Kamal, T., Um, T.W., Hafeez, A., Habib, B., Skouby, K.E. (2023). Unlocking insights in IoT-based patient monitoring: Methods for encompassing large-data challenges. Sensors, 23(15): 6760. https://doi.org/10.3390/s23156760
[12] Fallet, S., Vesin, J.M. (2017). Robust heart rate estimation using wrist-type photoplethysmographic signals during physical exercise: An approach based on adaptive filtering. Physiological Measurement, 38(2): 155-170. https://doi.org/10.1088/1361-6579/aa506e
[13] Ismail, S., Akram, U., Siddiqi, I. (2021). Heart rate tracking in photoplethysmography signals affected by motion artifacts: A review. EURASIP Journal on Advances in Signal Processing, 2021: 5. https://doi.org/10.1186/s13634-020-00714-2
[14] Vyas, H., Shukla, H., Jivani, M.N. (2025). A portable IoT-based health monitoring framework using ESP32 for isolated and home-based patient care. Journal of Electronics and Automation Engineering, 4(2): 240-245. https://doi.org/10.46632/jeae/4/2/31
[15] Chang, Y.H., Wu, F.C., Lin, H.W. (2025). Design and implementation of ESP32-based edge computing for object detection. Sensors, 25(6): 1656. https://doi.org/10.3390/s25061656
[16] Alnajjar, R. (2025). A low-cost, wearable IoT system for comprehensive cardiovascular health monitoring and disease risk prediction. TechRxiv. https://doi.org/10.36227/techrxiv.175691251.13763523/v1
[17] Tucker, A., Wang, Z.C., Rotalinti, Y., Myles, P. (2020). Generating high-fidelity synthetic patient data for assessing machine learning healthcare software. npj Digital Medicine, 3: 147. https://doi.org/10.1038/s41746-020-00353-9
[18] Filgueiras, T.P., Bertemes-Filho, P., Noveletto, F. (2025). Evaluating the accuracy of low-cost wearable sensors for healthcare monitoring. Micromachines, 16(7): 791. https://doi.org/10.3390/mi16070791
[19] Zhang, Q.X., Zhou, D., Zeng, X. (2017). HeartID: A multiresolution convolutional neural network for ECG-based biometric human identification in smart health applications. IEEE Access, 5: 11805-11816. https://doi.org/10.1109/ACCESS.2017.2707460
[20] Wytrębowicz, J., Cabaj, K., Krawiec, J. (2021). Messaging protocols for IoT systems—A pragmatic comparison. Sensors, 21(20): 6904. https://doi.org/10.3390/s21206904
[21] Maqbool, S., Bajwa, I.S., Maqbool, S., Ramzan, S., Chishty, M.J. (2023). A smart sensing technologies-based intelligent healthcare system for diabetes patients. Sensors, 23(23): 9558. https://doi.org/10.3390/s23239558
[22] Georgieva-Tsaneva, G., Cheshmedzhiev, K., Tsanev, Y.A., Dechev, M., Popovska, E. (2025). Healthcare monitoring using an Internet of Things-based cardio system. IoT, 6(1): 10. https://doi.org/10.3390/iot6010010
[23] Uddin, R., Koo, I. (2024). Real-time remote patient monitoring: A review of biosensors integrated with multi-hop IoT systems via cloud connectivity. Applied Sciences, 14(5): 1876. https://doi.org/10.3390/app14051876
[24] Verma, N., Haji-Abolhassani, I., Ganesh, S., Vera-Aguilera, J., Paludo, J., Heitz, R. (2021). A novel wearable device for continuous temperature monitoring & fever detection. IEEE Journal of Translational Engineering in Health and Medicine, 9: 1-7. https://doi.org/10.1109/JTEHM.2021.3098127
[25] K K, M.R., Nasor, M., Zidan, R., Alsarraj, I., Hasan, B. (2023). IoT-based wireless patient monitor using ESP32 microcontroller. In 2023 24th International Arab Conference on Information Technology (ACIT), Ajman, United Arab Emirates, pp. 1-6. https://doi.org/10.1109/ACIT58888.2023.10453847
[26] Saha, S.S., Sandha, S.S., Srivastava, M. (2022). Machine learning for microcontroller-class hardware: A review. IEEE Sensors Journal, 22(22): 21362-21390. https://doi.org/10.1109/JSEN.2022.3210773
[27] Ya'acob, N., Ismail, S.I., Amin, M.Z.M., Aziz, N.F.A. (2024). Design and implementation of a wireless health monitoring system for real-time patient data using ESP32. In 2024 IEEE 15th Control and System Graduate Research Colloquium (ICSGRC), Shah Alam, Malaysia, pp. 149-153. https://doi.org/10.1109/ICSGRC62081.2024.10691254
[28] Kanwal, K., Khalid, S.G., Asif, M., Zafar, F., Qurashi, A.G. (2024). Diagnosis of community-acquired pneumonia in children using photoplethysmography and machine learning-based classifier. Biomedical Signal Processing and Control, 87: 105367. https://doi.org/10.1016/j.bspc.2023.105367
[29] Contec Medical Systems Co., Ltd. (Medical Test Supply distribution copy). Instructions for CMS-50D Pulse Oximeter: Measurement accuracy ±2% for SpO2 in the 70–100% range (unspecified below 70%), and ±2 bpm or ±2% (whichever is larger) for pulse rate. Archived distribution copy (official manufacturer manual not independently located). https://archive.org/details/manualzilla-id-5677244.
[30] Barral Vales, V., Fernandez, O.C., Dominguez-Bolano, T., Escudero, C.J., Garcia-Naya, J.A. (2022). Fine time measurement for the Internet of Things: A practical approach using ESP32. IEEE Internet of Things Journal, 9(19): 18305-18318. https://doi.org/10.1109/JIOT.2022.3158701
[31] Ianculescu, M., Constantin, V.Ș., Gușatu, A.M., et al. (2025). Enhancing connected health ecosystems through IoT-enabled monitoring technologies: A case study of the Monit4Healthy system. Sensors, 25(7): 2292. https://doi.org/10.3390/s25072292
[32] Sjoding, M.W., Dickson, R.P., Iwashyna, T.J., Gay, S.E., Valley, T.S. (2020). Racial bias in pulse oximetry measurement. The New England Journal of Medicine, 383(25): 2477-2478. https://doi.org/10.1056/NEJMc2029240