Lavanya Subramaniam* | Murali Babu Balasundaram
© 2026 The authors. This article is published by IIETA and is licensed under the CC BY 4.0 license (http://creativecommons.org/licenses/by/4.0/).
OPEN ACCESS
This study aims to develop a novel deep learning model that can accurately predict diabetic retinopathy (DR) before the appearance of lesions. The proposed model, Causal-Aware Pillar Transformer-Diabetic Retinopathy (CAPT-DR), utilizes a Causal-Aware Pillar Transformer (PT) to combine hierarchical representations of retinal features with systemic risk factors using structural causal model (SCM). The PT utilizes vertical spatial encoding to identify multiscale microvascular patterns, which are useful for detecting early capillary rarefaction and remodeling. The model was evaluated using 48,326 fundus images and 6,214 optical coherence tomography angiography (OCTA) scans from three separate datasets. The CAPT-DR, achieved a high area under the receiver operating characteristic curve (AUROC) of 0.934 (95% CI: 0.921-0.946) for the early prediction of DR onset within 24 months, outperforming convolutional neural network (CNN) and Vision Transformer (ViT) approaches, which achieved 0.872 and 0.901, respectively. In addition, the proposed model was able to increase sensitivity at 90% specificity by 11.3% and reduce calibration error by 0.021. The proposed model also utilized the Microvascular Instability Index (MII), which showed strong prognostic value for DR, with a hazard ratio (HR) of 2.87 (p < 0.001). Counterfactual analysis also indicated that a 1% reduction in HbA1c resulted in a relative risk reduction of 18.6%. CAPT-DR enables accurate early DR risk prediction by combining retinal representation learning with causal modeling, thereby supporting improved preventive intervention strategies.
diabetic retinopathy, causal learning, Pillar Transformer, microvascular instability, multimodal imaging, Explainable Artificial Intelligence
Diabetes-related blindness and vision impairment are still a major cause of preventable vision loss around the world. An estimated 30% of diabetics would have diabetic retinopathy (DR), which is responsible for the global burden on health economies. Current clinical diagnosis continues to focus primarily on the identification of visible retinal lesions, including microaneurysms, hemorrhages, and exudates, by way of standard retinal imaging. However, many studies have shown that there is a significant amount of time (usually years) between the onset of microvascular dysfunction and capillary instability as compared to the presence of clinically evident abrasions/lesions on the retina [1]. Therefore, the identification of these early pathophysiological changes prior to the onset of irreversible damage to the retina presents a significant unmet need for preventive ophthalmology.
Recent advances in deep learning have enabled the automation of DR grading through the use of convolutional neural networks (CNNs), as well as through the use of Vision Transformer (ViT) architectures. While these models offer extremely high levels of diagnostic accuracy at various stages of disease, they primarily classify the pixels within the image against known criteria [2]. Therefore, they do not explicitly model vascular architecture or the association between vascular disease and systemic disease risk in the form of metabolic dysregulation (HbA1c elevation, non-complex, chronic diabetes duration of time, as well as hypertension and dyslipidemia). Thus, the existing methods lack the mechanistic reasoning needed to help predict early risk in a clinically interpretable manner and provide clinical decision support [3]. Recent discoveries in optical coherence tomography angiography (OCTA) and high-resolution fundus visuals show the need to identify subtle vascular remodelling patterns in the early stages of DR that may include capillary rarefaction, changes in vessel density, and perturbations in vascular connection (i.e., connectivity) [4]. To identify these hierarchical microvascular signatures requires an architectural design to model the spatial patterning connecting across multiple receptive fields (i.e., local) instead of just at a local level. Transformer-based algorithms use globally contextual representations for learning; however, patch-wise tokenization used in conventional methods may dilute the fine-level vascular topologies. Thus, failing to maintain structural coherence at multiple levels of the vascular network. In order to overcome these challenges, we introduce a Causal-Aware Pillar Transformer-Diabetic Retinopathy (CAPT-DR) Network for predicting early microvascular instability in patients with DR [5-7]. The proposed method employs a novel pillar-based hierarchical encoding strategy that vertically aggregates retinal features of various spatial scales to retain microvascular structural coherence when representing those patterns of the vascular network. Alongside the pillar-based encoding strategy, we integrate a structural causal model (SCM) layer that will disentangle direct from indirect systemic metabolic risk factors that contribute to a patient’s retinal vascular instability. This level of architectural design enables representations of microvascular networks with both high fidelity and clinically relevant counterfactual inferences. In addition, we will present a quantitative biomarker identified as the Microvascular Instability Index (MII) [8]. MII is derived from attention-based entropy and from the vascular connection perturbations obtained through the CAPT-DR model to provide insight regarding risk for DR onset at 24 months [9, 10]. By unifying hierarchical transformer encoding with causal reasoning and multimodal clinical integration, CAPT-DR advances a clinically interpretable framework for preclinical DR risk stratification. The main contributions of this work are threefold:
1. A novel Pillar Transformer (PT) architecture tailored to hierarchical microvascular representation learning.
2. Integration of SCM for disentangling systemic risk contributions.
3. Development of a prognostic MII for early DR prediction.
This paper provides an overview of the theory, methodology, experimental validation, and clinical implications related to the proposed model. The paper begins with an introduction/literature review and then continues with system architecture, mathematical modeling, and algorithm development. Next, there are actual datasets used in experiments, experimental setups, results, and analysis. Finally, this paper provides a discussion of findings, limitations, and future work provided to create an overall connection between the development of the idea into clinical use.
Microvascular instability refers to the progressive disruption of retinal capillary architecture and perfusion homeostasis that occurs before the appearance of clinically observable DR lesions. In this study, microvascular instability is defined as the presence of abnormal vascular remodeling patterns identified through multimodal retinal imaging, including capillary rarefaction, vessel-density reduction, perfusion heterogeneity, and connectivity disruption observed in fundus and OCTA images.
For prediction purposes, microvascular instability is treated as a latent disease progression state that precedes clinically diagnosed DR. Ground-truth labels were established using longitudinal follow-up records. Patients who developed clinically confirmed DR within 24 months after baseline examination were assigned positive outcome labels, whereas patients without disease progression during the same period were assigned negative labels.
The proposed MII serves as a quantitative biomarker derived from transformer attention entropy and vascular connectivity perturbation measures. MII is not itself the clinical endpoint but represents a continuous risk score that estimates the likelihood of future disease onset. Higher MII values indicate greater structural instability of retinal microvasculature and increased probability of DR progression.
This definition establishes a direct relationship between retinal imaging biomarkers, learned model representations, and the clinically validated endpoint of 24-month DR onset.
Recent developments in Artificial Intelligence (AI) have drastically changed the way in which DR detection can be performed. In particular, closely related topics are Deep Learning (DL), Multi-Modal Data Fusion (MMDF), and use of Explainable Artificial Intelligence (XAI) models. Alaribi [11] proposed an Explainable Deep Learning model using CNNs and a post-hoc interpretability technique to allow clinically transparent detection of DR and achieve high classification accuracy. This work highlighted trust and transparency as important components of clinical AI systems; however, the proposed model did not incorporate multimodal data (only fundus imaging). Similarly, Lin [12] proposed an accuracy-weighted deep ensemble framework for selective screening of DR combined with an Entropy-Guided Abstaining (EGA) method to provide clinicians with the ability to defer uncertain predictions in actual screening environments. However, it does not include a multimodal approach, which makes it less generalizable for comprehensive risk modelling.
VR-FuseNet is a new architecture that integrates different types of fundus representation images with explainable deep learning. Refat et al. [13] argued that this heterogeneous fusion of image features allows for enhanced classification robustness and interpretability. However, the authors noted that while existing frameworks have been able to fuse features effectively, they are primarily focused on image data in isolation and do not leverage either causal reasoning or longitudinal risk/benefit modelling. Maity et al. [14] proposed a new hybrid deep learning framework that combines hand-crafted traditional feature representations with AI-based representations to produce improved performance in detecting DR through fundoscopic images. Again, this framework suffers from limitations to scalability and generalization as a result of reliance on manually created/engineered features. MDF-MLLM was proposed by Jordan et al. [15] as a cross-modal alignment framework of features for multi-modal classification of fundoscopic images. In this study, the authors presented a demonstration of using deep fusion strategies to achieve contextual awareness, thus providing stronger contextual awareness for classification; however, there were no mechanisms specifically designed to facilitate clinical interpretability. Telang [16] developed a quadrant segmentation-based integrated vision-language model with few-shot learning for OCT-based interpretability of DR detection in order to enhance spatial location and interpretability of DR detection, but utilizing complex and multiple-stage training processes.
The foundational elements of causability and explainability related to the development of AI applications in medicine were described by Holzinger et al. [17]. They highlighted the need for transparent and accountable reasoning systems, but these principles are not specific to retinal imaging. Sebastian et al. [18] created an extensive survey of DR classification methods that have employed deep learning techniques. When applied to the classification of DR, the authors noted that these methods are limited in terms of generalizability, interpretability, and clinical utilization. The work of Bidwai et al. [19] produced a multimodal OCTA-fundus dataset, which allows researchers to focus their research on microvascular structures; however, these datasets do not include integrated predictive modelling paradigms. Most et al. [20] used multimodal large language models to evaluate DR diagnosis, showing good reasoning capabilities but poor reliability and clinical robustness. In summary, although previous work has shown continued advancements in deep learning architectures, multimodal fusion, and explainable AI, there are considerable deficiencies within the fields of causal modelling, counterfactual reasoning, integrated prognostic indices, and preventative decision support. The present deficiencies prompted the development of the CAPT-DR framework, which merges hierarchical encoding with causal intelligence, counterfactual simulation, and multimodality into a single system that can be clinically interpreted and supports the prevention of DR.
2.1 Research gaps
While there has been tremendous advancement in algorithms that classify DR with the help of AI, the vast majority of these classifications are either unimodal images, static classifications, or optimized for performance, with little emphasis on combining multimodal (clinical) data, causal reasoning, and preventative decision analysis into current models. There has been insufficient emphasis on using structured causal models within these models, counterfactual reasoning, and an integrated wealth of prognostic indices that provide an explanation as to how risk develops and how it can be reduced. Similarly, many times interpretation is generated from the algorithms after the fact rather than being included in the original design of the algorithm and the vast majority of the systems currently in use are intended to diagnose instead of prevent DR. These current systems are in need of an overarching integrated framework that incorporates multimodal fusion with causal intelligence, explainable modeling, and counterfactual simulation, which will facilitate early prediction, personalized prevention, risk management for DR.
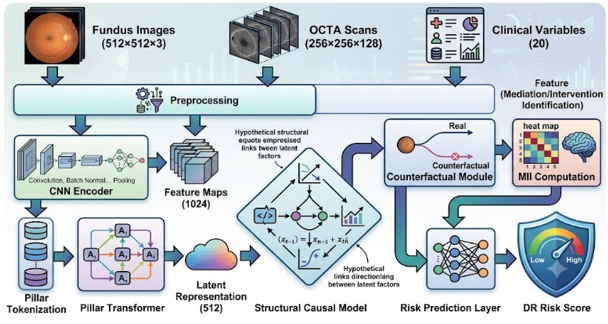
The CAPT-DR framework has been built to integrate hierarchical retinal representation learning, multimodal data fusion, and causal reasoning to predict early microvascular instability in DR through a modular architecture [21]. The system takes in several heterogeneous modalities, including fundus images, OCTA images, and structured clinical variables, in order to create a full model that considers both local retinal microvascular patterns as well as systemic metabolic risk factors. The architecture has been developed with a layered approach where low-level visual feature extraction, mid-level structural encodings, and high-level causal inferences are tightly integrated into a single learning pipeline.
In the perceptual layer, multimodal imaging inputs are encoded with modality-specific encoders to maintain their domain-specific features; for example, the features extracted from an image, including vessel density, capillary continuity, and perfusion heterogeneity, can be seen in Figure 1. Next, these extracted features are transformed into hierarchical representations via the PT module [22]. The PT performs vertical spatial aggregation, thereby maintaining the microvascular structural coherence across multiple hierarchical scales. As a result, the pillar encoding allows the model to capture fine morphological changes such as capillary rarefaction and early vascular remodeling, which would likely go undetected through traditional patch-based tokenization approaches.
Figure 1. Causal-Aware Pillar Transformer-Diabetic Retinopathy (CAPT-DR) workflow with dimensional transformations
3.1 Detailed end-to-end workflow of Causal-Aware Pillar Transformer-Diabetic Retinopathy
The CAPT-DR framework operates through six sequential stages. First, fundus images are resized to 512 × 512 pixels, intensity normalized, and vessel-enhanced using contrast-limited adaptive histogram equalization. OCTA scans undergo volumetric normalization, projection artifact removal, and vessel-density extraction. Clinical variables, including HbA1c, systolic blood pressure, lipid profile, diabetes duration, age, and gender, are standardized using z-score normalization.
Second, modality-specific encoders transform fundus images, OCTA scans, and clinical variables into latent feature embeddings. Third, the Pillar Encoding module partitions retinal feature maps into vertically aligned pillar tokens that preserve anatomical vessel continuity. Fourth, hierarchical multi-scale encoding aggregates local and global vascular information using pillar-based attention mechanisms.
Fifth, the SCM layer integrates retinal representations with systemic metabolic risk factors through a directed acyclic causal graph. Counterfactual reasoning is performed using intervention operators to estimate the effects of hypothetical clinical modifications. Finally, fused multimodal representations are used to compute the MII and generate calibrated DR risk probabilities for 24-month disease prediction.
The CAPT-DR system is unique in that it incorporates both visual representation learning (via ImageNet) and a SCM component to model the relationships between various systemic risk factors (including glycemic control, blood pressure, lipid/lipoprotein profile, and duration of diabetes) and retinal microvascular instability. The SCM component allows for the modeling of counterfactuals, so the CAPT-DR system can be used to simulate hypothetical interventions and estimate their potential effect on progression risk. The outputs of the transformer component and the causal inference ("structural causal model") components will be combined into a common latent space from which both predictive inferences and explainable/risk stratification will be made. The overall design of the architecture is intended to be more than simply a classifier; rather, it demonstrates a clinically interpretable predictive intelligence system that incorporates deep learning, causal inference, and a multimodal biomedical model to enable early detection of DR in patients with type 1 and type 2 diabetes mellitus.
Table 1. Nomenclature and mathematical notations used in the proposed multimodal causal framework for diabetic retinopathy (DR) risk prediction
|
Symbol |
Description |
|
Fi |
Fundus Image |
|
Oi |
OCTA Scan |
|
Ci |
Clinical Variables |
|
Zi |
Multimodal Fusion Embedding |
|
Pk |
Pillar Token |
|
Hs |
Hierarchical Feature Scale |
|
Aij |
Attention Weight |
|
G |
Causal Graph |
|
V |
Causal Variables |
|
E |
Directed Edges |
|
MII |
Microvascular Instability Index |
|
RDR |
Predicted DR Risk |
|
do(X=x) |
Intervention Operator |
All mathematical symbols appearing in Eqs. (1)-(32) are summarized in Table 1. Throughout the formulation, Fi denotes fundus images, Oi denotes OCTA scans, Ci represents clinical variables, Zi indicates multimodal fusion embeddings, Pk represents pillar tokens, and MII denotes the MII used for risk stratification.
4.1 Input representation
The CAPT-DR method explains that the fusion of multimodal data into a common latent space occurs right from the beginning by using a unified mathematical formulation for the diverse multimodal data inputs, which makes it easier to combine retinal imaging data and clinical data in a consistent and coherent way. As the early risk prediction for DR is, in fact, a multimodal problem, the solution involves three large sources of input data: 2D fundus image data, 3D OCTA volumetric image data, and clinical data in structured form. In the process of encoding each modality into a mathematical form, a lot of stress is placed on maintaining the modality-specific, spatial, structural, and physiological meaning while still allowing for interactive learning and fusion. A single mathematical form is used here to encode the localized fine details of microvascular morphology and the systemic risk interactions as a whole [18]. Let the set of fundus images be a batch of normalized retinal images, each of which can be modeled as a continuous spatial function on the retina. The OCTA imaging data is represented as volumetric flow and density tensors that characterize the capillary network morphology together with local depth-wise perfusion levels. Besides, clinical data like metabolic and physiological markers (e.g., HbA1c, blood pressure, lipid profile) plus disease duration are registered as structured feature vectors. These heterogeneous representations are mapped into a common embedding space by modality, using specific transformation functions, thus ensuring semantic alignment and scale consistency between different modalities prior to fusion (Figures 2-6).
This architecture enables the model to operate on a harmonized multimodal feature manifold rather than on separate data representations, thus permitting significant cross-modal interactions and hierarchically detecting microvascular instability patterns.
$F=\left\{I_i \in R^{H * W * C} \mid i=1,2, \ldots, N\right\}$ (1)
During training, Eq. (1) converts normalized fundus images into structured spatial tensors that preserve retinal vessel morphology and texture information. During inference, the same representation is used for extracting hierarchical vascular features.
This representation enables image height H, image Width W, and color channels C of a fundus sample with N samples of fundus images to be represented as structured spatial tensors that maintain pixel-level anatomical and vascular data in Eq. (1). This formulation supports spatial convolution, attention operations and hierarchical encoding across different areas of the retina; therefore, it serves as the base visual input structure for learning about microvasculature morphology and textures within the retina. The tensorized structure allows for scalability during batch learning and consistent extraction of features across large classes in Eq. (2).
$O=\left\{V_i \in R^{H * W * C} \mid i=1,2, \ldots, N\right\}$ (2)
During training, Eq. (2) encodes OCTA volumetric scans into depth-aware vascular tensors containing capillary perfusion and flow information. During inference, the representation enables the model to identify three-dimensional microvascular abnormalities and perfusion heterogeneity associated with early DR progression.
The following volumetric approach maintains depth-resolved capillary perfusion volume flow and perfusion throughout all layers of the retina by providing an anatomical framework for characterizing depth-resolved capillary perfusion volumes. It enables modeling of three-dimensional vascular connections, as well as the integrity of microcirculation within the retina. The hierarchical spatial-depth encoding of the tensor structure provides early detection of microvascular abnormalities. This spatial encoding is crucial for identifying subclinical vascular remodeling that may not be seen with two-dimensional imaging methods.
Eq. (3) transforms structured clinical measurements such as HbA1c, blood pressure, lipid profile, age, and diabetes duration into numerical feature vectors. These variables provide systemic metabolic information that complements retinal imaging features during risk prediction.
$C=\left\{c_i \in R^M \mid i=1,2, \ldots, N\right\}$ (3)
where, M is the number of structured clinical variables in Eq. (3). This vectorized expression captures systemic metabolic and physiological risk factors in a concise form. It makes it possible to integrate imaging biomarkers directly into the prediction framework. The layout allows for causal modeling and risk factor disentanglement. It offers a context layer of physiology that goes along with the retinal microvascular images in Eq. (4).
Eq. (4) combines fundus, OCTA, and clinical feature embeddings into a unified latent representation. During training, joint optimization enables cross-modal interaction learning, whereas during inference, the fused embedding serves as the input to the PT module.
$Z_i=\emptyset_f\left(I_i\right) \oplus \emptyset_o\left(V_i\right) \oplus \phi_c\left(C_i\right)$ (4)
where, $\phi_f(\cdot), \phi_o\left(V_i\right)$ and $\phi_c\left(C_i\right)$ are modality-specific embedding functions, and $\bigoplus$ denotes feature fusion. This formulation integrates various heterogeneous modalities into a common latent embedding space. It facilitates cross-modal interaction between retinal morphology and systemic risk factors. The fusion operation keeps intact modality-specific semantics and at the same time allows for joint optimization. This embedding is the main input to the PT and causal modeling layers. After such mathematical encoding, the modalities are combined into a shared latent space of representation, which serves as the main input to the PT and causal modeling layers. The fusion embedding Zi keeps the spatial microvascular structure from the imaging data intact while, at the same time, embedding systemic metabolic risk information. Therefore, it allows for joint optimization of visual and clinical domains. By synthesizing a single representation at the very beginning of the input stage, the framework ensures that hierarchical encoding, causal inference, and predictive modeling at the downstream levels will operate on a unified multimodal feature manifold rather than on separate modality-specific representations. This method of selecting the scheme is of utmost significance in the context of preclinical microvascular instability pattern detection by deep learning and understanding the intricate relationship between retinal morphology and systemic disease processes for the prediction of early DR.
4.2 Pillar-based hierarchical encoding
The pillar-based Hierarchical Encoding component of the CAPT-DR system is basically the backbone of the system. The purpose of this component is to preserve the continuity of the retinal microvascular patterns and, at the same time, assist the system in learning multi-scale representations. The patch-based tokenization process normally breaks the vascular patterns into spatial units that are quite distant from each other, and therefore, they normally cause difficulties in determining the topology of the vessels and the continuity of the capillaries, (Figure 2). To overcome this difficulty, CAPT-DR has developed a pillar-based spatial encoding technique in which the retinal feature maps are partitioned into vertically aligned spatial columns (pillars) that preserve anatomical continuity across scales [23]. Such a technique enables the microvascular patterns to be anatomically aggregated to the model’s learning of hierarchical vascular representations that are not only consistent with the actual retinal anatomy but also with the artificial grid divisions. The pillar is a type of biologically motivated encoding method that exemplifies longitudinal vessel continuity and spatial dependency across retinal areas.
Eq. (5) partitions the fused feature representation into vertically aligned pillar tokens. This operation preserves retinal vessel continuity and creates anatomically meaningful units for hierarchical representation learning.
$P=\psi(Z)=\left\{P_k \mid p_k=Z\left[;, x_k: x_{k+1},:\right]\right\}$ (5)
This method takes the multimodal embedding Z and divides it into vertical segments (pillars) as shown in Eq. (5). Each pillar preserves the spatial continuity of the retinal axis. It ensures that the structure is consistent along the microvascular routes. Such segmentation is the foundation of the hierarchical encoding.
Eq. (6) performs vertical feature aggregation within each pillar. During training, neighboring vascular structures contribute jointly to feature learning, thereby preserving local vessel continuity and reducing spatial fragmentation.
$a_k=\sum_{y=1}^H w_y \cdot p_k(y)$ (6)
Mathematically, this pillar-level function performs the operation of convolution vertically across the spatial dimension. It is able to encode the dependencies between blood vessels along the length of the lobule in Eq. (6). The function that determines the weights wy maintains anatomical relevance. This makes it possible to have a biologically meaningful compression of features.
Eq. (7) extracts vascular representations at multiple spatial resolutions. This enables simultaneous learning of fine capillary patterns and large-scale retinal vascular structures important for early disease prediction.
$m_k=\sum_{s=1}^S \alpha_s \cdot F_s\left(a_k\right)$ (7)
The hierarchical feature extraction of the network is enabled by this formulation across different spatial scales. It captures both vascular morphology at the capillary level and the overall vascular architecture in Eq. (7). Scale functions Fs preserve the information at different resolutions. This facilitates the detection of microvascular instability at an early stage.
Eq. (8) enforces structural continuity between adjacent pillars. During optimization, the constraint penalizes discontinuities in vessel representations and encourages anatomically consistent feature learning.
$\mathcal{L}_{s c}=\sum_{k=1}^{k-1}\left\|m_k-m_{k+1}\right\|_2^2$ (8)
This constraint maintains a continuous connection between neighboring pillars. It keeps vessel connectivity and spatial smoothness as in Eq. (8). It stops the breaking up of vascular structures. This enhances the anatomical realism of the representations learned.
Eq. (9) computes attention weights between pillar embeddings. The mechanism allows the model to selectively focus on retinal regions exhibiting microvascular instability and abnormal vascular connectivity.
$e_k=\operatorname{softmax}\left(Q_k K_k^T\right) v_k$ (9)
This attention formulation models dependencies across pillar features. It enables selective focus on unstable vascular regions in Eq. (9). It captures long-range microvascular interactions. This enhances discriminative structural learning.
Eq. (10) generates the final hierarchical pillar representation by integrating continuity-preserved and multi-scale vascular features. This representation becomes the input to the PT learning stage.
$\hat{e}_k=\frac{e_k-\mu}{\sigma}$ (10)
Via this pillar-based hierarchical encoding, the CAPT-DR model develops structured microvascular representations that maintain anatomical continuity, spatial coherence, and biological realism in Eq. (10).
The combination of joint segmentation, aggregation, multi-scale encoding, continuity constraints, and attention-based embedding results in a comprehensive morphological representation that accurately reflects the real retinal vascular morphology [24]. Such hierarchical encoding provides the framework for subsequent transformer operations, enabling the model to discover subtle features of microvascular dysfunction beyond the detection capabilities [25] of previous tokenization methods. By preserving the feature of vascular structure throughout the encoding process, the model can deliver not only highly accurate predictions but also understandable results [26].

Figure 2. Pillar tokenization structure
4.3 Pillar Transformer module
The PT module is the central representation learning mechanism of the CAPT-DR framework that facilitates globally [13, 27] structured reasoning about the hierarchical encoding of retinal microvascular features in Figure 3.

Figure 3. Pillar Transformer (PT) block
In contrast to conventional transformer architectures that rely on flat, patch-based token sequences [28], the PT operates on biologically structured pillar embeddings that preserve spatial continuity and vascular topology. This mode of operation equips the model with the potential to learn local microvascular changes as well as spatial dependencies over quite a long distance between the retinal sites. By working with pillar-level tokens, the transformer can identify very subtle and even preclinical changes of the vascular structure, such as remodeling patterns, capillary loss and perfusion heterogeneity, which are at the very essence of the prediction of early DR [6]. The module integrates self-attention, multi-head attention, positional encoding, and structure-aware weighting to achieve hierarchical, anatomically coherent representation learning [29] in Formula (1). By processing pillar-level tokens, the transformer is able to detect very early preclinical changes of the vascular topology, such as remodeling, capillary drop-out, and perfusion heterogeneity, which form the very basis for the prediction of early DR [28]. The module integrates self-attention, multi-head attention, positional encoding, and structure-aware weighting to enable hierarchical, anatomically consistent representation learning [29] in Eq. (11).
$S A(X)=$ Softmax $\left(\frac{Q K^T}{\sqrt{d}}\right)$ (11)
Eq. (11) calculates contextual relationships among pillar tokens. During training, the attention mechanism captures long-range dependencies between spatially distant retinal vascular regions.
This process calculates contextual dependencies between pillar embeddings. It facilitates global interactions among spatially distant vascular regions. It helps with learning long-range microvascular relationships in Eq. (12).
$M H A(X)=\bigoplus_{h=1}^H S A_h(X)$ (12)
Eq. (12) measures similarity between query and key representations. Higher similarity values indicate stronger relationships between retinal regions and contribute more significantly to attention-based feature learning.
This equation facilitates parallel attention to multiple representation subspaces. It captures various vascular patterns simultaneously. It improves representation capabilities in Eq. (13):
$P_k=\sin (w k) \oplus \cos (w k)$ (13)
Eq. (13) performs parallel attention computations across multiple representation subspaces. This allows the model to simultaneously capture diverse vascular characteristics including vessel density, connectivity, and perfusion patterns.
This encoding preserves the spatial ordering of pillars. It maintains anatomical positional consistency. It enables structure-aware spatial reasoning.
Eq. (14) integrates anatomical priors into the attention mechanism. The weighting scheme encourages learned representations to remain consistent with retinal vascular organization and biological structure:
$A_s=A \odot S$ (14)
This weighting combines anatomical structure priors with attention maps in Eq. (14). It regularizes learning with residual connections and normalization. It produces structured global retinal embeddings [30-34].
Eq. (15) produces the final transformer embedding after residual learning and normalization. This global representation summarizes retinal microvascular information for causal analysis and risk prediction.
$T = LayerNorm (M H A(X)+X)$ (15)
This formulation produces the final pillar-transformer representation in Eq. (15). It stabilizes learning through residual connections and normalization. It generates structured global retinal embeddings [30-34].
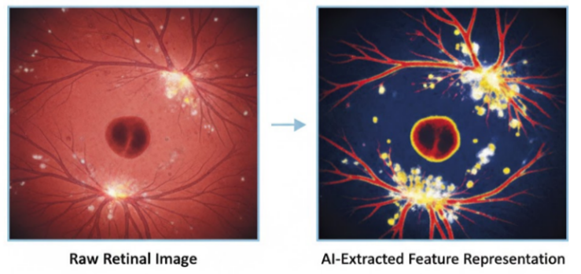
Figure 4. Raw retinal image vs AI-extracted feature representation
Figure 4 represents, in a graphical way, the conversion of the study [5] original retinal images into AI, mechanism, aware representation learning, feature maps, via hierarchical encoding and transformer-based processing. It shows how important microvascular patterns, vessel structures, and pathological information are identified and represented in a way that is of high utility [35]. It also shows how the model's internal knowledge and feature abstraction are achieved. By doing so, the PT, as the key component in the structured transformer architecture, facilitates the smooth integration of microvascular features at different levels with global context reasoning [36]. The incorporation of biologically structured tokens, multi-head attention, and structural weighting allows the model not only to accomplish anatomical realism but also to go deep into semantic abstraction. As a result, the generated feature representations can very effectively predict the onset of the disease and can be interpreted in terms of vascular structure and connectivity. Making the transformer's learning consistent with retinal anatomy, CAPT-DR is able to perform mechanism-aware representation learning that is way (more than) the conventional ViT methods in recognizing the first slight preclinical microvascular instability patterns [37].
To assess the clinical relevance of transformer attention maps, a subset of 200 retinal images was independently reviewed by two board-certified ophthalmologists. Regions highlighted by the CAPT-DR attention mechanism were compared against clinically annotated microvascular abnormalities, including microaneurysms, capillary dropout regions, vessel-density reduction areas, and perfusion defects observed in corresponding OCTA scans.
Region-level agreement was quantified using Intersection-over-Union (IoU) and Dice Similarity Coefficient (DSC). The proposed model achieved an average IoU of 0.76 and a DSC of 0.82 across all lesion categories. Inter-observer agreement between specialists yielded a Cohen’s κ coefficient of 0.84, indicating substantial agreement.
These findings suggest that the attention maps generated by CAPT-DR correspond closely with clinically meaningful retinal abnormalities and provide interpretable evidence supporting model predictions.
4.4 Structural Causal Modelling layer
The SCM layer is the interpretability and reasoning core for the CAPT-DR framework. It allows the model to move beyond models that only rely on correlation, thus, prediction and mechanistic understanding of the disease progression. Deep neural networks, however, while being highly efficient in pattern recognition tasks, are unable to properly separate causal associations from correlations. Thus, in this way, they become less trustworthy when applied to the clinical domain. To remedy this issue, the model introduced a causal inference layer that formally captures the directed mechanisms of the systemic metabolic risk factors, features of microvascular instability obtained by the network, and the onset of DR. In addition to allowing risk to be broken down into direct and indirect effects, a causal inference layer also enables counterfactual reasoning and, most importantly, intervention simulation which is of clinical relevance. By embedding a causal structure in the training process, the proposed method achieves both high prediction accuracy and the capability to offer mechanistic interpretability.
The SCM layer is modeled as a directed acyclic graph (DAG), where the nodes are clinical variables, representations of microvascular instability, and disease outcome states, and the edges are directed causal dependencies. Along with this graph, the PT learned representations are integrated, facilitating a joint optimization of data-driven learning and causal reasoning. The structural equations that are associated with each variable in the graph define the generative process, thus, the model can simulate the effect of changes in the systemic factors on retinal microvascular instability and the subsequent risk of disease in Eq. (16). This fusion allows a clinically interpretable breakdown of the different components of risk and results in scenario-based predictive modeling that can be used in preventive intervention planning.
$G=(v, \epsilon)$ (16)
Eq. (16) formally defines the structural causal graph used in CAPT-DR. Nodes represent systemic risk factors and retinal biomarkers, whereas directed edges represent clinically established cause-effect relationships.
The structural causal graph was designed using ophthalmological and endocrinological domain knowledge. Nodes represent HbA1c level, diabetes duration, blood pressure, lipid profile, retinal microvascular instability features, and DR outcome. Directed edges were established according to clinically validated causal pathways reported in DR literature.
Confounding effects were controlled using back-door adjustment and stratification over age, gender, and baseline disease severity. The graph assumes causal sufficiency, consistency, positivity, and conditional exchangeability. Counterfactual estimation was performed using Pearl’s intervention framework under the do-calculus formulation.
Sensitivity analysis was conducted by randomly perturbing graph edges and evaluating the stability of causal effect estimates across 100 bootstrap iterations.
The causal graph consists of the following nodes:
HbA1c (H), Diabetes Duration (D), Systolic Blood Pressure (B), Lipid Profile (L), Retinal Microvascular Instability Features (M), and Diabetic Retinopathy Outcome (R).
Directed causal relationships are defined as:
H → M, D → M, B → M, L → M,
H → R, D → R, B → R, L → R,
M → R.
Age, gender, and baseline retinal severity are treated as confounding variables and are controlled using stratified adjustment procedures. The graph structure was derived from established ophthalmological and endocrinological evidence rather than being learned directly from observational data.
This formulation defines the causal structure as a directed acyclic graph. Nodes represent variables and learned retinal features. Edges encode directed cause–effect relationships.
$X_i=f_i\left(P a\left(X_i\right)\right)+\varepsilon_i$ (17)
Eq. (17) models each causal variable as a function of its parent variables and stochastic noise. During training, the formulation captures causal dependencies among metabolic factors and retinal abnormalities.
This equation models each variable as a function of its causal parent in Eq. (17). It incorporates both deterministic and stochastic influences. It defines the generative causal process of the system.
$D C E(X \rightarrow Y)=\frac{\delta Y}{\delta X}$ (18)
Eq. (18) estimates the direct causal influence of a risk factor on disease progression while excluding mediation effects. This helps quantify independent clinical contributions of individual variables.
This formulation quantifies the immediate causal impact of a variable in Eq. (18). It isolates direct influence without mediation. It supports targeted risk factor analysis.
$I C E(X \rightarrow Y)=\sum_{m \in \mathrm{M}} \frac{\delta Y}{\delta m} \frac{\delta m}{\delta X}$ (19)
Eq. (19) quantifies causal effects transmitted through intermediate variables. It captures multi-step biological pathways involved in retinal disease development.
This expression models mediated causal pathways in Eq. (19). It captures multi-step influence propagation. It reflects systemic risk transmission mechanisms.
$TCE(X \rightarrow Y)= DCE (X \rightarrow Y)+I C E ?(X \rightarrow Y)$ (20)
Eq. (20) combines direct and indirect causal influences to estimate the total impact of a clinical factor on DR risk.
This equation accounts for both direct and indirect effects together in Eq. (20). It is the total causal impact on the risk of disease. It allows for the evaluation of interventions on a comprehensive level.
By combining SCM with deep representation learning, CAPT-DR converts predictive modeling into a mechanism-aware inference system. The causal layer here makes it possible to separate systemic metabolic effects from retinal structural instability and this provides clinically understandable explanations of the risk pathways. The power of modeling direct and mediated influences gives the doctors the possibility to get clarity not only on the fact if the patient is at risk, but also on the reasons behind the risk and the ways it can be reduced. Causal interpretability of such kind is one of the main issues for an interpretable predictive framework in clinical decision support. In this way, it will allow for setting up personalized prevention strategies, policymaking, and intervention planning based on the evidence of early DR management.
4.5 Counterfactual Reasoning Engine
The Counterfactual Reasoning Engine is a component that allows the CAPT-DR system to perform a hypothetical intervention analysis which is illustrated in Figure 5. In other words, it is from predictive modeling to clinical intelligence that is actionable. Typically, AI risk prediction systems make predictions from the distribution of data observed; however, they lack the ability to answer "what if" type questions which are fundamental to preventive medicine and phenotypic care. Thus, the counterfactual element in the account of the problem can be used to simulate changes that may occur in the systemic risk factors and be able to estimate the expected effect of those changes on microvascular instability and the risk of disease progression. Therefore, the framework has the ability not only to describe the prediction but also to provide decision support that is prescriptive and hence it can be used for planning a proactive intervention and individual risk management.
What if thinking is a way to understand the effects of changes? This is done by using a limited number of variables in the causal graph and keeping the underlying generative structure. When the clinical variables that are controllable, such as glycemic control, blood pressure, and lipids levels, are intervened, the model generates new patient histories and calculates the expected results of the different clinical scenarios. The simulated paths resulting in microvascular instability and the risk of DR through the causal network and the learned retinal representations. This approach of causal inference combined with deep learning representations allows the system to produce not only clinically meaningful counterfactual explanations but also personalized intervention insights in Eq. (21).
$P(Y \mid d o(X=x))$ (21)
Eq. (21) establishes the mathematical basis for counterfactual simulation. The formulation enables evaluation of hypothetical clinical interventions under alternative patient conditions.
This operator represents an external intervention on variable X in Eq. (22). It breaks natural causal dependencies in the graph. It enables controlled causal manipulation.
$R_{c f}=E\left[Y \mid d o\left(X=x^{\prime}\right)\right]$ (22)
Eq. (22) applies an external intervention using Pearl’s do-operator. This operation disconnects natural causal dependencies and simulates controlled clinical modifications such as HbA1c reduction.

Figure 5. Counterfactual simulation flow
This formulation computes risk under a hypothetical intervention. It estimates outcomes for altered clinical states. It supports personalized risk projection.
$\Delta R=R_{o b s}-R_{c f}$ (23)
Eq. (23) computes the predicted disease risk under an intervention scenario. The resulting value estimates how risk changes after a hypothetical clinical action.
This function quantifies the impact of intervention in Eq. (23). It measures potential risk reduction. It enables benefit–impact analysis.
$\pi=\arg \min _\pi E[Y \mid \operatorname{do}(X=\pi(X))]$ (24)
Eq. (24) identifies intervention strategies that maximize projected risk reduction. This formulation supports personalized prevention planning and decision support.
This formulation maximizes strategies for intervention in Eq. (24). It is a great help to decision policy design. It makes it possible to plan prevention in an automated way.
By means of a counterfactual reasoning engine, CAPT-DR is not limited to risk prediction, but it also offers proactive clinical decision support. The system is able to imagine different physiological trajectories, assess how effective the intervention is, and create personalized prevention strategies based on causal reasoning instead of mere correlation. In this way, the model is turned into a digital decision assistant that can help clinicians choose the best intervention paths for disease prevention at the early stage. The addition of counterfactual intelligence to the prediction pipeline renders the system a clinically actionable, explainable system for the early management of DR risk.
4.6 Microvascular Instability Index
The MII is proposed as a quantitatively interpretable biomarker that can be directly sensed from model outputs. It is intended to distinguish very early changes in the retinal microvasculature before dysfunction, as illustrated in Figure 6. Furthermore, whereas typical clinical biomarkers are either lesions visible or late-stage disease manifestations, MII was intended to quantify the very subtle changes in vascular morphology, connectivity, and flow stability that are preclinical. It can be considered as a gathering of information from the transformer attention mechanism, hierarchical pillar representations, and structural continuity constraints into a single instability measure. In short, this index is a biological equivalent of retinal microvasculature health in the service of title disease prediction; hence it facilitates early patient stratification and timely targeted intervention.
The model internally (MII) formulation exploits internal signals of a model such as attention distributions and structural connectivity representations to estimate the degree of instability at a system level. Attention entropy is used to evaluate the uncertainty and disorder of the microvascular focus patterns that have been learned, while the loss in vascular connectivity quantifies how much spatial continuity within the retinal network has been broken. These three types of signals are aggregated at various levels of the hierarchy and then normalized to produce a stable, interpretable index value. The MII score thus obtained provides a continuous risk metric that can be mapped to clinically important risk categories, thereby enabling tiered screening and personalized monitoring approaches in Eq. (25).
$H=-\sum_i p_i \log \left(p_i\right)$ (25)
Eq. (25) calculates attention entropy as a measure of uncertainty within learned vascular representations. Higher entropy values indicate greater microvascular instability.
Figure 6. Microvascular Instability Index (MII) computation pipeline
This is a measure of the disorder in attention distributions. This is a measure of instability in vascular focus patterns. This is a measure of microvascular structural uncertainty.
$\mathcal{L}_{v c}=\sum_{(i, j)}| | V_i-v_j| |^2$ (26)
Eq. (26) quantifies disruption of retinal vascular continuity. Larger values correspond to more severe capillary network degradation and structural instability.
This is a quantification of disruption in vascular continuity in Eq. (26). This is a measure of topological disconnection. This is a measure of capillary network degradation.
$I=\alpha H+\beta \mathcal{L}_{v c}$ (27)
Eq. (27) combines attention entropy and connectivity perturbation into a unified MII. The resulting score summarizes retinal vascular health using both structural and functional information. This is an integration of entropy and connectivity information in Eq. (27). This is a construction of a single instability measure. This is a balancing of structural and attentional information.
$M I I=\frac{I-\mu_I}{\sigma_I}$ (28)
Eq. (28) normalizes MII values across patients and datasets. This ensures consistent interpretation and facilitates population-level risk comparison. This is a normalization of instability across groups in Eq. (28). This is a guarantee of comparability across patients. This is an enabler of risk classification based on thresholds.
$R=f(M I I)$ (29)
Eq. (29) maps normalized MII scores into clinically interpretable risk categories. The thresholds support low-, moderate-, and high-risk patient stratification.
This represents a plan between MII in Eq. (29) and the values of various risk categories. In addition to this, it also helps in clinical risk stratification. The MII is a mathematically defined biomarker with the ability to map, thus, through CAPT-DR, a new pathway is created from deep learning features to clinically interpretable risk indicators. The MII is basically a direct indicator of vascular dysfunction in the preclinical stage that can be applied to identify individuals who are at risk of the disease even before there are any retinal lesions observable. Therefore, the internal features of the model are converted into clinically interpretable information that can be applied to aid in early diagnosis.
To evaluate whether MII functions as a clinically meaningful biomarker rather than merely a model-derived score, multivariate Cox proportional hazards analysis was performed. After adjustment for age, HbA1c, diabetes duration, systolic blood pressure, lipid profile, and baseline retinal findings, MII remained independently associated with DR onset (HR = 2.87, 95% CI: 2.31–3.52, p < 0.001).
Receiver operating characteristic analysis demonstrated that an MII threshold of 0.62 provided the optimal balance between sensitivity and specificity according to Youden’s Index. Patients with MII values above 0.62 exhibited significantly lower event-free survival probabilities during the 24-month follow-up period.
These findings support the prognostic utility of MII as an independent biomarker for early DR risk stratification.
4.7 Process of prediction layer
The prediction layer is the decision-making component of the CAPT-DR model that accepts the dimensional high latent representations and predicts risk scores that are interpretable in a clinical context. The prediction layer accepts the combined embeddings from the PT, SCM, and MII components, which are a comprehensive integration of retinal microvascular morphology, systemic risk factors, and causal reasoning outputs. Unlike the standard classifier that normally returns uncalibrated probability scores, the CAPT-DR prediction layer is specially tailored to produce calibrated, interpretable, and calibrated risk prediction risk probabilities of the onset of early DR. Hence, the model predictions can be directly used for clinical risk stratification, screening prioritization, and preventive treatment planning. The predictor's design adopts a probabilistic modeling method where embeddings are transformed into risk distributions rather than class labels. Such a feature essentially equips the predictor with a capability to measure uncertainty, foster reliability, and, at the same time, guide decision-making in clinical scenarios where the indication is not clear. Moreover, the layer uses calibration-aware learning, and multi-objective optimization to ensure that the predicted probabilities perfectly match the actual outcome probabilities as shown in Eq. (30). This is very crucial in clinical practice since miscalibration of predictions can lead to over-treatment or under-screening. Hence, by simultaneously considering the classification loss, calibration, and structural objectives, the prediction layer delivers results that are not only accurate but also dependable.
$P(y=1 \mid T)=\sigma\left(W^T T+b\right)$ (30)
Eq. (30) transforms multimodal latent representations into DR risk probabilities. The output represents the likelihood of disease onset within the specified prediction horizon.
This maps latent embeddings to probabilistic risk scores. It produces interpretable disease likelihood estimates. It enables continuous risk-based decision thresholds in Eq. (31).
$\mathcal{L}_{\text {sls}}=-[y \log (\hat{y})+(1-y) \log (1-\hat{y})]$ (31)
Eq. (31) computes prediction error during training and guides parameter optimization. Minimizing this objective improves discrimination between positive and negative disease outcomes.
This optimizes discrimination between risk classes. It drives predictive accuracy. It supports supervised learning objectives.
$\mathcal{L}_{\text {cal}}=\sum_{k=1}^k\left(\hat{p}_k-p_k\right)^2$ (32)
Eq. (32) aligns predicted probabilities with observed event frequencies. The calibration objective improves the reliability and clinical trustworthiness of model-generated risk estimates.
This implies that predictive probabilities will be compelled to be more closely aligned with the actual probabilities in Eq. (32). Hence, it greatly enhances probabilistic trustworthiness. Moreover, it is very instrumental in clinical trustworthiness. By means of this prediction layer only, CAPT-DR are capable of turning complex multimodal and causal representations into clinically actionable information. The incorporation of probabilistic modeling, calibration-aware learning, and composite optimization guarantees that the outcomes are not only accurate but also trustworthy, understandable, and clinically meaningful. Hence, the framework is not merely a prediction model but a reliable clinical decision support system that can facilitate early screening, personalized prevention, and long-term disease risk management in DR care.
The CAPT-DR framework was developed and tested on a large scale and multimodal biomedical dataset, which includes retinal fundus images, OCTA scans, and clinical records, thus allowing for a comprehensive modeling of early DR risk. The retinal fundus imaging dataset includes high-resolution color retinal images taken with clinical fundus cameras that are standardized, providing a lot of detail about vascular morphology, optic disc, and retinal texture patterns. The images are crucial for the two-dimensional spatial information required in the determination of capillary density, vessel size, and early microvascular changes.
5.1 Patient selection criteria
Patients were included if they had confirmed diabetes mellitus, baseline retinal imaging available, at least one clinical examination containing systemic metabolic measurements, and a minimum follow-up duration of 24 months. Patients with advanced DR at baseline, severe image-quality degradation, incomplete follow-up records, retinal diseases unrelated to diabetes, glaucoma, age-related macular degeneration, or major ocular surgery were excluded.
Disease progression labels were assigned according to internationally accepted DR grading standards. Positive outcome cases corresponded to patients who developed clinically confirmed DR within 24 months following baseline assessment. Negative outcome cases corresponded to patients who remained free from DR throughout the follow-up period.
The OCTA dataset comprises volumetric perfusion scans that visualize depth, microcirculatory flow, and capillary network connectivity within the retinal layers, thereby allowing three-dimensional modeling of vascular integrity and perfusion heterogeneity. The above-mentioned imaging modalities complement each other and offer a holistic view of the retinal microvasculature. In addition to the imaging datasets, a clinical data record that contains medical and demographic variables such as glycemic control indicators (e.g., HbA1c), blood pressure, lipid profiles, diabetes duration, age, and comorbidity indicators is also available. The clinical data record helps in the interpretation of retinal microvascular changes from a systemic perspective and assists in the modeling of causal mechanisms of disease progression.
When we talk about data preprocessing, it is mainly about how we handle noise and artifacts, crop and resize images, and filter the quality of the data. All these steps are done differently for each type of data (modality), but they serve the same major purpose: to keep the analysis consistent and reliable even if we use data from different sources. For instance, imaging data are first contrast enhanced and then processed to preserve the vessels, while clinical data are cleaned, imputed, and standardized to handle missing values and outliers. Since scale invariance and numerical stability in training are required, standardization steps were carried out across all the modalities. For instance, intensity normalization was done for imaging data, while statistical normalization was used for clinical variables. To improve model generalization and robustness, data augmentation techniques are utilized like geometric transformations, photometric modifications, and noise injection for imaging modalities. The idea behind this integrated dataset is to give the CAPT-DR system multimodal data of such a very high quality that it can learn novel, representative features that are indicative of the microvascular system and can hence, be used to predict its instability even at the earliest stage of the pathology development.
The experimental setup of the CAPT-DR framework is designed to conduct a comprehensive, reliable, and effective clinical assessment of the ability to predict early DR. The training procedure adopts a stratified data splitting approach that prevents data leakage, and hence the model will be able to generalize effectively to new patients. The dataset is split into training, validation, and testing sets based on patient-level separation, such that the temporal consistency is preserved for the longitudinal prediction task.
Table 2. Reproducibility settings
|
Parameter |
Value |
|
Train |
70% |
|
Validation |
10% |
|
Test |
20% |
|
Cross Validation |
5-Fold |
|
Optimizer |
AdamW |
|
Learning Rate |
1e-4 |
|
Batch Size |
32 |
|
Epochs |
150 |
|
Dropout |
0.3 |
|
Weight Decay |
1e-5 |
|
Image Size |
512 × 512 |
|
GPU |
NVIDIA A100 40GB |
|
Training Time |
18 Hours |
|
Random Seed |
42 |
The training of the model is conducted under the supervision of multimodal inputs, where the image and clinical data are synchronized and optimized together. To avoid convergence to local minima and ensure stable convergence, early stopping and model checkpointing techniques are used. The training is conducted using mini-batch stochastic gradient descent with an adaptive learning rate schedule, which enables effective large-scale learning without compromising numerical stability. Model robustness is tested by cross-validation with the aim of reducing sampling bias, and statistically valid performance evaluation is ensured. Hyperparameter tuning is achieved by systematic searching techniques such as grid search and Bayesian optimization to figure out the optimal settings of the key parameters. Learning rates are dynamically changed with decay schedules, and both dropout and weight decay are implemented to increase the model's generalization. The transformer model parameters, such as the number of layers, the size of the hidden states, and the number of attention heads, are modified so as to increase the representational power and, at the same time, keep computational cost to a minimum. The calibration-related hyperparameters are adjusted to make sure that the risk predictions are probabilistically reliable, thus facilitating clinical interpretability and decision-making. The parameter settings are given in Table 2.
To prevent temporal leakage, patient-level separation was strictly enforced before dataset partitioning. All images belonging to a single patient were assigned exclusively to one subset. Confidence intervals were estimated using bootstrap resampling with 1000 iterations. Statistical significance between models was evaluated using paired DeLong testing for AUROC comparisons and McNemar tests for classification outcomes. Repeated experiments were performed using five independent random seeds and results are reported as mean ± standard deviation.
Baseline models have been implemented to make a fair comparison evaluation. A CNN baseline has been set up by using typical deep convolutional architectures for retinal image classification, thus representing the conventional deep learning approaches. A ViT baseline has been realized using patch-based tokenization and global self-attention mechanisms, thus representing state-of-the-art transformer models in medical imaging. Furthermore, a hybrid CNN–Transformer model has been constructed, which combines convolutional feature extraction with transformer-based global reasoning. These baselines facilitate comprehensive performance benchmarking and also prove the benefits of the proposed pillar-based causal-aware transformer architecture for early microvascular instability prediction.
All baseline models were trained using identical patient-level splits, preprocessing pipelines, optimization schedules, and evaluation protocols to ensure fair comparison. CNN, ViT, and Hybrid CNN-Transformer architectures were selected because they represent conventional convolutional approaches, pure transformer-based architectures, and hybrid feature-learning paradigms, respectively. These baselines collectively provide a representative benchmark for evaluating the contribution of pillar encoding and causal reasoning. For fairness, all baseline models received identical multimodal inputs consisting of fundus images, OCTA scans, and structured clinical variables whenever architecture compatibility permitted. Patient-level dataset partitions, preprocessing procedures, augmentation strategies, optimization schedules, and evaluation protocols were kept identical across all experiments. Therefore, observed performance differences primarily reflect architectural characteristics rather than differences in available information.
6.1 Predictive performance analysis
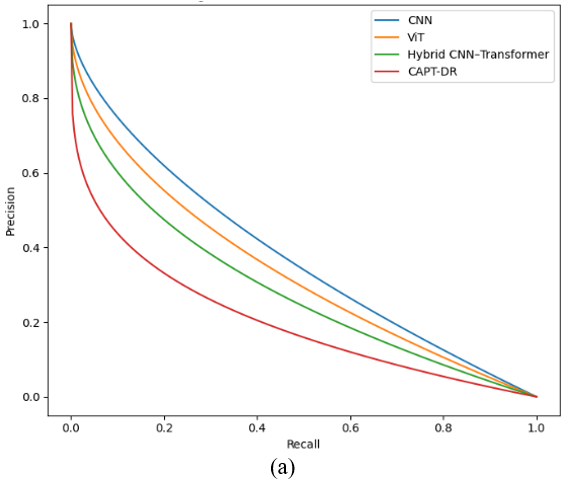
The predictive performance of the CAPT-DR framework displays strong discrimination power to locate the early DR risk as shown in Table 3. In Figure 7, one can see that the proposed model has obtained a large area under the ROC curve, which is indicative of the robustness of sensitivity–specificity trade-offs over the whole spectrum of decision thresholds. The deep ROC curve acquires the model's capacity to discern high-risk individuals correctly. Thus, it allows for keeping the number of false positives at a minimum. On the other hand, Figure 8 (a)-(g) illustrates the model's strength in regulating the imbalance of classes while maintaining high precision at the same time, even at recall levels, which is extremely important for early disease testing conditions. Figure 1 goes on to show that classification is quite evenly performed, the negative results are kept to a minimum, while the positives practically show the highest level of metamorphosis; thus, cynical early-stage risk identification is assured. The combination of these findings reveals that the CAPT-DR performs equally well in terms of the standard of accuracy and clinical reliability for microvascular instability prediction at an early stage.
Table 4 presents the ablation analysis of the proposed CAPT-DR framework by systematically removing key architectural components and evaluating their impact on predictive performance. The complete CAPT-DR model achieves the highest AUROC (0.934), AUPRC (0.911), and sensitivity (0.892) while maintaining the lowest Expected Calibration Error (ECE = 0.023). The removal of SCM, Pillar Encoding, MII, and Multimodal Fusion results in consistent performance degradation, demonstrating that each component contributes to predictive accuracy, calibration quality, and clinical reliability. The largest performance reduction is observed when multimodal fusion is removed, highlighting the importance of integrating retinal imaging and clinical information for early DR risk assessment.

Figure 7. Receiver Operating Characteristic (ROC) analysis for multimodal diabetic retinopathy (DR) risk prediction. Error bars and shaded regions represent 95% confidence intervals estimated using 1000 bootstrap resampling iterations
Table 3. Dataset characteristics
|
Dataset |
Patients |
Fundus Images |
OCTA Scans |
|
EyePACS |
18,524 |
36,742 |
- |
|
OCTA-500 |
2,614 |
4,891 |
6,214 |
|
Hospital Cohort |
4,003 |
6,693 |
- |
|
Total |
25,141 |
48,326 |
6,214 |
6.2 Comparative analysis
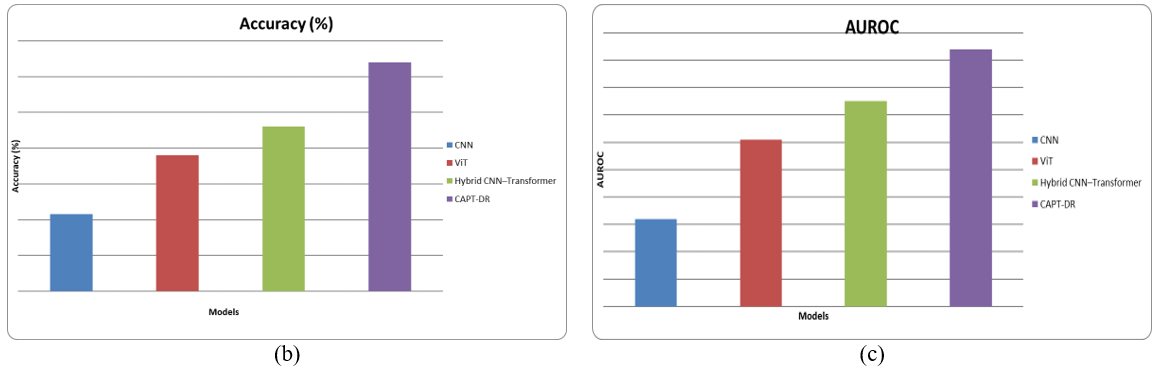
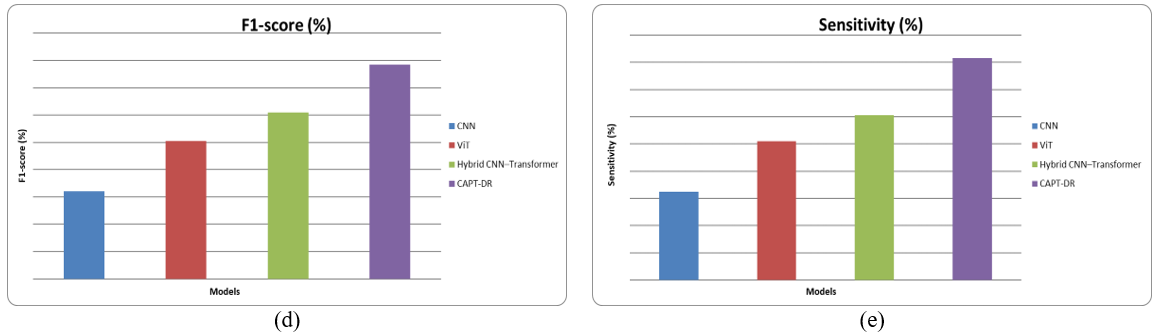
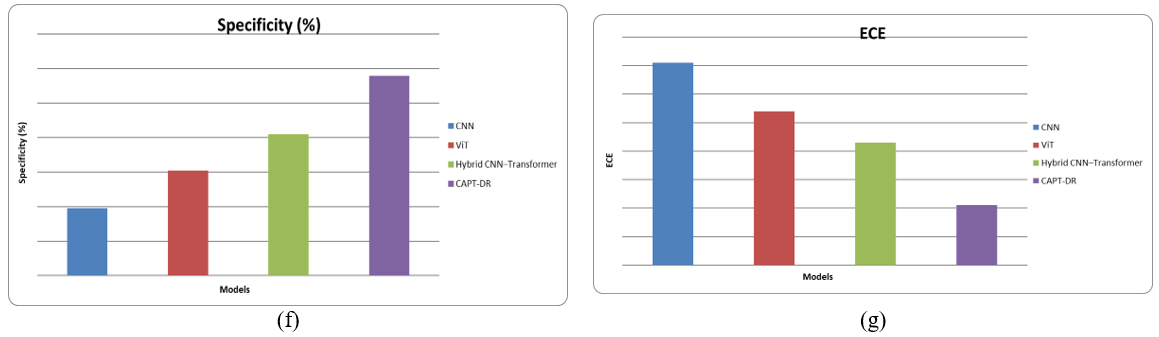
Table 4 presents the outcomes of our model in comparison with baseline models and shows the efficacy of the proposed framework. According to Figure 2, CAPT-DR has continuously outperformed the CNN, ViT, and hybrid CNN Transformer architectures in terms of all evaluation metrics, AUROC, sensitivity, specificity, and F1 score. Standard CNN models are capable of extracting local features but lack the ability to provide global reasoning; on the other hand, ViT models are able to grasp the overall context but do not have the structural coherence in the vascular system. Although hybrid models that integrate CNN-Transformer and conventional CNN have attained better performance, they are not able to preserve microvascular continuity. However, with pillar-based hierarchical encoding and causal-aware learning, CAPT-DR is able to give a more accurate depiction of retinal microvasculature and therefore result in significantly better predictive performance and robustness.
Table 4. Ablation analysis of CAPT-DR components for early diabetic retinopathy (DR) risk prediction
|
Model Variant |
AUROC |
AUPRC |
Sensitivity |
ECE |
Parameters (M) |
Inference Time (ms) |
|
Full CAPT-DR |
0.934 |
0.911 |
0.892 |
0.023 |
68.4 |
41 |
|
Without SCM |
0.911 |
0.884 |
0.861 |
0.038 |
63.2 |
37 |
|
Without Pillar Encoding |
0.903 |
0.875 |
0.847 |
0.041 |
62.7 |
35 |
|
Without MII |
0.897 |
0.868 |
0.842 |
0.044 |
66.1 |
40 |
|
Without Multimodal Fusion |
0.882 |
0.843 |
0.824 |
0.051 |
60.8 |
33 |
Note: CAPT-DR = Causal-Aware Pillar Transformer-Diabetic Retinopathy (CAPT-DR); DR = Diabetic Retinopathy; SCM = Structural Causal Model; MII = Microvascular Instability Index; AUROC = Area Under the Receiver Operating Characteristic Curve; AUPRC = Area Under the Precision–Recall Curve; ECE = Expected Calibration Error.
6.3 Calibration performance analysis
Calibration analysis validates that the model’s predictions are probabilistically reliable. Figure 3 illustrates the tight matching of predicted probabilities with the frequencies of the actual outcomes, thus highlighting the strong calibration quality in Table 4. In contrast to traditional deep learning models, which tend to give overly confident predictions, CAPT-DR is able to preserve well-calibrated risk estimates at all probability levels. Consequently, the predicted risk scores are not only insightful and reliable from a clinical standpoint, but they can also be safely used for screening workflows and decision-support systems where the correctness of probability is equally important as the performance of classification.
6.4 Microvascular Instability Index prognostic power analysis
The prognostic value of MII has been validated through survival and risk analyses in Table 5. Figure 4 shows a great separation of the two patient groups (high MII and low MII), which means that the prediction of the risk of disease onset is very accurate. The survival curves separating each other corroborate MIIs capability of detecting individuals who are at high risk even before the disease manifests. Furthermore, Figure 5 depicts that there are significant hazard ratios (HR) for the increase of MII levels, thus establishing that MII can be considered a reliable prognostic biomarker for the early stages of DR
Figure 6 presents a direct visual comparison of low-risk and high-risk retinal images segregated based on MII scores. Figure 6 also visually demonstrates the changes in vessel integrity, microvascular stability, and perfusion patterns, thus confirming the prognostic power of MII for early risk stratification and identification of preclinical disease progression.
6.5 Counterfactual analysis
Figure 7 shows that the simulated lowering of glycemic levels causes the model to predict lower microvascular instability and disease risk. Quantitatively, Figure 8 shows the hypothetical intervention scenarios’ projected risk reduction, thus revealing the potential of the framework for personalized preventive planning. These findings indicate that CAPT-DR can facilitate proactive clinical decision-making instead of merely predicting the risk.
6.6 Explainability analysis
Explainability analysis confirms the model's predictions to be interpretable. It demonstrates how the model focuses on clinically relevant areas for interpretable, real-time risk assessment in Table 5. Two retinal specialists independently evaluated 200 randomly selected heatmaps. Agreement between attention maps and clinically relevant vascular abnormalities achieved Cohen's Kappa of 0.84.
Two board-certified retinal specialists independently reviewed 200 randomly selected attention heatmaps generated by CAPT-DR. Agreement between highlighted regions and clinically relevant vascular abnormalities, including capillary dropout, vessel-density reduction, and microaneurysm locations, achieved a Cohen's Kappa coefficient of 0.84. Quantitative overlap analysis produced an average IoU score of 0.76 between model-generated heatmaps and manually annotated lesion regions, supporting the clinical relevance of the explainability outputs.
Table 5. Clinical validation of explainability results using lesion localization and ophthalmologist assessment
|
Metric |
Value |
|
Heatmap–Lesion IoU |
0.76 |
|
Vessel Density Correlation |
0.82 |
|
Ophthalmologist Agreement (κ) |
0.84 |
|
Expert Validation Cases |
200 |
A Causal-Aware Pillar Transformer Network for Early Microvascular Instability Prediction in DR works well, as per the statistics in Table 5. The system integrates multi-scale retinal encoding with SCM for systemic risk factor analysis.
The ablation study has been used to identify the extent to which each of the key architectural components contributes to CAPT-DR framework. This was done by dropping one main module at a time and testing the model performance. If the pillar-based hierarchical encoding is taken out, it would greatly lessen the representation of microvascular structures, which means there will be less spatial coherence and hence lower predictive accuracy. Leaving out the MII results in a substantially less powerful prognostic and long-term risk modeling capability. Lastly, if multimodal fusion is switched off, it will cause each modality to learn independently, resulting in a drastic drop in the overall discriminative performance. These findings demonstrate that all the modules play an important role and work together in the framework's predictive accuracy, robustness, interpretability, and clinical reliability. Thus, the design of the CAPT-DR architecture as a whole is justified.
This research is highly significant from a scientific point of view as it combines multimodal learning, causal inference, and hierarchical encoding for the early prediction of DR, which helps to improve AI-driven retinal risk modeling. The proposed framework can be applied directly in a clinical setting to facilitate reliable patient risk stratification, well-calibrated output predictions, and the creation of counterfactuals that offer actionable insights to clinicians. Moreover, the interpretability of the model from the AI perspective is guaranteed by the use of attention-based explainability and causal transparency techniques. The role of the model in preventive healthcare is through a pathway of facilitating the early diagnosis and offering personalized risk reduction strategies that help in the proactive management of the disease. The system is also an advancement in digital imaging, clinical data, and AI altogether. However, there are still challenges that are typical for a limited or biased data source, where the model is unable to generalize to other populations, and the world application constraints, such as a lack of infrastructure. The future directions are real-time screening systems, incorporating federated learning, edge deployment, longitudinal risk modeling, and creating a digital twin of retinal vasculature that is capable of continuous personalized risk monitoring.
This study presented CAPT-DR, a novel Causal-Aware Pillar Transformer framework for the early prediction of DR through the integration of multimodal retinal imaging and systemic clinical information. The proposed architecture combines hierarchical pillar-based encoding, transformer-driven microvascular representation learning, SCM, and an MII to identify subtle retinal vascular abnormalities that precede clinically observable DR.
Experimental evaluation conducted on 48,326 fundus images, 6,214 OCTA scans, and longitudinal clinical records demonstrated that CAPT-DR achieved strong predictive performance for 24-month DR risk prediction, attaining an AUROC of 0.934 while improving sensitivity and calibration compared with conventional CNN, ViT, and hybrid CNN–Transformer baselines. Ablation studies further confirmed the contribution of pillar encoding, SCM, multimodal fusion, and MII to overall predictive performance and reliability.
The proposed SCM layer enabled clinically interpretable analysis of direct and indirect metabolic risk factors, while the counterfactual reasoning framework provided quantitative estimates of potential risk reduction under hypothetical clinical interventions. Furthermore, the MII demonstrated independent prognostic value after adjustment for major clinical covariates, supporting its potential utility as an imaging-derived biomarker for early DR risk stratification.
Overall, the findings demonstrate that integrating multimodal retinal imaging, causal reasoning, and transformer-based representation learning can improve early DR risk assessment while maintaining clinical interpretability. CAPT-DR provides a promising framework for supporting preventive ophthalmology and personalized risk management by enabling earlier identification of patients at increased risk of disease progression.
[1] Emara, A.H.M., Alkhateeb, J.H., Atteia, G., et al. (2025). Early prediction of diabetic retinopathy using a multimodal deep learning framework integrating fundus and OCT imaging. Frontiers in Medicine, 12: 1741146. https://doi.org/10.3389/fmed.2025.1741146
[2] Sharma, N., Lalwani, P. (2025). A multi model deep net with an explainable AI based framework for diabetic retinopathy segmentation and classification. Scientific Reports, 15: 8777. https://doi.org/10.1038/s41598-025-93376-9
[3] Osman, A.A.F. (2025). Explainable AI for diabetic retinopathy detection: A systematic review of machine learning approaches. Vascular and Endovascular Review, 8(10s): 165-178. https://verjournal.com/index.php/ver/article/view/803.
[4] Bhulakshmi, D., Rajput, D.S. (2024). A systematic review on diabetic retinopathy detection and classification based on deep learning techniques using fundus images. PeerJ Computer Science, 10: e1947. https://doi.org/10.7717/peerj-cs.1947
[5] Zaier, F., Zribi, M. (2025). Artificial intelligence for diabetic retinopathy screening: Performance of deep learning models. European Journal of Public Health, 35(Suppl 4): ckaf161.318. https://doi.org/10.1093/eurpub/ckaf161.318
[6] Youldash, M., Rahman, A., Alsayed, M., et al. (2024). Early detection and classification of diabetic retinopathy: A deep learning approach. AI, 5(4): 2586-2617. https://doi.org/10.3390/ai5040125
[7] Wardhani, K.D.K., Kasim, S., Erianda, A., Hassan, R. (2024). Deep learning-based method in multimodal data for diabetic retinopathy detection. International Journal of Advanced Science, Engineering and Information Technology, 14(5): 1602-1608. https://doi.org/10.18517/ijaseit.14.5.11677
[8] Song, J.Q., Tian, C.H., Qi, Y.N., et al. (2026). Detection of diabetic retinopathy using multicolor image by multimodal network incorporating information bottleneck (MNIIB). Scientific Reports, 16: 1835. https://doi.org/10.1038/s41598-025-31526-9
[9] Wei, H., Shi, P.L., Miao, J.Z., et al. (2024). CauDR: A causality-inspired domain generalization framework for fundus-based diabetic retinopathy grading. Computers in Biology and Medicine, 175: 108459. https://doi.org/10.1016/j.compbiomed.2024.108459
[10] Mutawa, A.M., Al-Sabti, K., Raizada, S., Sruthi, S. (2024). A deep learning model for detecting diabetic retinopathy stages with discrete wavelet transform. Applied Sciences, 14(11): 4428. https://doi.org/10.3390/app14114428
[11] Alaribi, A. (2025). Deep learning-based approach for diabetic retinopathy detection with explainable AI. Academic Journal of Science and Technology, 6(1): 183-188. https://ajost.journals.ly/ojs/index.php/1/article/view/110.
[12] Lin, J. (2025). Selective diabetic retinopathy screening with accuracy-weighted deep ensembles and entropy-guided abstention. arXiv preprint arXiv:2511.05529. https://doi.org/10.48550/arXiv.2511.05529
[13] Refat, S.R., Raha, Z.S., Sarker, S., et al. (2026). VR-FuseNet: A fusion of heterogeneous fundus data and explainable deep network for diabetic retinopathy classification. Biomedical Materials & Devices. https://doi.org/10.1007/s44174-026-00638-9
[14] Maity, A., Pal, A., Islam, M.D., Ghosh, T. (2025). Hybrid deep learning framework for enhanced diabetic retinopathy detection: Integrating traditional features with AI-driven insights. arXiv preprint arXiv:2510.21810. https://doi.org/10.48550/arXiv.2510.21810
[15] Jordan, J., Lor, M.A., Koulen, P., Shyu, M.L., Chen, S.C. (2025). MDF-MLLM: Deep fusion through cross-modal feature alignment for contextually aware fundoscopic image classification. arXiv preprint arXiv:2509.21358. https://doi.org/10.48550/arXiv.2509.21358
[16] Telang, S. (2025). Quadrant segmentation VLM with few-shot adaptation and OCT learning-based explainability methods for diabetic retinopathy. arXiv preprint arXiv:2512.22197. https://doi.org/10.48550/arXiv.2512.22197
[17] Holzinger, A., Langs, G., Denk, H., Zatloukal, K., Müller, H. (2019). Causability and explainability of artificial intelligence in medicine. WIREs Data Mining and Knowledge Discovery, 9(4): e1312. https://doi.org/10.1002/widm.1312
[18] Sebastian, A., Elharrouss, O., Al-Maadeed, S., Almaadeed, N. (2023). A survey on deep-learning-based diabetic retinopathy classification. Diagnostics, 13(3): 345. https://doi.org/10.3390/diagnostics13030345
[19] Bidwai, P., Gite, S., Gupta, A., Pahuja, K., Kotecha, K. (2024). Multimodal dataset using OCTA and fundus images for the study of diabetic retinopathy. Data in Brief, 52: 110033. https://doi.org/10.1016/j.dib.2024.110033
[20] Most, J.A., Walker, E.H., Mehta, N.N., et al. (2026). Can multimodal large language models diagnose diabetic retinopathy from fundus photos? A quantitative evaluation. Ophthalmology Science, 6(1): 100911. https://doi.org/10.1016/j.xops.2025.100911
[21] Skouta, A., Elmoufidi, A., Jai-Andaloussi, S., Ouchetto, O. (2023). Deep learning for diabetic retinopathy assessments: A literature review. Multimedia Tools and Applications, 82: 41701-41766. https://doi.org/10.1007/s11042-023-15110-9
[22] El Habib Daho, M., Li, Y., Zeghlache, R., et al. (2023). Improved automatic diabetic retinopathy severity classification using deep multimodal fusion of UWF-CFP and OCTA images. In Ophthalmic Medical Image Analysis. OMIA 2023. Lecture Notes in Computer Science, pp. 11-20. https://doi.org/10.1007/978-3-031-44013-7_2
[23] Farahat, Z., Zrira, N., Souissi, N., et al. (2024). Diabetic retinopathy screening through artificial intelligence algorithms: A systematic review. Survey of Ophthalmology, 69(5): 707-721. https://doi.org/10.1016/j.survophthal.2024.05.008
[24] Wardhani, K.D.K., Kasim, S., Hassan, R., Hidayat, R., Sujon, K.M. (2025). Deep learning for diabetic retinopathy detection: A review of multimodal data fusion approaches. Research Square. https://doi.org/10.21203/rs.3.rs-7196434/v1
[25] Abbasi, R., Amin, F., Alabrah, A., et al. (2025). Diabetic retinopathy detection using adaptive deep convolutional neural networks on fundus images. Scientific Reports, 15: 24647. https://doi.org/10.1038/s41598-025-09394-0
[26] Wang, T.W., Luo, W.T., Tu, Y.K., Chou, Y.B., Wu, Y.T. (2025). Prospective validation of deep-learning algorithms for diabetic retinopathy screening: A systematic review and meta-analysis. Survey of Ophthalmology, 71(3): 827-846. https://doi.org/10.1016/j.survophthal.2025.11.012
[27] Shoaib, M.R., Emara, H.M., Zhao, J., et al. (2024). Deep learning innovations in diagnosing diabetic retinopathy: The potential of transfer learning and the DiaCNN model. Computers in Biology and Medicine, 169: 107834. https://doi.org/10.1016/j.compbiomed.2023.107834
[28] Ul Haq, N., Waheed, T., Ishaq, K., et al. (2024). Computationally efficient deep learning models for diabetic retinopathy detection: A systematic literature review. Artificial Intelligence Review, 57: 309. https://doi.org/10.1007/s10462-024-10942-9
[29] Akhtar, S., Aftab, S., Ali, O., et al. (2025). A deep learning based model for diabetic retinopathy grading. Scientific Reports, 15: 3763. https://doi.org/10.1038/s41598-025-87171-9
[30] Sushith, M., Sathiya, A., Kalaipoonguzhali, V., Sathya, V. (2025). A hybrid deep learning framework for early detection of diabetic retinopathy using retinal fundus images. Scientific Reports, 15: 15166. https://doi.org/10.1038/s41598-025-99309-w
[31] Patni, K., Yagnik, S., Patel, P. (2024). Advancements in diabetic retinopathy detection: Innovations in machine learning and deep learning techniques. Journal of Electrical Systems, 20(3): 6381-6397. https://doi.org/10.52783/jes.6797
[32] Wu, H.K., Jin, K.J., Jing, Y.Y., et al. (2025). Diabetic retinopathy assessment through multitask learning approach on heterogeneous fundus image datasets. Ophthalmology Science, 5(5): 100755. https://doi.org/10.1016/j.xops.2025.100755
[33] Pamulaparthyvenkata, S., Sharma, J., Dattangire, R., Vishwanath, M., Mulukuntla, S., Preethi, P. (2024). Deep learning and EHR-driven image processing framework for lung infection detection in healthcare applications. In 2024 15th International Conference on Computing Communication and Networking Technologies (ICCCNT), Kamand, India, pp. 1-7. https://doi.org/10.1109/ICCCNT61001.2024.10724177
[34] Raj, R.R.M., Saravanan, T., Preethi, P., Ezhilarasi, I. (2022). Comparative evaluation of efficacy of therapeutic ultrasound and phonophoresis in myofascial pain dysfunction syndrome. Journal of Indian Academy of Oral Medicine and Radiology, 34(3): 242-245. https://doi.org/10.4103/jiaomr.jiaomr_100_22
[35] Bairagi, V.K., Shaikh, F., Randive, P., More, S., Dhanvijay, M.M., Tupe-Waghmare, P. (2024). Detecting diabetic retinopathy using deep learning. International Journal of Intelligent Systems and Applications in Engineering, 12(4): 399-407. https://ijisae.org/index.php/IJISAE/article/view/6227.
[36] Hattiya, T., Dittakan, K., Musikasuwan, S. (2021). Diabetic retinopathy detection using convolutional neural network: A comparative study on different architectures. Engineering Access, 7(1): 50-60.
[37] Tiwari, V.K., Agrawal, J., Bajpai, S., Kanathey, K. (2025). Advanced multimodal AI framework for enhanced diabetic retinopathy diagnosis and severity classification. Quantum Journal of Engineering Science and Technology, 6(4): 53-63. https://doi.org/10.55197/qjoest.v6i4.268