Samar A. Shaabeth* | Hassanain Ali Lafta
© 2026 The authors. This article is published by IIETA and is licensed under the CC BY 4.0 license (http://creativecommons.org/licenses/by/4.0/).
OPEN ACCESS
Stroke risk prediction using machine learning has attracted increasing attention; however, the generalizability of predictive models across heterogeneous clinical data sources remains a major challenge. This study investigates the influence of data source heterogeneity on the performance and transferability of machine learning models for stroke risk prediction. Three publicly available datasets from different sources were analyzed, including variations in sample characteristics, feature distributions, and stroke prevalence. A standardized preprocessing framework was applied, followed by statistical analysis, principal component analysis, and comparative evaluation of Logistic Regression, K-Nearest Neighbor (KNN), Support Vector Machine (SVM), and Random Forest (RF) models. To address severe class imbalance, Synthetic Minority Oversampling Technique (SMOTE) was integrated within the model training pipeline. The results demonstrate that conventional models showed limited generalization across different datasets, particularly when applied to external cohorts with different feature distributions. In contrast, the RF model combined with SMOTE achieved superior classification performance within individual datasets, with improved sensitivity in identifying stroke cases.
machine learning, stroke risk prediction, data heterogeneity, cross-dataset validation, Random Forest, Synthetic Minority Oversampling Technique, clinical decision support
Stroke is a leading cause of morbidity, mortality, and disability worldwide, posing a significant burden on healthcare systems and individual well-being, being third in 2021 in death rates’ causes. According to the World Health Organization, it is the second leading cause of death globally, responsible for approximately 15 million people annually, resulting in 11% of all deaths, with 5 million people living with permanent disabilities [1, 2]. Disease prediction, diagnosis, and treatment planning are a crucial part of the healthcare system. They have undergone rapid development due to advancements in artificial intelligence (AI) and machine learning (ML) in particular. ML techniques help in the documentation process of medical data, increasing the reliability of electronic health records (EHRs), bio-signals, and imaging data to accurately identify patterns of diseases and to predict stroke risk. Different tools and algorithms of ML algorithms have been and are still used for structured data analysis, such as Support Vector Machines (SVM), Decision Trees (DT), and Random Forests (RF). While deep learning models (DL), including Convolutional Neural Networks (CNN) and Recurrent Neural Networks (RNN), have been widely used for handling complex, unstructured data like brain MRIs and time-series signals. ML and DL enable early identification of risk factors, which facilitate fast and reliable interventions that can decrease stroke’s consequences [3]. As ML models require multiple dataset resources, open-access datasets accelerated the development of medical prediction, making them the foundation of multiple modern medical data and development [4-6]. Clinical risk stratification tools, such as the CHA2DS2-VASc and QRISK3 scores, have been used as conventional tools for risk factors and prediction. Those tools have limitations in being effective for specific patient populations; however, lacking the comprehensive scope needed to account for the complex interplay of a wide range of clinical, lifestyle, and physiological factors that contribute to stroke risk [7-10]. Beyond simple distribution shifts, the robustness of medical AI is further threatened by modality interactions and vulnerabilities to adversarial inputs, as noted by Mozhegova et al. [11].
ML and DL models have the potential to overcome the limitations of conventional scores by identifying intricate patterns and relationships within complex health data. However, data source heterogeneity is a significant challenge in the field of medical data handling. Variation in data characteristics is a challenge, including differing feature sets, population demographics, data collection methodologies, and clinical definitions across different datasets [12, 13]. Variation and hence heterogeneity severely impact a model's generalizability and robustness, making it difficult to deploy a single, reliable model across various clinical settings [7-10]. Machine learning models usually demonstrate high performance in controlled settings, but their real-world utility is frequently constrained by data heterogeneity. Recent studies emphasize the generalization gap, highlighting that models trained on specific clinical distributions often fail when applied to unseen patient populations [14-16]. Although there remains a critical need to evaluate how these optimized models perform across heterogeneous data sources, as they address class imbalance within single datasets.
This study investigates the impact of data source heterogeneity on the performance of various ML models for stroke risk prediction. Determining whether models trained on a single, homogeneous dataset can effectively generalize to data from different sources and identifies which types of models are most robust to these variations [17]. A comparative analysis was performed using three distinct, publicly available stroke datasets from Kaggle, Mendeley, and Framingham, which exhibit notable differences in feature sets, sample sizes, and class balance [18-20]. The proposed approach evaluated linear classifiers (Logistic Regression) and non-linear models (RF) integrated with the Synthetic Minority Over-sampling Technique (SMOTE). Performance was assessed using accuracy, recall, and F1-score.
This study investigated the impact of data source heterogeneity on machine learning-based stroke risk prediction using a rigorous, multi-step methodology. The approach involves the selection of three distinct public health datasets, followed by a standardized data preprocessing pipeline, comparative analysis using Principal Component Analysis (PCA), and a comprehensive evaluation of multiple machine learning models.
2.1 Datasets
Three open-source publicly available datasets were used for this comparative analysis [18-20]. All datasets were sourced from open-access platforms and contained patient health information relevant to stroke risk as follows:
Dataset 1 (Kaggle Stroke Prediction Dataset): It contains 5,110 patient records with 12 features, including demographic information, lifestyle factors, and specific clinical measurements such as avg, glucose level and body mass index (BMI). The target variable, stroke, indicates a stroke event. This dataset is sourced for educational purposes and was used for this study for comparative purposes to demonstrate the purpose of the investigative approach used. The data was recently modified to be used for educational and research purposes [20].
Dataset 2 (Mendeley Stroke Prediction Dataset): It includes a total of 4603 subjects who fulfilled the inclusion and exclusion criteria from NHANES. Of these, 362 individuals (7.86%) were diagnosed as stroke patients, while 4,241 individuals (92.14%) were identified as non-stroke patients, offering a much more detailed set of clinical and lifestyle variables, including lab results like fasting glucose, total cholesterol, and various nutrient intake metrics [19].
Dataset 3 (Framingham Heart Study Dataset): It includes 4,240 records,16 columns, and 15 attributes. While originally designed to predict the 10-year risk of coronary heart disease (CHD), the target variable, TenYearCHD, was renamed to stroke to ensure consistency in classification tasks across all study datasets. It comprises records from the long-term Framingham Heart Study, which focuses on cardiovascular disease. Key features include age, systolic blood pressure (BP), diastolic BP, and glucose. The target variable, TenYearCHD, was renamed to stroke to maintain consistency across the datasets [18].
2.2 Data preprocessing and alignment
As the datasets were from different sources with different categories, a standardized preprocessing pipeline was applied to each dataset to ensure a fair and consistent comparison. As a first step, a dataset summary table (Table 1) was generated to document the number of samples, features, and the percentage of stroke cases in each dataset. For each dataset, categorical features were encoded using LabelEncoder, and missing numerical values were assigned the mean of their respective columns. Model training and evaluation were conducted using the full, unique feature set of each respective dataset. A core set of features (age, gender, hypertension) was identified for initial alignment reference and statistical analysis. Furthermore, the full range of features was utilized by the machine learning models to capture a comprehensive, medically accurate representation of predictive drivers.
Table 1. Summary of dataset characteristics and statistical significance of risk factors
|
Dataset |
Number of Samples |
Number of Features |
Stroke Percentage |
|
Kaggle |
5110 |
12 |
4.87% |
|
Mendeley |
4603 |
36 |
7.86% |
|
Framingham |
4240 |
16 |
15.19% |
This ensured that all models had a common, medically relevant starting point in spite of their differences (like Dataset 2 having 36 features and Dataset 1 having 12). However, the complete feature set from each source was preserved for the subsequent feature importance analysis, allowing for a more clinically insightful interpretation.
Although basic risk factors are present, the performance comparison was fair. Finally, each prepared dataset was partitioned into feature matrices (X) and target vectors (y) to facilitate model training.
To address the inherent heterogeneity across the selected datasets, a structural alignment of clinical features was performed. As detailed in Table 2, while several core physiological markers, specifically age, hypertension, heart_disease, glucose level, and BMI, were present across all three cohorts, other clinical and lifestyle variables were unique to specific data sources. This feature mapping served as the foundation for our standardized preprocessing pipeline. To maintain structural consistency, missing features in specific cohorts were addressed through a systematic imputation approach. Recent applications of cross-dataset validation demonstrate that these approaches are critical for confirming the clinical applicability of binary classification models [21-23]. This alignment ensures that our comparative analyses were conducted on a consistent set of medically relevant risk factors while preserving the unique predictive information present in each dataset. Furthermore, to address the impact of class imbalance on model predictive performance, the SMOTE was directly integrated within our cross-validation pipeline. By employing an ImbPipeline, synthetic samples were generated only during the training phase, preventing data leakage into the validation folds (Table 3). While the Framingham Heart Study is primarily recognized for cardiovascular disease prediction, the TenYearCHD (10-year risk of CHD) variable was utilized as a proxy for stroke risk in our comparative analysis.
Table 2. Feature alignment across study datasets
|
Feature |
Kaggle |
Mendeley |
Framingham |
|
Age |
X |
X |
X |
|
Gender |
X |
X |
X |
|
Hypertension |
X |
X |
X |
|
Heart disease |
X |
X |
N/A |
|
Glucose level |
X |
X |
X |
|
Body Mass Index (BMI) |
X |
X |
X |
|
Smoking status |
X |
X |
N/A |
|
Dietary metrics |
N/A |
X |
N/A |
|
Blood pressure |
N/A |
N/A |
X |
Table 3. Hyperparameter search space and optimization settings
|
Model |
Hyperparameter |
Search Space / Range |
|
Logistic Regression |
C |
[0.01, 0.1, 1, 10, 100] |
|
RF |
n_estimators |
[50, 100, 200] |
|
KNN |
n_neighbors |
[3, 5, 7, 9] |
|
SVM |
C, kernel
|
C: [0.1, 1, 10]; kernel: ['rbf', 'linear']
|
However, given the strong correlation between shared cardiovascular risk pathways, this proxy allows for a rigorous assessment of model generalizability across heterogeneous patient cohorts [21-23]. This decision is supported by the significant pathophysiological overlap between CHD and ischemic stroke; both conditions share the same core atherosclerotic risk factors, including hypertension, age, diabetes, and hyperlipidemia.
2.3 Machine learning workflow
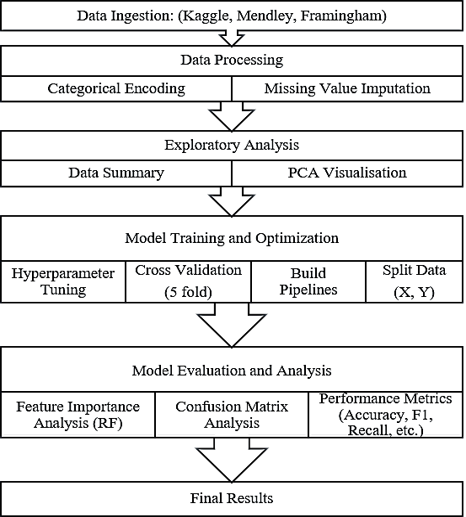
ML process began with data ingestion and preprocessing, followed by exploratory analysis using PCA. Models were then trained and evaluated using a cross-validation and hyperparameter tuning pipeline, and the best-performing models were used for performance metric calculation and feature importance analysis. The overall workflow for the machine learning analysis is summarized in Figure 1.
Figure 1. Machine learning (ML) workflow algorithm for dataset analysis
2.4 Principal Component Analysis
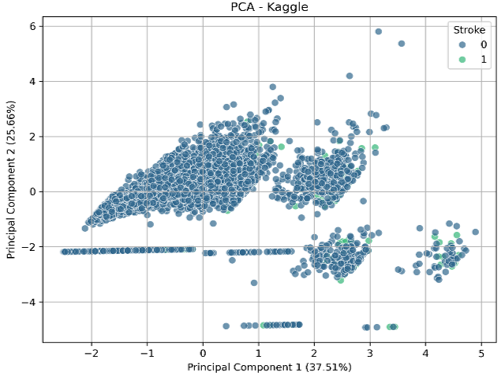
To visualize data distribution, PCA was applied to each dataset to identify potential heterogeneity, which is one of the main contributions of this study. StandardScaler was used as a feature matrix standardization tool to ensure equal contribution to the analysis [24-26]. A two-component PCA model was subsequently fitted to this standardized data. The resultant principal components were projected onto a two-dimensional scatter plot. This plot enabled a visual inspection of the clustering patterns and the degree of separation between stroke and non-stroke cases. The explained variance ratio for each principal component was also recorded to quantify the informational value of this visualization.
2.5 Model selection and evaluation
To predict stroke risk, Logistic Regression, RF, K-Nearest Neighbors (KNN), and SVM were employed as robust classifiers. For each model, an end-to-end pipeline was constructed to ensure methodological rigor. To address the significant class imbalance observed across the cohorts, particularly the low prevalence of stroke cases in the Mendeley dataset, SMOTE was integrated. Crucially, to prevent data leakage, SMOTE was applied exclusively to the training subset within each fold of our cross-validation process.
The models were evaluated using 5-fold cross-validation with a GridSearchCV approach to optimize hyperparameters (detailed in Section 3.2.2). Strict pipeline nesting was maintained: StandardScaler, the SMOTE resampling step, and the GridSearchCV hyperparameter tuning were executed solely on the training data of each respective fold. This ensured that the feature scaling, synthetic sample generation, and parameter selection were independent of the test set, providing an unbiased estimate of the model’s true clinical performance.
2.6 Performance metrics and feature importance
The performance of each model was evaluated using a comprehensive suite of metrics designed to provide a multi-dimensional assessment of diagnostic capability:
2.6.1 Accuracy
This metric measures the proportion of correctly classified instances. However, it can be misleading in imbalanced datasets as the model may prioritize the majority class ("No Stroke") to artificially inflate the score.
2.6.2 Precision
Representing the ratio of true positives to total positive predictions, precision is vital for clinical resource management. High precision minimizes unnecessary follow-up interventions and reduces patient anxiety associated with false-positive results.
2.6.3 Recall (Sensitivity)
This metric calculates the ratio of true positives to total actual positive cases. Maximizing recall is critical in stroke prediction to ensure that potential stroke events are not overlooked.
2.6.4 F1-score
Serving as the harmonic mean of precision and recall, the F1-score provides a balanced metric. It penalizes models that exhibit poor performance in either precision or recall, making it a robust measure for evaluating binary classification models.
2.6.5 Area Under the Curve-Receiver Operating Characteristic
The Area Under the Curve-Receiver Operating Characteristic (AUC-ROC) quantifies the model’s inherent ability to discriminate between stroke and non-stroke classes. By assessing performance across all classification thresholds, AUC-ROC remains a key indicator of model strength despite inherent class imbalances.
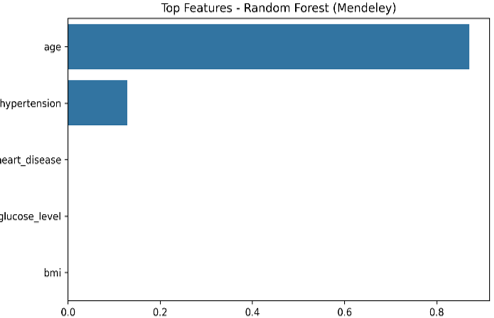
Feature importance analysis using the RF model enhanced transparency and clinical interpretability, which is the top-performing classifier across all datasets. This analysis categorizes clinical variables, such as age, glucose levels, and hypertension, by their contribution to the model's predictive output. The importance was visualized via bar charts to allow for a direct comparison of the most influential clinical factors across the three distinct cohorts. Given the variation in feature sets across the Kaggle, Mendeley, and Framingham datasets, utilizing the full feature set ensures that findings remain medically relevant to each specific cohort. Identifying these key clinical drivers is essential for the eventual clinical adoption of machine learning tools; our results consistently highlight age and glucose levels as the primary determinants of stroke risk.
This aligns with modern additive explanation frameworks [27], which emphasize the need to move beyond 'black-box' predictions toward transparent clinical decision support.
3.1 Statistical analysis of key features
The statistical analysis validates established stroke-related medical information across the three heterogeneous datasets, and it was performed before introducing machine learning to reveal any significant associations between key clinical features and stroke outcome across the three heterogeneous datasets, which will be shown in the upcoming sections.
3.1.1 Continuous variables (t-test and Analysis of Variance)
Statistical analysis evaluated the distribution of key clinical features across the three datasets (Table 4). Independent t-tests confirmed that stroke patients consistently presented with higher mean ages and elevated glucose levels compared to non-stroke subjects across all cohorts (p < 0.05). Analysis of Variance (ANOVA) testing further examined the influence of lifestyle factors; while BMI showed significant variation across smoking statuses in both Kaggle and Mendeley datasets (p < 0.001), Age showed no significant difference across smoking statuses in the Mendeley cohort (p = 0.1985), highlighting the demographic heterogeneity of our selected data sources.
Table 4. t-test and Analysis of Variance (ANOVA) results for continuous variables
|
Dataset |
Test |
Feature |
Grouping Variable |
p-Value |
|
Dataset 1 Kaggle |
t-test |
Age |
Stroke |
<0.0001 |
|
t-test |
glucose_level |
Stroke |
<0.0001 |
|
|
ANOVA |
Age |
smoking_status |
<0.0001 |
|
|
ANOVA |
Bmi |
smoking_status |
<0.0001 |
|
|
ANOVA |
Bmi |
work_type |
<0.0001 |
|
|
Dataset 2 Mendeley |
t-test |
Age |
Stroke |
<0.0001 |
|
t-test |
glucose_level |
Stroke |
0.0122 |
|
|
ANOVA |
Age |
smoking_status |
0.1985 |
|
|
ANOVA |
Bmi |
smoking_status |
<0.0007 |
|
|
Dataset 3 Framingham |
t-test |
Age |
Stroke |
<0.0001 |
|
t-test |
glucose_level |
Stroke |
<0.0001 |
3.1.2 Categorical variables (Chi-Square test)
Using Chi-Square confirmed that key categorical risk factors are strongly and consistently associated with strokes across the datasets. It was performed to evaluate the association between those factors and the occurrence of a stroke. A statistically significant association was found between hypertension and stroke across all three datasets (p < 0.05).
Similarly, a significant association was observed between heart disease and stroke in both Dataset 1 and Dataset 2 (p < 0.0001), reinforcing the clinical importance of cardiovascular history across these cohorts. Chi-Square determined whether there was a statistical significance between two categorical variables; in this case, a factor like Hypertension: Yes/No and the outcome variable (Stroke: Yes/No). This test showed that the proportion of stroke cases is different between groups (e.g., people with hypertension are significantly more likely to have a stroke than people without it. Those findings are detailed in Table 5.
Table 5. Chi-Square test results for categorical variables
|
Dataset |
Feature |
Chi-Square |
p-Value |
Significance to Hypertension |
|
Dataset 1 (Kaggle) |
Hypertension |
81.61 |
<0.0001 |
Yes |
|
Heart Disease |
90.26 |
<0.0001 |
Yes |
|
|
Dataset 2 (Mendeley) |
Hypertension |
12.65 |
0.0004 |
Yes |
|
Heart Disease |
80.59 |
<0.0001 |
Yes |
|
|
Dataset 3 (Framingham) |
Hypertension |
132.46 |
<0.0001 |
Yes |
|
Heart Disease |
38.48 |
<0.0001 |
Yes |
3.1.3 Logistic Regression and odds ratios
Logistic Regression is used as a quantitative measure to determine the independent variable and parameter, in this case the effect of each classified feature on stroke risk, while t-test, Chi-Square determines if the risk factor was associated with stroke. Age showed a strong association with stroke and was presented from the statistical analysis with obvious significance. Odds ratios (ORs) were greater than 1, which indicated that older people have a higher risk of stroke. In Dataset 1, hypertension had a significant effect with OR = 1.46, while in Dataset 2, heart disease had OR = 2.50. Dataset 3 showed significant ORs for hypertension and glucose level, where OR was 1.90 and 1.01, respectively. All those results are summarized in Table 6, representing the differences between the datasets.
Table 6. Logistic Regression odds ratios (ORs) and p-values
|
Dataset |
Feature |
OR |
p-Value |
|
Dataset 1 (Kaggle) |
Age |
1.07 |
4.36e–40 |
|
Hypertension |
1.46 |
0.02 |
|
|
heart_disease |
1.39 |
0.078 |
|
|
glucose_level |
1.00 |
0.002 |
|
|
Dataset 2 (Mendeley) |
Age |
2.06 |
2.49e–13 |
|
Hypertension |
1.61 |
0.008 |
|
|
heart_disease |
2.50 |
9.74e–11 |
|
|
glucose_level |
1.05 |
0.058 |
|
|
Dataset 3 (Framingham) |
Age |
1.06 |
7.12e–29 |
|
Hypertension |
1.90 |
4.51e–12 |
|
|
heart_disease |
1.27 |
0.413 |
|
|
glucose_level |
1.01 |
0.006 |
These ORs quantify the increased risk associated with specific clinical predictors; for instance, the OR of 2.50 for heart disease in Dataset 2 underscores a substantial increase in stroke risk, consistent with the identified statistical significance of these features in our Chi-Square analysis.
3.2 Machine learning model performance
The datasets exhibited a significant class imbalance, with stroke percentages of 4.87% (Kaggle), 7.86% (Mendeley), and 15.19% (Framingham). This will be explained in the next sections to explain the model performance using PCA and a confusion matrix, along with feature importance of each dataset.
3.2.1 Comparative statistical analysis
To quantify the clinical heterogeneity across our study cohorts, a comparative analysis of dataset composition and risk factor prevalence was conducted. As illustrated in Table 1, while the three datasets share similar sample sizes (ranging from 4,240 to 5,110), they differ significantly in feature dimensionality and stroke prevalence.
Despite this heterogeneity, Chi-square independence tests reveal that cardiovascular risk factors, specifically hypertension and heart disease, remain statistically significant (p < 0.05) across all three cohorts. This consistency suggests that, notwithstanding the variations in population-specific clinical definitions and data acquisition protocols, these vascular markers represent a robust, universal foundation for stroke risk assessment.
3.2.2 Principal Component Analysis and model performance
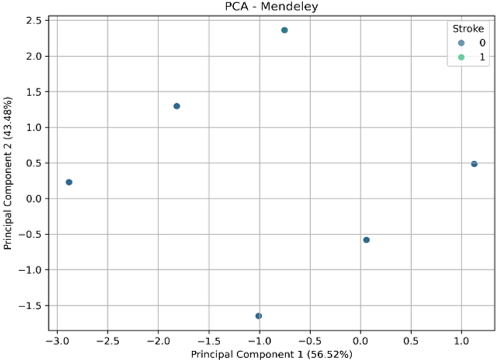
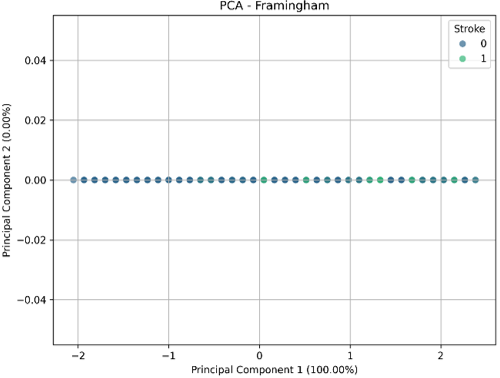
PCA was utilized to visualize the structural distribution of the datasets. The first two principal components account for cumulative variance of 63.17%, 100.00%, and 100.00% across our respective cohorts.
The PCA plots reveal distinct clustering morphologies: the Kaggle dataset displays a dense, multi-cluster distribution, whereas the Framingham cohort shows a linear projection (PC2 variance near 0%), indicating that a singular feature or dominant clinical marker accounts for the majority of its structural variation. This visual divergence highlights the underlying heterogeneity in data acquisition protocols, specifically that the Kaggle dataset contains a broader spectrum of physiological metrics compared to the more focused Framingham cardiovascular parameters. These structural differences explain why models trained on a specific dataset struggle to generalize across others, as the 'feature space' occupied by one dataset does not map cleanly onto the variance observed in another.
ROC_AUC was selected as the primary scoring metric for GridSearchCV. In medical datasets where the minority class (stroke) is critical, metrics like accuracy can be misleading, potentially yielding high scores by defaulting to the majority class. Conversely, ROC-AUC assesses the model's ability to rank samples across all classification thresholds, making it inherently robust against class imbalance. After optimization, the performance metrics reported in Table 7 represent the average results across the five independent test folds, and the best estimator from the pipeline was saved for subsequent analysis.
PCA plots illustrate that the stroke (1) and non-stroke (0) classes found in the data are not linearly separable in any of the three medical datasets, suggesting that simple linear models would be insufficient for accurate classification, as shown in Figure 2. The performance of each model, evaluated using 5-fold cross-validation, is summarized in Table 7.
Table 7. Summary of each model’s performance, evaluated using 5-fold cross-validation
|
Dataset |
Model |
Accuracy |
Precision |
Recall |
F1-Score |
AUC |
|
Dataset 1 (Kaggle) |
Logistic Regression |
0.75 |
0.14 |
0.78 |
0.23 |
0.84 |
|
Random Forest |
0.99 |
0.87 |
0.92 |
0.90 |
1.00 |
|
|
KNN |
0.84 |
0.23 |
0.97 |
0.37 |
0.97 |
|
|
SVM |
0.74 |
0.14 |
0.81 |
0.23 |
0.85 |
|
|
Dataset 2 (Mend-eley) |
Logistic Regression |
0.64 |
0.12 |
0.58 |
0.20 |
0.65 |
|
Random Forest |
0.64 |
0.12 |
0.58 |
0.20 |
0.65 |
|
|
KNN |
0.92 |
0.00 |
0.00 |
0.00 |
0.60 |
|
|
SVM |
0.64 |
0.12 |
0.58 |
0.20 |
0.62 |
|
|
Dataset 3 (Framingham) |
Logistic Regression |
0.63 |
0.23 |
0.62 |
0.34 |
0.68 |
|
Random Forest |
0.57 |
0.22 |
0.75 |
0.34 |
0.68 |
|
|
KNN |
0.74 |
0.19 |
0.23 |
0.21 |
0.57 |
|
|
SVM |
0.57
|
0.22
|
0.74
|
0.34
|
0.66
|
(a) Dataset 1 from Kaggle
(b) Dataset 2 from Mendeley
(c) Dataset 3 from Framingham
Figure 2. Principal Component Analysis (PCA) for all the datasets
To evaluate the efficacy of our class imbalance handling strategy, the optimized ImbPipeline results summarized in Table 7 were compared against baseline configurations (trained without SMOTE). The baseline results demonstrated that without synthetic over-sampling, models were consistently biased toward the majority class, resulting in near-zero recall. In contrast, the integration of SMOTE within our cross-validation pipeline, using the hyperparameter configurations detailed in Table 3, allowed for a statistically significant improvement in the detection of the minority stroke class.
3.2.3 Confusion matrix
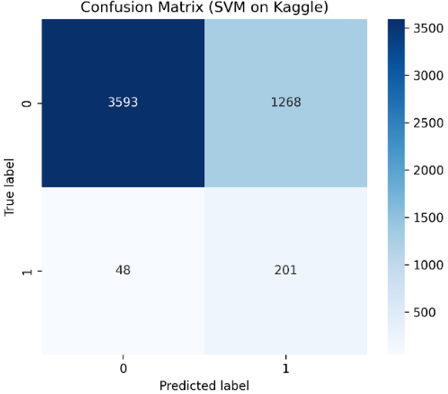
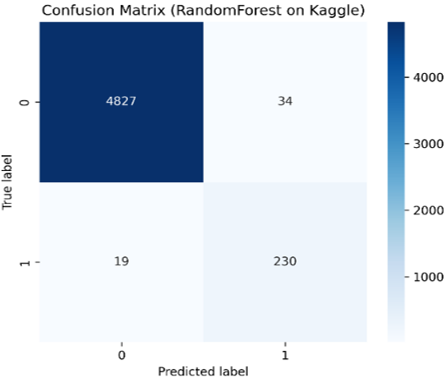
The confusion matrices provided a granular assessment of classification performance, particularly in managing the class imbalance inherent in the stroke datasets. Before the integration of SMOTE, baseline models (SVM, Logistic Regression, and KNN) exhibited a strong bias toward the majority class, often failing to detect the minority stroke cases. However, following the application of SMOTE within the cross-validation pipeline, these models demonstrated a marked improvement in sensitivity. As shown in Figure 3, the synthetic over-sampling enabled the classifiers to successfully identify positive stroke cases that were previously misclassified as non-stroke.
(a) Poor-performing SVM model on Kaggle
(b) Random Forest model's performance on the same dataset
Figure 3. Confusion matrix for Support Vector Machines (SVM) and Random Forest (RF) on the 1st dataset
The RF model consistently outperformed other classifiers across all three cohorts (Figure 4). Its confusion matrices (Figure 3) show a significant reduction in false negatives compared to the baseline, indicating high recall. For the Framingham dataset, the model achieved optimal classification performance with minimal misclassifications. These results confirm that the integration of SMOTE, coupled with the non-linear learning capacity of RF, effectively addresses the class imbalance and structural complexity of the medical data, as shown in Figures 3 and 4.
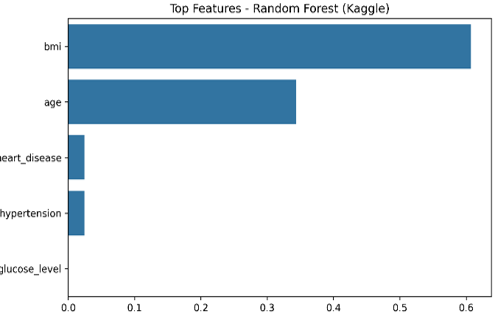
(a) Dataset 1 from Kaggle
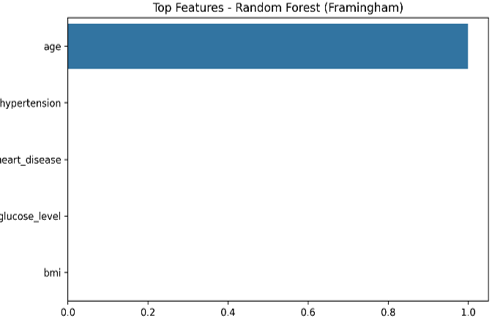
(b) Dataset 3 Framingham
(c) Dataset 2 from Mendeley
Figure 4. Random Forest feature importance plots for all three datasets
3.2.4 Feature importance
Analysis of feature importance from the RF models revealed that glucose level, BMI, and age were among the most important features for stroke prediction in the 1st and 3rd datasets. This feature importance profile was consistent and aligned with the statistical analysis. The 2nd dataset's feature importance was more distributed across a wide range of features, with lipids and dietary components showing high importance, reflecting the distinct data structure found in the data.
3.2.5 Cross-dataset generalization analysis
To rigorously evaluate model generalizability across heterogeneous data sources, a cross-dataset validation experiment was performed. Unlike standard K-fold cross-validation, which evaluates models within a single, consistent feature distribution, this approach involved training models on one source dataset and evaluating their performance on the others.
The resulting performance matrices, presented in Table 8 and Table 9, reveal the impact of clinical and demographic heterogeneity on predictive stability. While models maintained a baseline level of predictive power, the decrease in performance during cross-dataset testing highlights the challenges inherent in diverse patient cohorts.
Table 8. Cross-dataset validation (Area Under the Curve (AUC) scores)
|
Training Dataset |
Tested on Kaggle |
Tested on Mendeley |
Tested on Framingham |
|
Kaggle |
0.99 |
0.62 |
0.58 |
|
Mendeley |
0.60 |
0.64 |
0.55 |
|
Framingham |
0.55 |
0.52 |
0.68 |
Table 9. Summary of cross-dataset validation
|
Train_On |
Test_On |
F1_Score |
|
Kaggle |
Kaggle |
0.89 |
|
Kaggle |
Mendeley |
0.00 |
|
Kaggle |
Framingham |
0.24 |
|
Mendeley |
Kaggle |
0.00 |
|
Mendeley |
Mendeley |
0.00 |
|
Mendeley |
Framingham |
0.00 |
|
Framingham |
Kaggle |
0.00 |
|
Framingham |
Mendeley |
0.00 |
|
Framingham |
Framingham |
0.00 |
This variance underscores the necessity for cohort-specific model calibration, confirming that the heterogeneous clinical profiles identified in our statistical analysis (Tables 2–4) directly influence the models' ability to generalize. Consequently, this multi-source validation approach is essential for confirming the clinical applicability of stroke risk assessment tools.
The primary objective of this study was to evaluate the role of data heterogeneity in machine learning-based stroke risk prediction. Our results demonstrate that data from diverse sources, while addressing the same clinical problem, present unique statistical distributions and feature correlations with profound implications for predictive modeling.
Statistical analysis confirmed that well-established clinical risk factors, specifically age, hypertension, heart disease, and elevated glucose levels, are significantly associated with stroke across all three cohorts (Table 2 and Table 3). These findings, consistent with medical literature, provide a robust foundation for our machine learning analysis. The significant p-values and logistic regression ORs (Table 4) provide quantitative evidence of the magnitude of these relationships, confirming that as patients age or develop hypertension, stroke risk increases. Furthermore, while the use of synthetic datasets (e.g., Mendeley cohort) offers a platform for testing model robustness [28], our results underscore the necessity of validating these models against real-world benchmarks to ensure clinical utility [29].
4.1 Interpretation of clinical risk factors
Our machine learning framework, specifically the RF importance analysis, consistently identified age, blood glucose levels, and hypertension as the primary predictors of stroke risk across all cohorts. This result is strongly validated by our independent statistical evaluations; both the t-tests (for continuous variables like age and glucose) and Chi-Square tests (for binary indicators like hypertension) confirmed statistically significant differences (p < 0.05) between stroke and non-stroke populations. The convergence of these two distinct methodologies, machine learning feature ranking and univariate statistical testing (Tables 2–4), enhances the clinical reliability of our findings. Biologically, these features represent key facets of cardiovascular health: age reflects the cumulative effect of arterial degradation, while hypertension and glucose levels are direct drivers of vascular endothelial dysfunction and plaque instability.
4.2 Performance analysis and computational practicality
While our RF model performed well, simpler models like SVM and Logistic Regression initially struggled with predictive sensitivity. This is likely due to the severe class imbalance inherent in stroke datasets, a challenge well-documented in the literature. To address this, the impact of synthetic oversampling techniques was explained, specifically SMOTE [30-32]. Our results demonstrate that this integration significantly enhanced the sensitivity of the linear models, confirming that mitigating class skewness is a prerequisite for achieving reliable classification in heterogeneous clinical datasets.
In evaluating the practical utility of our proposed models, the computational requirements of our pipeline were assessed. As expected, non-linear ensemble methods, specifically RF, demonstrated higher training complexity and execution time compared to linear classifiers. This demonstrates that a single, powerful model can effectively generalize across heterogeneous data sources by dynamically weighting the most relevant features available [30]. However, this increased computational cost is marginal in the context of stroke risk prediction, where the priority is maximizing sensitivity to identify minority-class stroke cases. The trade-off favoring the superior F1-score and Recall of RF over the computational efficiency of Logistic Regression is both necessary and justified for clinical efficacy. This was justified given that these models are intended for clinical support and not high-frequency real-time processing.
4.3 Study limitations
While our study provides a framework for addressing data heterogeneity, it is subject to certain limitations. As detailed in the Methodology (Section 2.2), our use of the Framingham Ten-Year CHD variable as a proxy for stroke risk represents a surrogate endpoint. While clinically justified by the shared pathophysiology of cardiovascular and cerebrovascular diseases, future research should prioritize validation using direct stroke diagnostic codes to further refine predictive accuracy across diverse clinical datasets. Furthermore, future work should focus on developing models that are not only accurate but also inherently interpretable (e.g., using SHAP values), ensuring that predictions can be readily translated into actionable clinical decisions.
This study identifies data source heterogeneity as a primary barrier to developing generalized stroke risk prediction models. While clinical indicators, specifically age, glucose levels, and hypertension, remain consistent predictors across diverse cohorts, the efficacy of predictive modeling depends fundamentally on mitigating data-level limitations. The inability of linear classifiers, such as Logistic Regression and SVM, to overcome severe class imbalance underscores the necessity for more robust architectural approaches in medical machine learning.
The success of the RF pipeline, enhanced by SMOTE, demonstrates that architectural synergy is essential for addressing class skewness and structural data variance. By integrating advanced, non-linear ensemble methods with rigorous synthetic data enrichment, this framework effectively navigates the complexities of real-world medical datasets. Consequently, these findings validate a scalable and clinically viable strategy for stroke risk assessment, providing a pathway for reliable decision-support systems within heterogeneous healthcare environments.
[1] Soladoye, A.A., Aderinto, N., Popoola, M.R., Adeyanju, I.A., Osonuga, A., Olawade, D.B. (2025). Machine learning techniques for stroke prediction: A systematic review of algorithms, datasets, and regional gaps. International Journal of Medical Informatics, 203: 106041. https://doi.org/10.1016/j.ijmedinf.2025.106041
[2] The top 10 causes of death. (2024). World Health Organization. https://www.who.int/news-room/fact-sheets/detail/the-top-10-causes-of-death.
[3] Ahmad, M.A., Teredesai, A., Eckert, C. (2018). Interpretable machine learning in healthcare. In 2018 IEEE International Conference on Healthcare Informatics (ICHI), New York, NY, USA, p. 447. https://doi.org/10.1109/ICHI.2018.00095
[4] Heseltine-Carp, W., Courtman, M., Browning, D., et al. (2025). Machine learning to predict stroke risk from routine hospital data: A systematic review. International Journal of Medical Informatics, 196: 105811. https://doi.org/10.1016/j.ijmedinf.2025.105811
[5] Byna, A., Lakulu, M.M., Panessai, I.Y., Nurhaeni. (2024). Machine learning-based stroke prediction: A critical analysis. International Journal of Advanced Science, Engineering and Information Technology, 14(5): 1609-1618. https://doi.org/10.18517/ijaseit.14.5.19527
[6] Gao, C.H., Wang, H. (2024). Intelligent stroke disease prediction model using deep learning approaches. Stroke Research and Treatment, 2024: 4523388. https://doi.org/10.1155/2024/4523388
[7] Sun, Y.R., Ling, Y., Chen, Z.J., et al. (2022). Finding low CHA2DS2-VASc scores unreliable? Why not give morphological and hemodynamic methods a try? Frontiers in Cardiovascular Medicine, 9: 1032736. https://doi.org/10.3389/fcvm.2022.1032736
[8] Livingstone, S., Morales, D.R., Donnan, P.T., et al. (2021). Effect of competing mortality risks on predictive performance of the QRISK3 cardiovascular risk prediction tool in older people and those with comorbidity: External validation population cohort study. The Lancet Healthy Longevity, 2(6): e352-e361. https://doi.org/10.1016/s2666-7568(21)00088-x
[9] Li, Y., Sperrin, M., Martin, G.P., Ashcroft, D.M., van Staa, T.P. (2020). Examining the impact of data quality and completeness of electronic health records on predictions of patients' risks of cardiovascular disease. International Journal of Medical Informatics, 133: 104033. https://doi.org/10.1016/j.ijmedinf.2019.104033
[10] Short, S.A.P., Wilkinson, K., Hald, E., et al. (2025). Improving stroke risk prediction in atrial fibrillation with circulating biomarkers: The CHA2DS2-VASc-Biomarkers model. Journal of Thrombosis and Haemostasis, 23(10): 3160-3172. https://doi.org/10.1016/j.jtha.2025.06.007
[11] Mozhegova, E., Khattak, A.M., Khan, A., Garaev, R., Rasheed, B., Anwar, M.S. (2025). Assessing the adversarial robustness of multimodal medical AI systems: Insights into vulnerabilities and modality interactions. Frontiers in Medicine (Lausanne), 12: 1606238. https://doi.org/10.3389/fmed.2025.1606238
[12] Kelly, C.J., Karthikesalingam, A., Suleyman, M., Corrado, G., King, D. (2019). Key challenges for delivering clinical impact with artificial intelligence. BMC Medicine, 17(1): 195. https://doi.org/10.1186/s12916-019-1426-2
[13] Futoma, J., Simons, M., Panch, T., Doshi-Velez, F., Celi, L.A. (2020). The myth of generalisability in clinical research and machine learning in health care. The Lancet Digital Health, 2(9): e489-e492. https://doi.org/10.1016/s2589-7500(20)30186-2
[14] You, C. (2026). Towards robust, reliable, and generalized medical AI. Proceedings of the AAAI Conference on Artificial Intelligence, 40(47): 39846-39846. https://doi.org/10.1609/aaai.v40i47.41363
[15] Yang, Y.Z., Zhang, H.R., Gichoya, J.W., Katabi, D., Ghassemi, M. (2024). The limits of fair medical imaging AI in real-world generalization. Nature Medicine, 30: 2838-2848. https://doi.org/10.1038/s41591-024-03113-4
[16] Wang, J.C., Gu, H.W., Gu, H. (2023). Optimizing stroke prediction in machine learning by addressing data imbalance. In 2023 3rd International Signal Processing, Communications and Engineering Management Conference (ISPCEM), Montreal, QC, Canada, pp. 665-669. https://doi.org/10.1109/ISPCEM60569.2023.00125
[17] Divya, P., Ajmal Ahamed, R., Duraiarasi, S., Jaisuriya, N., Jayashree, A. (2025). Stroke prediction using machine learning. International Journal of Innovative Science and Research Technology, 10(2): 1040-1045. https://doi.org/10.5281/zenodo.14944955
[18] Framingham heart study dataset. (2022). Kaggle. https://www.kaggle.com/datasets/aasheesh200/framingham-heart-study-dataset.
[19] Wang, P. (2024). Imbalanced data-based prediction and risk factor analysis of stroke. Mendeley Data. https://doi.org/10.17632/xggs239bnw.1
[20] Uddin, M.B. (2025). Synthetic stroke prediction dataset. Mendeley Data, 1. https://doi.org/10.17632/s2nh6fm925.1
[21] Waseem, H.M., Islam, S.U., Matragkas, N., Epiphaniou, G., Arvanitis, T.N., Maple, C. (2026). Review of generative AI for synthetic data generation: A healthcare perspective. Artificial Intelligence Review, 59: 55. https://doi.org/10.1007/s10462-025-11440-2
[22] Zhou, Y., Ghosh, S., Xie, M.K.Y., et al. (2026). Robust cross-domain generalization using unlabeled target data with source-domain supervision. Computers in Biology and Medicine, 213: 111788. https://doi.org/10.1016/j.compbiomed.2026.111788
[23] Remyes, D., Nasef, D., Remyes, S., et al. (2025). Clinical applicability and cross-dataset validation of machine learning models for binary glaucoma detection. Information, 16: 432. https://doi.org/10.3390/info16060432
[24] Abdi, H., Williams, L.J. (2010). Principal component analysis. WIREs Computational Statistics, 2(4): 433-459. https://doi.org/10.1002/wics.101
[25] Lever, J., Krzywinski, M., Altman, N. (2017). Principal component analysis. Nature Methods, 14(7): 641-642. https://doi.org/10.1038/nmeth.4346
[26] Adadi, A., Berrada, M. (2018). Peeking inside the black-box: A survey on explainable artificial intelligence (XAI). IEEE Access, 6: 52138-52160. https://doi.org/10.1109/ACCESS.2018.2870052
[27] Lundberg, S., Lee, S.I. (2017). A unified approach to interpreting model predictions. In Proceedings of the 31st International Conference on Neural Information Processing Systems, Long Beach, California, USA, pp. 4768-4777.
[28] Choi, E., Biswal, S., Malin, B., Duke, J., Stewart, W.F., Sun, J.M. (2017). Generating multi-label discrete patient records using generative adversarial networks. In Proceedings of the 2nd Machine Learning for Healthcare Conference, Proceedings of Machine Learning Research, pp. 286-305.
[29] Rankin, D., Black, M., Bond, R., Wallace, J., Mulvenna, M., Epelde, G. (2020). Reliability of supervised machine learning using synthetic data in health care: Model to preserve privacy for data sharing. JMIR Medical Informatics, 8(7): e18910. https://doi.org/10.2196/18910
[30] Ribeiro, M., Singh, S., Guestrin, C. (2016). Why should I trust you? Explaining the predictions of any classifier. In Proceedings of the 2016 Conference of the North American Chapter of the Association for Computational Linguistics, California, USA, pp. 97-101. https://doi.org/10.18653/v1/N16-3020
[31] He, H.B., Garcia, E.A. (2009). Learning from imbalanced data. IEEE Transactions on Knowledge and Data Engineering, 21(9): 1263-1284. https://doi.org/10.1109/TKDE.2008.239
[32] Chawla, N.V., Bowyer, K.W., Hall, L.O., Kegelmeyer, W.P. (2002). SMOTE: Synthetic minority over-sampling technique. Journal of Artificial Intelligence Research, 16(1): 321-357.