Aseel Jasim Mohammed Abdulhasan*![]() | Riyadh Hamad Mohammed Muttaleb
| Riyadh Hamad Mohammed Muttaleb![]()
© 2026 The authors. This article is published by IIETA and is licensed under the CC BY 4.0 license (http://creativecommons.org/licenses/by/4.0/).
OPEN ACCESS
Climate change is a significant problem facing the world nowadays. Therefore, this study investigates the influence of climate change on water temperature in Al-Hindiya Barrage, Euphrates River, Iraq, focusing on data collected from 1994 to 2024. Using satellite imagery from Landsat Collection 2 Level 2 land surface temperature (LST) products, including Landsat 4–5 and Landsat 8–9, the research analyzes temperature variations over the past three decades, with a particular focus on monthly changes. ArcGIS was used to analyse and extract water temperature data for the Hindiya Barrage. Afterward, SPSS has been used to analyse and identify missing data. The results reveal significant seasonal and annual variation, with a clear trend toward higher temperatures during the summer. The highest recorded monthly water temperature was 45.8 ℃ in August 2023, while the lowest recorded monthly temperature was 4.1 ℃ in December 1995. The highest mean monthly water temperature was 40.8 ℃ in August 2023, while the lowest mean monthly temperature was 7 ℃ in December 2000, indicating a wide temperature range exceeding 38 ℃ during the study period. Analysis of high-resolution thermal data for 2024 confirmed the continued rise in temperatures during the summer, with average water temperatures peaking at 40.2 ℃ in July. Higher summer water temperatures contribute to decreased dissolved oxygen levels, which can severely impact fish populations and other aquatic organisms, and can also lead to increased evaporation rates and decreased precipitation. Therefore, this study demonstrates that satellite images can be used to estimate water surface temperature.
climate change, water temperature, Landsat 4-5, Landsat 8-9, SPSS, Al-Hindiya Barrage
Climate change is one of the most serious environmental challenges affecting arid and semi-arid regions worldwide. Iraq, similar to other arid regions, is experiencing the issue of rising temperatures [1]. Global warming represents one of the most significant challenges currently confronting humanity. The average air temperature has increased over the past few decades at a rate faster than any previously recorded since the inception of automated measurements [2]. The Fifth Assessment Report of the Intergovernmental Panel on Climate Change [2] stated that the global average temperature rose by 0.65 to 1.06 ℃ between 1880 and 2012. Water temperature is a key physical characteristic of aquatic systems. When water warms, the rates of chemical and biological processes increase. As the temperature of water rises, the amount of gas that can dissolve in it decreases. On the other hand, the amount of minerals that may dissolve in it increases. An increase in water temperature can impair water quality as it reduces the capacity for oxygen dissolution and may also result in a decrease in water resources [3]. It influences several water quality parameters that are significant for domestic, environmental, industrial, and agricultural purposes [4]. When water temperatures rise, the amount of dissolved oxygen decreases, which can have a big impact on the whole aquatic ecology [5]. It influences several water excellence parameters that are significant for domestic, environmental, industrial, and agricultural purposes [4]. Multiple studies indicate that water temperature is inversely linked to river discharge, suggesting a reduced thermal capacity as flow volumes decline [6]. Climate change has altered the hydrological cycle in recent decades, which presents a significant risk to water resources. Climate change can either diminish the water supply or elevate water levels, contingent upon precipitation levels [7]. One of the most significantly affected domains is hydrology and water resources. For instance, any alterations in temperature and precipitation will directly impact both the quantity and quality of runoff; additionally, they will also influence evapotranspiration [8]. Discharge rates are closely linked to the amount of rain that falls, which has a strong influence on water quality and the amount of dissolved salts. When the temperature rises, the rate of evaporation also rises, which causes the total dissolved solids (TDS) in the water to rise as well [1, 9, 10]. So, higher temperatures will speed up the rate of evaporation. These changes will raise the amount of salt, which will make the water quality worse [11]. The salinity of the Euphrates River is rising because of climate change, poor planning and management, and old irrigation systems [12, 13]. The flow rates often drop at the same time as the river's flow slows down. This process raises the levels of pollutants and salt [14, 15]. There are several things that might cause water pollution in the Euphrates basin, for example, rock weathering, rain, the way water and soil interact, and effluent that comes from people doing things. As a result, these factors are negatively impacting the region's economy and agricultural practices [14, 16]. The heightened scouring and sedimentation upstream of the Al-Hindiya Barrage can diminish the reservoir's capacity, which can be ascribed to water scarcity, resulting in a diminished river cross-section. This reduction has led to an enhanced flow velocity and a consequent decline in discharge [17]. In addition to climatic and hydrological factors, human regulation plays an essential part in shaping the thermal regime of rivers. Dams built in Turkey and Syria have markedly diminished the river's flow regime [1, 18, 19]. The Euphrates River has consistently exhibited a decline in water quality [16]. Recent years have shown that the deterioration of the river's water quality is accelerating. The decline is attributed to geological constructions, land administration practices, agricultural irrigation and drainage, and the effects of climate change [16, 20]. Monitoring river water temperature over long periods is vital for understanding the influences of climate change and supporting the sustainable administration of water resources. While traditional field measurements are accurate, they are often limited in spatial coverage and lack temporal continuity. In recent decades, remote sensing technologies, particularly infrared thermal observations from Landsat satellites, have emerged as effective tools for monitoring water surface temperature with consistent spatial and temporal coverage. Landsat products enable retrospective analyses of thermal trends over several decades, providing valuable insights into long-term changes in river systems. Despite the strategic importance of the Euphrates River, comprehensive long-term evaluations of its surface water temperature dynamics remain limited, particularly in the lower Euphrates region. Previous studies have largely focused on water quantity and quality, while the river's thermal regime and its response to intervening climatic and hydrological pressures have received relatively less attention. This knowledge gap is especially significant given the river's high environmental sensitivity and its pivotal role in regional water security. Accordingly, this study aims to determine long-term trends in the Euphrates River's surface water temperature at the Hindiya Barrage during the period 1994–2024.
2.1 Study area and satellite data
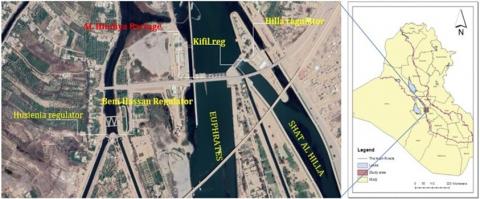
The Al-Hindiya Barrage is located on the Euphrates River, Iraq, dividing it into two branches: the Shat Al-Hila and the Shat Al-Hindiya [21]. Al-Hindiya Barrage plays a crucial role in allocating river water among stakeholders downstream, distributing the flow of the Euphrates River across four branches. The largest of these is the chief canal of the Euphrates, which flows toward southern Iraq. The second branch, the Shatt Al-Hillah, diverts water toward the Babylon Governorate. The remaining two branches are the Musiab Canal, utilized for irrigating agricultural land of the Musiab Project, and the Hussianiah Canal, which serves to irrigate the agricultural areas of Karbala Governorate [10]. The Hindiya Barrage facilitates the flow of water from the Al-Hillah River and the Hindiya River during the summer season. The new Al-Hindiya Barrage is located approximately 1.700 km upstream from the old Al-Hindiya Barrage, providing irrigation to 500,000 hectares of agricultural land. This includes 420,000 hectares in the Shat Alhila area, 25,000 hectares in the Kifl Canal, 30,000 hectares in the Bani Hassan Canal, and 25,000 hectares in the Hussienia Canal [17]. The area of Saddat Al-Hindiya is 202.083738 square kilometers. The weather of the research area is characterized as subtropical semi-arid, which is marked by high temperatures in summer and lower temperatures in winter. It is one of the largest irrigation projects in Iraq and is recognized as the oldest irrigation project still in operation today. It has recently been included in the World Heritage Register for its cultural and historical significance in Iraq. Coordinates of the research area are 32°47′20″ N-32°40′14″ N-32°40′17″ N-32°47′24″ N latitude to 044°11′53″ E-044°11′57″ E-044°21′48″ E-044°21′45″ E longitude, as shown in Figure 1.
(a) (b)
Figure 1. (a) Google Maps view of Al-Hindiya Barrage, (b) Spatial distribution map illustrating the position of the study area within Babil Governorate, Iraq
Multispectral remote sensing images using observations from Landsat 4-5 and 8-9 satellites. The band descriptions for Landsat 4-5 and Landsat 8-9 are as indicated in Tables 1 and 2 [22]. We utilized Level 2-SP satellite data [23] over the Al-Hindiya Barrage during the specified period (daytime, Path/Row 168/37 and 169/37) for this study. The data was downloaded from the USGS website with a spatial resolution of 30 meters. All data were reprojected to the Universal Transverse Mercator (UTM) coordinate system, datum WGS84, zone 38. The data were collected and analysed using ArcGIS software (ArcMap) version 10.8. The United States Geological Survey (USGS) has processed all archived Landsat 4 and 5 (Thematic Mapper (TM)), Landsat 7 (Enhanced Thematic Mapper Plus (ETM+)), Landsat 8 (Operational Land Imager (OLI)), and thermal infrared sensor (TIRS) data, converting them into Analysis Ready data (ARD). This ARD data significantly reduces the preprocessing burden on Landsat data users. The availability of ARD data is intended to facilitate the production of land cover and change maps, as well as other derived geophysical and biophysical products, using Landsat data. ARD data is presented as segmented, georeferenced, elevation-corrected, and iso-area projection maps, accompanied by clear spatial quality assessment information and suitable metadata to enable further processing while maintaining data source traceability [24, 25].
Table 1. Landsat 4-5 band reference table [23]
|
Band Reference Number |
Band Description |
Band Range (nm) |
|
1 |
Blue |
450-520 |
|
2 |
Green |
520-600 |
|
3 |
Red |
630-690 |
|
4 |
Near-Infrared (NIR) |
760-900 |
|
5 |
Short Wavelength Infrared (SWIR) 1 |
1550-1750 |
|
6 |
Thermal Infrared |
10400-12500 |
|
7 |
SWIR 2 |
2080-2350 |
Table 2. Landsat 8-9 band reference table [26]
|
Band Reference Number |
Band Description |
Band Range (nm) |
|
1 |
Coastal Aerosol (Operational Land Imager (OLI)) |
435-451 |
|
2 |
Blue (OLI) |
452-512 |
|
3 |
Green (OLI) |
533-590 |
|
4 |
Red (OLI) |
636-673 |
|
5 |
Near-Infrared (NIR) (OLI) |
851-879 |
|
6 |
Short Wavelength Infrared (SWIR) 1 (OLI) |
1566-1651 |
|
7 |
SWIR 2 (OLI) |
2107-2294 |
|
10 |
Thermal Infrared Sensor (TIRS) 1 |
10600-11190 |
2.2 Land surface temperature retrieval process
The interpretation of water temperature involved cropping the study area using a shapefile and using the MNDWI index (Eq. (1)) to find the water surface mask.
MNDWI = (Green − SWIR) / (Green + SWIR) (1)
The MNDWI index effectively improves water surface information while minimizing the impact of buildings, vegetation, and soil properties. It is one of the most commonly utilized water parameters for mapping surface water and analysing its changes. A threshold value of MNDWI > 0, where pixels with positive MNDWI values were classified as water, offers simple, practical, and efficient calculations [27]. The above steps were performed using ArcGIS software. In this research, second-level ST products, a portion of the Landsat ARD group, were used. The work steps were as follows: downloading satellite images from Landsat 4-5 and Landsat 8-9 satellites, creating a shapefile of the study area using ArcGIS software, and creating a mosaic of some satellite images within ArcGIS because the study area was not fully visible. After using equations and cropping the study area from the satellite images, surface temperatures were obtained. These 30-meter ARD products are atmospherically improved, segmented, geometrically corrected, and defined in an iso-area projection. The ARD ST products were determined utilizing a single-channel algorithm developed by Cook et al. [28]. In the Collection 2 Level 2 dataset for Landsat 8/9, land surface temperature (LST) is calculated using the single-channel method based on thermal Band 10 (ST-B10). As shown in Table 3, Band 11, another thermal band, is omitted from the LST computation [29]. The same approach has been used in Collection 2 and Level 2 related to Landsat 4/5 for calculating LST, but using thermal band 6 (ST-B6) as shown in Table 4 (https://www.usgs.gov/media/files/landsat-4-5-tm-collection-2-level-2-data-format-control-book). Particular pictures signified surface temperature in Kelvin after applying Landsat-defined transformation parameters [25].
Table 3. TIRS ST band specifications [26]
|
Identifier FT |
Units |
Range |
Fill Value |
|
ST_B10 |
Scaled Kelvin |
1 through 65535 |
0 (No Data) |
Table 4. TM ST band specifications [23]
|
Band Number |
Identifier FT |
Units |
Range |
Fill Value |
|
6 |
ST_B6 |
Scaled Kelvin |
through 65535 |
0 (No Data) |
K = DN × 0.00341802 + 149 (2)
where, k: surface temperature, DN: scaled surface temperature value (ST-10 or ST-B6).
The image values were then changed to Celsius:
℃ = K − 273.1 (3)
2.3 Time series data processing
Monthly water surface temperature time series were generated by extracting spatial temperature statistics from Landsat-derived surface temperature images in ArcGIS. For each month, the minimum and maximum LST values were extracted from all valid water pixels in the reservoir Region of Interest (ROI). These values represent the spatial range of water surface temperature conditions across the reservoir.
Due to data gaps caused by cloud cover and missing observations, some months lacked either minimum or maximum temperature values. Therefore, a gap-filling procedure was required prior to the calculation of representative monthly temperature metrics. Following the reconstruction of missing values, the average monthly water surface temperature was calculated as the arithmetic mean of the monthly minimum and maximum LST values.
2.4 Missing data handling and quality control
Missing monthly water surface temperature values were addressed using temporal interpolation based on the monthly time series. Specifically, linear interpolation was applied between adjacent months to estimate missing values, assuming a gradual temporal variation in reservoir water temperature. The interpolation procedure was implemented using SPSS software (Version 26).
This interpolation approach was selected because water temperature typically exhibits smooth seasonal transitions rather than abrupt month-to-month fluctuations. By relying on neighboring temporal observations, the method preserves the overall seasonal pattern and long-term trend of the time series.
It is acknowledged that temporal interpolation may slightly reduce short-term variability; however, given the limited number of missing observations, its influence on the overall trend analysis is considered minimal. All interpolated values were used exclusively to ensure time-series continuity and were not treated as independent observations in the interpretation of results.
The continual increase in water abstractions from upstream countries has made the downstream regions of the Euphrates River in Iraq more susceptible to the impacts of climate change [9]. Water temperature is a critical parameter in ecosystem studies [6]. Temperature can influence both chemical and biological processes, for example, dissolved oxygen concentrations, fish growth, and even mortality. Numerous biological conditions are associated with the thermal regime of rivers [30]. Water temperature is a critical variable, as it affects mixing in a waterbody, affects habitat suitability for flora and fauna, and serves as an indicator of the overall health of streams and waterbodies [31].
In this study, ArcGIS software was employed to investigate the spatiotemporal variations in water temperature at the Al-Hindiya Barrage on the Euphrates River under the influence of climate change. The results are summarized as follows:
3.1 Monthly water temperature
3.1.1 Monthly minimum water temperature
The highest recorded monthly minimum water temperature was 35.5 ℃ in July 2015, while the lowest was 4.1 ℃ in January 2015 (Table 5 and Table 6).
Table 5. Minimum Monthly Water Temperature (℃) at Al-Hindiya Barrage, derived from ArcGIS data, 1994–2024
|
Year |
Jan |
Feb |
Mar |
Apr |
May |
Jun |
Jul |
Aug |
Sep |
Oct |
Nov |
Dec |
|
1994 |
|
|
|
18.2 |
23.5 |
26.3 |
26.8 |
25.5 |
26.5 |
23.3 |
10.9 |
|
|
1995 |
10.4 |
|
|
21.7 |
25.3 |
26.3 |
27.9 |
26.1 |
26.1 |
17.7 |
20.3 |
4.9 |
|
1996 |
8.3 |
|
|
|
34.4 |
26.8 |
28.7 |
28.9 |
28.1 |
23.2 |
17.8 |
11.7 |
|
1997 |
13.1 |
8.9 |
14.4 |
|
26 |
28.5 |
26.2 |
27.5 |
23.6 |
24.4 |
17.8 |
|
|
1998 |
7.7 |
10.9 |
14.7 |
21.1 |
24.5 |
28.9 |
28.1 |
29.8 |
27.3 |
23.8 |
19.9 |
10.4 |
|
1999 |
11.2 |
13.9 |
16.1 |
20.6 |
25.4 |
27.1 |
27.7 |
|
29.1 |
23.9 |
17.5 |
|
|
2000 |
7.8 |
13 |
13.9 |
20.4 |
24.5 |
29.1 |
30.1 |
29.6 |
28.1 |
24.9 |
18.5 |
5.1 |
|
2001 |
8.7 |
|
18.1 |
22.2 |
27.7 |
|
29.7 |
38.6 |
27.8 |
25.4 |
18.6 |
10.9 |
|
2002 |
8.2 |
11.5 |
15.4 |
21.6 |
27.9 |
30 |
31 |
28.9 |
29.4 |
25.9 |
17 |
|
|
2003 |
9.3 |
|
15.7 |
24.5 |
28.9 |
|
|
|
|
|
|
|
|
2004 |
|
|
15.5 |
|
23.8 |
27.9 |
25.7 |
25.8 |
30.1 |
|
|
28.3 |
|
2005 |
9 |
6.3 |
14.5 |
17.2 |
27.6 |
24.8 |
28.9 |
30.7 |
27.1 |
26.7 |
11,6 |
|
|
2006 |
|
12.8 |
|
19.5 |
27.7 |
29.5 |
28.2 |
30.7 |
27.5 |
22.5 |
11.1 |
8.9 |
|
2007 |
8.8 |
|
|
21.8 |
11.1 |
28.1 |
28.7 |
29.9 |
28.5 |
|
|
|
|
2008 |
|
|
18.1 |
21.5 |
|
29.4 |
29.3 |
28.7 |
|
18.3 |
15.9 |
11 |
|
2009 |
|
7.1 |
17.1 |
17.6 |
29.9 |
|
|
|
29.8 |
25.3 |
18.2 |
|
|
2010 |
|
14.1 |
|
23.6 |
29.2 |
|
31.9 |
30.4 |
|
22.9 |
17.3 |
14.2 |
|
2011 |
8.8 |
14.9 |
14.9 |
20.5 |
29.1 |
|
31 |
|
25.8 |
|
|
|
|
2012 |
|
|
|
|
|
|
|
|
|
|
|
|
|
2013 |
|
|
|
23.6 |
29 |
31.8 |
32.6 |
32.9 |
28.3 |
24.3 |
12.9 |
6.3 |
|
2014 |
8.7 |
7.5 |
19.1 |
26.1 |
30 |
30.7 |
31.2 |
32.3 |
32.5 |
27.2 |
17.2 |
|
|
2015 |
4.1 |
13.9 |
20.1 |
25.2 |
29.6 |
31.1 |
35.5 |
34.9 |
20.2 |
28.7 |
8.2 |
15.8 |
|
2016 |
11 |
8.5 |
19.3 |
25.9 |
28.8 |
34.5 |
33.2 |
33.9 |
19.7 |
24.8 |
20.1 |
9.9 |
|
2017 |
8.8 |
13.5 |
19.8 |
23.9 |
28.9 |
31.6 |
31.2 |
33.6 |
30.8 |
23.9 |
17.4 |
13.5 |
|
2018 |
11.3 |
|
20.5 |
26.8 |
|
30.6 |
35.1 |
32.9 |
34.7 |
19 |
16.7 |
13.9 |
|
2019 |
9.3 |
15.8 |
18.4 |
22.9 |
32.6 |
34.2 |
31.9 |
32.8 |
31.6 |
28.2 |
20.5 |
|
|
2020 |
13.4 |
13.2 |
18.1 |
10.5 |
28 |
32.8 |
34.5 |
33 |
32.3 |
26.9 |
18.9 |
13.9 |
|
2021 |
11.7 |
17.6 |
9.1 |
22.3 |
31.6 |
34.1 |
34.9 |
35.4 |
32.1 |
24.9 |
17.3 |
13.5 |
|
2022 |
14.1 |
15.6 |
17.3 |
22.9 |
27.9 |
35 |
30.2 |
|
33.9 |
26.9 |
21.3 |
11.9 |
|
2023 |
12.1 |
12.9 |
20.3 |
26.1 |
30.5 |
33.4 |
31.6 |
35.8 |
31.4 |
27 |
21.2 |
16.5 |
|
2024 |
15.1 |
14.7 |
18.8 |
26.6 |
32.4 |
33.6 |
35 |
34.3 |
31.1 |
27.7 |
20.6 |
13.7 |
Table 6. Missing values of the minimum monthly water temperature at Al-Hindiya Barrage, identified using SPSS
|
Year |
Jan |
Feb |
Mar |
Apr |
May |
Jun |
Jul |
Aug |
Sep |
Oct |
Nov |
Dec |
|
1994 |
10 |
12.3 |
16.9 |
18.2 |
23.5 |
26.3 |
26.8 |
25.5 |
26.5 |
23.3 |
10.9 |
12.3 |
|
1995 |
10.4 |
12.3 |
16.9 |
21.7 |
25.3 |
26.3 |
27.9 |
26.1 |
26.1 |
17.7 |
20.3 |
4.9 |
|
1996 |
8.3 |
12.3 |
16.9 |
22 |
34.4 |
26.8 |
28.7 |
28.9 |
28.1 |
23.2 |
17.8 |
11.7 |
|
1997 |
13.1 |
8.9 |
14.4 |
22 |
26 |
28.5 |
26.2 |
27.5 |
23.6 |
24.4 |
17.8 |
12.3 |
|
1998 |
7.7 |
10.9 |
14.7 |
21.1 |
24.5 |
28.9 |
28.1 |
29.8 |
27.3 |
23.8 |
19.9 |
10.4 |
|
1999 |
11.2 |
13.9 |
16.1 |
20.6 |
25.4 |
27.1 |
27.7 |
31.3 |
29.1 |
23.9 |
17.5 |
12.3 |
|
2000 |
7.8 |
13 |
13.9 |
20.4 |
24.5 |
29.1 |
30.1 |
29.6 |
28.1 |
24.9 |
18.5 |
5.1 |
|
2001 |
8.7 |
12.3 |
18.1 |
22.2 |
27.7 |
30.2 |
29.7 |
38.6 |
27.8 |
25.4 |
18.6 |
10.9 |
|
2002 |
8.2 |
11.5 |
15.4 |
21.6 |
27.9 |
30 |
31 |
28.9 |
29.4 |
25.9 |
17 |
12.3 |
|
2003 |
9.3 |
12.3 |
15.7 |
24.5 |
28.9 |
30.2 |
30.6 |
31.3 |
28.6 |
24.5 |
21.1 |
12.3 |
|
2004 |
10 |
12.3 |
15.5 |
22 |
23.8 |
27.9 |
25.7 |
25.8 |
30.1 |
24.5 |
21.1 |
28.3 |
|
2005 |
9 |
6.3 |
14.5 |
17.2 |
27.6 |
24.8 |
28.9 |
30.7 |
27.1 |
26.7 |
11,6 |
12.3 |
|
2006 |
10 |
12.8 |
16.9 |
19.5 |
27.7 |
29.5 |
28.2 |
30.7 |
27.5 |
22.5 |
11.1 |
8.9 |
|
2007 |
8.8 |
12.3 |
16.9 |
21.8 |
11.1 |
28.1 |
28.7 |
29.9 |
28.5 |
24.5 |
21.1 |
12.3 |
|
2008 |
10 |
12.3 |
18.1 |
21.5 |
27.7 |
29.4 |
29.3 |
28.7 |
28.6 |
18.3 |
15.9 |
11 |
|
2009 |
10 |
7.1 |
17.1 |
17.6 |
29.9 |
30.2 |
30.6 |
31.3 |
29.8 |
25.3 |
18.2 |
12.3 |
|
2010 |
10 |
14.1 |
16.9 |
23.6 |
29.2 |
30.2 |
31.9 |
30.4 |
28.6 |
22.9 |
17.3 |
14.2 |
|
2011 |
8.8 |
14.9 |
14.9 |
20.5 |
29.1 |
30.2 |
31 |
31.3 |
25.8 |
24.5 |
21.1 |
12.3 |
|
2012 |
10 |
12.3 |
16.9 |
22 |
27.7 |
30.2 |
30.6 |
31.3 |
28.6 |
24.5 |
21.1 |
12.3 |
|
2013 |
10 |
12.3 |
16.9 |
23.6 |
29 |
31.8 |
32.6 |
32.9 |
28.3 |
24.3 |
12.9 |
6.3 |
|
2014 |
8.7 |
7.5 |
19.1 |
26.1 |
30 |
30.7 |
31.2 |
32.3 |
32.5 |
27.2 |
17.2 |
12.3 |
|
2015 |
4.1 |
13.9 |
20.1 |
25.2 |
29.6 |
31.1 |
35.5 |
34.9 |
20.2 |
28.7 |
8.2 |
15.8 |
|
2016 |
11 |
8.5 |
19.3 |
25.9 |
28.8 |
34.5 |
33.2 |
33.9 |
19.7 |
24.8 |
20.1 |
9.9 |
|
2017 |
8.8 |
13.5 |
19.8 |
23.9 |
28.9 |
31.6 |
31.2 |
33.6 |
30.8 |
23.9 |
17.4 |
13.5 |
|
2018 |
11.3 |
12.3 |
20.5 |
26.8 |
27.7 |
30.6 |
35.1 |
32.9 |
34.7 |
19 |
16.7 |
13.9 |
|
2019 |
9.3 |
15.8 |
18.4 |
22.9 |
32.6 |
34.2 |
31.9 |
32.8 |
31.6 |
28.2 |
20.5 |
12.3 |
|
2020 |
13.4 |
13.2 |
18.1 |
10.5 |
28 |
32.8 |
34.5 |
33 |
32.3 |
26.9 |
18.9 |
13.9 |
|
2021 |
11.7 |
17.6 |
9.1 |
22.3 |
31.6 |
34.1 |
34.9 |
35.4 |
32.1 |
24.9 |
17.3 |
13.5 |
|
2022 |
14.1 |
15.6 |
17.3 |
22.9 |
27.9 |
35 |
30.2 |
31.3 |
33.9 |
26.9 |
21.3 |
11.9 |
|
2023 |
12.1 |
12.9 |
20.3 |
26.1 |
30.5 |
33.4 |
31.6 |
35.8 |
31.4 |
27 |
21.2 |
16.5 |
|
2024 |
15.1 |
14.7 |
18.8 |
26.6 |
32.4 |
33.6 |
35 |
34.3 |
31.1 |
27.7 |
20.6 |
13.7 |
3.1.2 Monthly maximum water temperature
The maximum monthly recorded water temperature was 45.8 °C in August 2023, whereas the lowest was 5 ℃ in December 2006 (Table 7 and Table 8).
Table 7. Maximum monthly water temperature (℃) at Al-Hindiya Barrage, derived from ArcGIS data
|
Year |
Jan |
Feb |
Mar |
Apr |
May |
Jun |
Jul |
Aug |
Sep |
Oct |
Nov |
Dec |
|
1994 |
|
|
|
22.4 |
31.5 |
34.1 |
34.7 |
32.7 |
33.7 |
29.5 |
18.5 |
|
|
1995 |
14.2 |
|
|
27.5 |
33.1 |
34.4 |
34.5 |
33.2 |
32.5 |
21.9 |
16.5 |
9.3 |
|
1996 |
10.8 |
|
|
|
25.3 |
35 |
37.8 |
36.9 |
34.9 |
27.5 |
21.6 |
14.5 |
|
1997 |
16.9 |
12 |
21.2 |
|
35.2 |
35 |
34.2 |
35.3 |
33.5 |
30.4 |
21.9 |
|
|
1998 |
10.6 |
10.1 |
20.6 |
31.2 |
32.7 |
39.9 |
35.4 |
39.3 |
34.8 |
29.5 |
23.5 |
14.9 |
|
1999 |
14.9 |
18.8 |
23.8 |
30.6 |
34.9 |
34.3 |
36 |
|
35.9 |
29.5 |
21.4 |
|
|
2000 |
11.8 |
17.7 |
21.1 |
29.2 |
31.1 |
36.6 |
41.9 |
39.4 |
36.6 |
32.2 |
22.6 |
7.1 |
|
2001 |
12.9 |
|
24.6 |
27.5 |
37.7 |
|
39.3 |
29.8 |
35.2 |
32.1 |
21.9 |
14.1 |
|
2002 |
11.4 |
15.9 |
20.2 |
27.5 |
34.3 |
39.7 |
41 |
39.1 |
36.9 |
32.3 |
21.2 |
|
|
2003 |
14.1 |
|
22.6 |
30.5 |
38.1 |
|
|
|
|
|
|
|
|
2004 |
|
|
21.4 |
|
33.6 |
35.6 |
36.2 |
33.6 |
38.9 |
|
|
12.1 |
|
2005 |
13.1 |
10.7 |
18.7 |
23.9 |
35.4 |
34.3 |
36.3 |
38.2 |
33.4 |
31.5 |
16.5 |
|
|
2006 |
|
15.6 |
|
28.1 |
37.7 |
39.6 |
36.1 |
40.2 |
34.4 |
27.6 |
16.4 |
5 |
|
2007 |
12.2 |
|
|
29.9 |
34.6 |
37.5 |
37.9 |
37.9 |
35.9 |
|
|
|
|
2008 |
|
|
27.3 |
29.9 |
|
39.9 |
37.8 |
37.2 |
|
23.1 |
21.4 |
15.6 |
|
2009 |
|
13.1 |
24.4 |
24.9 |
37.8 |
|
|
|
37.3 |
32.2 |
23.7 |
|
|
2010 |
|
20.1 |
|
32.9 |
39.7 |
|
41.9 |
39.9 |
|
30.5 |
23.3 |
18.4 |
|
2011 |
12.2 |
19.5 |
21.1 |
25.8 |
38.2 |
|
41.9 |
|
35.4 |
|
|
|
|
2012 |
|
|
|
|
|
|
|
|
|
|
|
|
|
2013 |
|
|
|
29.4 |
39.4 |
40.4 |
38.5 |
41.1 |
35.4 |
29.7 |
23.2 |
12.2 |
|
2014 |
15.5 |
14.4 |
26.5 |
34.9 |
39.6 |
40.5 |
34.7 |
40.5 |
39.7 |
33.2 |
23.1 |
|
|
2015 |
11.1 |
18.9 |
26.9 |
33.9 |
38.8 |
38.7 |
45.1 |
41.8 |
34.3 |
34.7 |
18.8 |
20.2 |
|
2016 |
15.8 |
16.5 |
24.5 |
33.2 |
37.3 |
41.6 |
41.2 |
42.6 |
26.9 |
31.3 |
25.3 |
13.8 |
|
2017 |
13.9 |
17.4 |
26 |
31.3 |
36.9 |
41.3 |
39.2 |
43.2 |
39.4 |
31.3 |
22.6 |
17.6 |
|
2018 |
16.1 |
|
25.9 |
33.7 |
|
37.5 |
43.9 |
40.9 |
41.8 |
20.7 |
20.7 |
16.6 |
|
2019 |
14.3 |
20.1 |
23.4 |
29.5 |
40.7 |
43.2 |
41.3 |
41.3 |
38.8 |
34.3 |
24.1 |
|
|
2020 |
16.8 |
16.3 |
23 |
23.1 |
35.7 |
42.9 |
43.5 |
40.2 |
39.4 |
31.9 |
22.5 |
17 |
|
2021 |
14.9 |
21.9 |
25.5 |
27.5 |
40.5 |
43.4 |
43.8 |
43.8 |
38.9 |
31.9 |
21.7 |
16.8 |
|
2022 |
17.6 |
20.4 |
22.9 |
29.1 |
35.2 |
40.9 |
37.3 |
|
40.9 |
32.9 |
25.8 |
15.1 |
|
2023 |
14.5 |
16.5 |
24.5 |
32.5 |
38 |
41.4 |
40.9 |
45.8 |
38.9 |
33.2 |
24.2 |
20.5 |
|
2024 |
18.6 |
19.6 |
23.3 |
36.4 |
40.3 |
44.1 |
45.4 |
44.6 |
39.4 |
35.1 |
24.7 |
17.3 |
Table 8. Missing values of maximum monthly water temperature at Al-Hindiya Barrage, identified using SPSS
|
Year |
Jan |
Feb |
Mar |
Apr |
May |
Jun |
Jul |
Aug |
Sep |
Oct |
Nov |
Dec |
|
1994 |
14.1 |
16.8 |
23.5 |
22.4 |
31.5 |
34.1 |
34.7 |
32.7 |
33.7 |
29.5 |
18.5 |
14.6 |
|
1995 |
14.2 |
16.8 |
23.5 |
27.5 |
33.1 |
34.4 |
34.5 |
33.2 |
32.5 |
21.9 |
16.5 |
9.3 |
|
1996 |
10.8 |
16.8 |
23.5 |
29.5 |
25.3 |
35 |
37.8 |
36.9 |
34.9 |
27.5 |
21.6 |
14.5 |
|
1997 |
16.9 |
12 |
21.2 |
29.5 |
35.2 |
35 |
34.2 |
35.3 |
33.5 |
30.4 |
21.9 |
14.6 |
|
1998 |
10.6 |
10.1 |
20.6 |
31.2 |
32.7 |
39.9 |
35.4 |
39.3 |
34.8 |
29.5 |
23.5 |
14.9 |
|
1999 |
14.9 |
18.8 |
23.8 |
30.6 |
34.9 |
34.3 |
36 |
39.1 |
35.9 |
29.5 |
21.4 |
14.6 |
|
2000 |
11.8 |
17.7 |
21.1 |
29.2 |
31.1 |
36.6 |
41.9 |
39.4 |
36.6 |
32.2 |
22.6 |
7.1 |
|
2001 |
12.9 |
16.8 |
24.6 |
27.5 |
37.7 |
38.9 |
39.3 |
29.8 |
35.2 |
32.1 |
21.9 |
14.1 |
|
2002 |
11.4 |
15.9 |
20.2 |
27.5 |
34.3 |
39.7 |
41 |
39.1 |
36.9 |
32.3 |
21.2 |
14.6 |
|
2003 |
14.1 |
16.8 |
22.6 |
30.5 |
38.1 |
38.9 |
39.2 |
39.1 |
36.4 |
30.4 |
21.8 |
14.6 |
|
2004 |
14.1 |
16.8 |
21.4 |
29.5 |
33.6 |
35.6 |
36.2 |
33.6 |
38.9 |
30.4 |
21.8 |
12.1 |
|
2005 |
13.1 |
10.7 |
18.7 |
23.9 |
35.4 |
34.3 |
36.3 |
38.2 |
33.4 |
31.5 |
16.5 |
14.6 |
|
2006 |
14.1 |
15.6 |
23.5 |
28.1 |
37.7 |
39.6 |
36.1 |
40.2 |
34.4 |
27.6 |
16.4 |
5 |
|
2007 |
12.2 |
16.8 |
23.5 |
29.9 |
34.6 |
37.5 |
37.9 |
37.9 |
35.9 |
30.4 |
21.8 |
14.6 |
|
2008 |
14.1 |
16.8 |
27.3 |
29.9 |
36.2 |
39.9 |
37.8 |
37.2 |
23.1 |
23.1 |
21.4 |
15.6 |
|
2009 |
14.1 |
13.1 |
24.4 |
24.9 |
37.8 |
38.9 |
39.2 |
39.1 |
37.3 |
32.2 |
23.7 |
14.6 |
|
2010 |
14.1 |
20.1 |
23.5 |
32.9 |
39.7 |
38.9 |
41.9 |
39.9 |
36.4 |
30.5 |
23.3 |
18.4 |
|
2011 |
12.2 |
19.5 |
21.1 |
25.8 |
38.2 |
38.9 |
41.9 |
39.1 |
35.4 |
30.4 |
21.8 |
14.6 |
|
2012 |
14.1 |
16.8 |
23.5 |
29.5 |
36.2 |
38.9 |
39.2 |
39.1 |
36.4 |
30.4 |
21.8 |
14.6 |
|
2013 |
14.1 |
16.8 |
23.5 |
29.4 |
39.4 |
40.4 |
38.5 |
41.1 |
35.4 |
29.7 |
23.2 |
12.2 |
|
2014 |
15.5 |
14.4 |
26.5 |
34.9 |
39.6 |
40.5 |
34.7 |
40.5 |
39.7 |
33.2 |
23.1 |
26.5 |
|
2015 |
11.1 |
18.9 |
26.9 |
33.9 |
38.8 |
38.7 |
45.1 |
41.8 |
34.3 |
34.7 |
18.8 |
20.2 |
|
2016 |
15.8 |
16.5 |
24.5 |
33.2 |
37.3 |
41.6 |
41.2 |
42.6 |
26.9 |
31.3 |
25.3 |
13.8 |
|
2017 |
13.9 |
17.4 |
26 |
31.3 |
36.9 |
41.3 |
39.2 |
43.2 |
39.4 |
31.3 |
22.6 |
17.6 |
|
2018 |
16.1 |
16.8 |
25.9 |
33.7 |
36.1 |
37.5 |
43.9 |
40.9 |
41.8 |
20.7 |
20.7 |
16.6 |
|
2019 |
14.3 |
20.1 |
23.4 |
29.5 |
40.7 |
43.2 |
41.3 |
41.3 |
38.8 |
34.3 |
24.1 |
14.6 |
|
2020 |
16.8 |
16.3 |
23 |
23.1 |
35.7 |
42.9 |
43.5 |
40.2 |
39.4 |
31.9 |
22.5 |
17 |
|
2021 |
14.9 |
21.9 |
25.5 |
27.5 |
40.5 |
43.4 |
43.8 |
43.8 |
38.9 |
31.9 |
21.7 |
16.8 |
|
2022 |
17.6 |
20.4 |
22.9 |
29.1 |
35.2 |
40.9 |
37.3 |
39.1 |
40.9 |
32.9 |
25.8 |
15.1 |
|
2023 |
14.5 |
16.5 |
24.5 |
32.5 |
38 |
41.4 |
40.9 |
45.8 |
38.9 |
33.2 |
24.2 |
20.5 |
|
2024 |
18.6 |
19.6 |
23.3 |
36.4 |
40.3 |
44.1 |
45.4 |
44.6 |
39.4 |
35.1 |
24.7 |
17.3 |
3.1.3 Monthly average water temperature
The maximum monthly average water temperature was observed in August 2023 at 40.8 ℃, while the lowest monthly average was 7 ℃ in December 2000 and 2006 (Table 9).
Table 9. Average monthly water temperature (℃) at Al-Hindiya Barrage, 1994–2024
|
Year |
Jan |
Feb |
Mar |
Apr |
May |
Jun |
Jul |
Aug |
Sep |
Oct |
Nov |
Dec |
|
1994 |
12.1 |
14.6 |
20.2 |
20.3 |
27.5 |
30.2 |
30.8 |
29.1 |
30.1 |
26.4 |
14.7 |
13.5 |
|
1995 |
12.3 |
14.6 |
20.2 |
24.6 |
29.2 |
30.4 |
31.2 |
29.7 |
29.3 |
19.8 |
18.4 |
7.1 |
|
1996 |
9.6 |
14.6 |
20.2 |
25.8 |
29.9 |
31 |
33.3 |
33 |
32 |
25.4 |
20 |
13.1 |
|
1997 |
15 |
10.5 |
17.8 |
25.8 |
31 |
31.8 |
30.2 |
31.4 |
28.6 |
27.4 |
19.9 |
13.5 |
|
1998 |
9.2 |
11 |
17.7 |
26.2 |
29 |
34.4 |
31.8 |
34.6 |
31.1 |
26.7 |
22 |
12.7 |
|
1999 |
13.1 |
16.4 |
20 |
26 |
30.2 |
31 |
31.9 |
35.2 |
33 |
27 |
19.5 |
13.5 |
|
2000 |
10 |
15.4 |
18 |
25 |
28 |
32.9 |
36 |
35 |
32.4 |
28.6 |
20.6 |
7 |
|
2001 |
11 |
14.6 |
21.4 |
24.9 |
33 |
34.6 |
35 |
34.2 |
32 |
28.8 |
20.3 |
13 |
|
2002 |
9.8 |
13.7 |
18 |
24.6 |
31.1 |
34.9 |
36 |
34 |
33.2 |
29.1 |
19.1 |
13.5 |
|
2003 |
12 |
14.6 |
19.2 |
28 |
34 |
34.6 |
35 |
35.2 |
33 |
27.5 |
21.5 |
13.5 |
|
2004 |
12.1 |
14.6 |
18.5 |
25.8 |
29 |
31.8 |
31 |
30 |
35 |
27.5 |
21.5 |
20.2 |
|
2005 |
11.1 |
9 |
17 |
20.6 |
32 |
29.6 |
33 |
34.5 |
30.3 |
29.1 |
14.1 |
13.5 |
|
2006 |
12.1 |
14.2 |
20.2 |
24 |
32.7 |
34.6 |
32.2 |
35.5 |
31 |
25.1 |
13.8 |
7 |
|
2007 |
11.5 |
15 |
20.2 |
25.9 |
22.9 |
33 |
33.3 |
34 |
32.2 |
27.5 |
21.5 |
13.5 |
|
2008 |
12.1 |
14.6 |
23 |
26 |
32 |
34.7 |
33.6 |
33 |
25.9 |
21 |
18.7 |
13.3 |
|
2009 |
12.1 |
10.1 |
20.8 |
21.3 |
33.9 |
34.8 |
35 |
35.2 |
33.6 |
28.8 |
21 |
13.5 |
|
2010 |
12.1 |
17.1 |
20.2 |
28.3 |
34.5 |
34.6 |
37 |
35.2 |
33 |
27 |
20.3 |
16.3 |
|
2011 |
11 |
17.2 |
18 |
23.2 |
33.7 |
34.6 |
36.5 |
35.2 |
30.6 |
27.5 |
21.5 |
13.5 |
|
2012 |
12.1 |
14.6 |
20.2 |
25.8 |
32 |
34.6 |
35 |
35.2 |
33 |
27.5 |
21.5 |
13.5 |
|
2013 |
12.1 |
14.6 |
20.2 |
27 |
36 |
37 |
35.6 |
37 |
31.9 |
27 |
18.1 |
9.3 |
|
2014 |
12.1 |
11 |
22.3 |
31 |
35 |
36 |
33 |
36.4 |
36.1 |
30.2 |
20.2 |
19.4 |
|
2015 |
8 |
16.4 |
24 |
29.6 |
34.2 |
35 |
40.3 |
38.4 |
27.3 |
32 |
13.2 |
18 |
|
2016 |
13.4 |
13 |
22 |
29.6 |
33.1 |
38.1 |
37.2 |
38.3 |
23.3 |
28.1 |
23 |
11.9 |
|
2017 |
11.4 |
15.5 |
23 |
28 |
33 |
36.5 |
35.2 |
38.4 |
35.1 |
28 |
20 |
15.6 |
|
2018 |
14 |
14.6 |
23.2 |
30.3 |
32 |
33.4 |
40 |
37 |
38.3 |
19.9 |
19 |
15.3 |
|
2019 |
12 |
18 |
21 |
26.2 |
36.7 |
38.7 |
36.7 |
37.1 |
35.2 |
31.3 |
22.3 |
13.5 |
|
2020 |
15.1 |
14.8 |
20.6 |
17 |
31.9 |
37.9 |
39 |
37 |
35.9 |
29.4 |
21 |
15.5 |
|
2021 |
13.3 |
19.8 |
17.3 |
25 |
36.1 |
38.8 |
39.4 |
39.6 |
36 |
28.4 |
20 |
15.17 |
|
2022 |
15.9 |
18 |
20.1 |
26 |
31.6 |
38 |
33.8 |
35.2 |
37.4 |
30 |
23.6 |
14 |
|
2023 |
13.3 |
15 |
22.4 |
29.3 |
34.3 |
37.4 |
36.3 |
40.8 |
35.2 |
30.1 |
23 |
19 |
|
2024 |
16.9 |
17.2 |
21.1 |
32 |
36.4 |
38.9 |
40.2 |
39.5 |
35.3 |
31.4 |
23 |
16 |
3.2 Seasonal dynamics
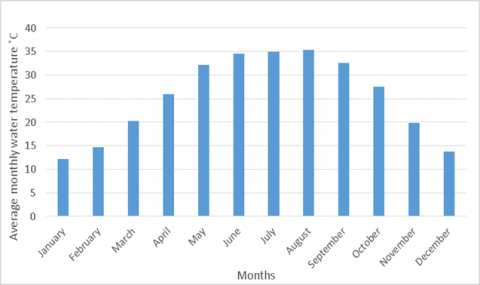
The temporal analysis revealed that the water temperature exhibited clear seasonal fluctuations. In spring, the average monthly water temperature increased steadily from 20.3 ℃ in March to 25.9 ℃ in April and 32.1 ℃ in May. During summer, the temperature rose further, reaching 34.6 ℃ in June and peaking at 35.3 ℃ in August. In autumn, a gradual decline was observed, from 32.5 ℃ in September to 19.9 ℃ in November. In winter, the average monthly temperature ranged between 12.2 ℃ in January and 14.7 ℃ in February. Figure 2 and Table 10 illustrate the average monthly variation across all study years.
Figure 2. Average monthly variations in water temperature across all study years
Table 10. Average monthly water temperature (℃) at Al-Hindiya Barrage across all years
|
Months |
Average Monthly Water Temperature ℃ |
|
January |
12.2 |
|
February |
14.7 |
|
March |
20.3 |
|
April |
25.9 |
|
May |
32.1 |
|
June |
34.6 |
|
July |
35 |
|
August |
35.3 |
|
September |
32.5 |
|
October |
27.5 |
|
November |
19.9 |
|
December |
13.8 |
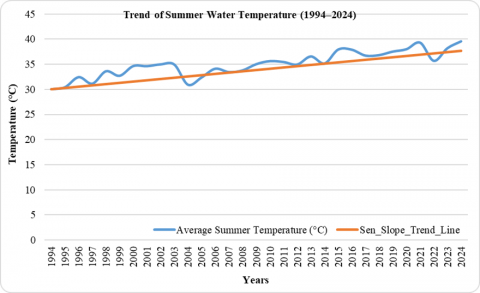
3.3 Temporal trends
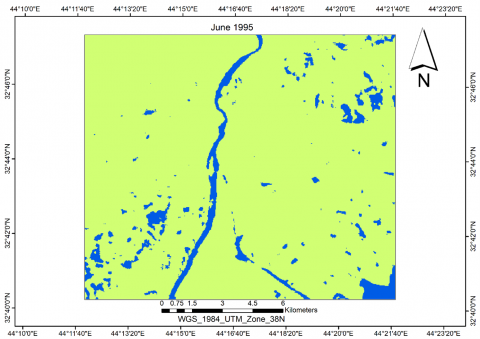
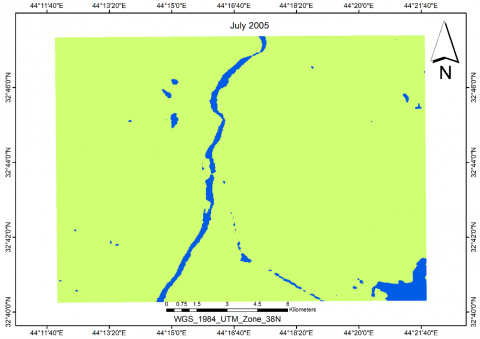
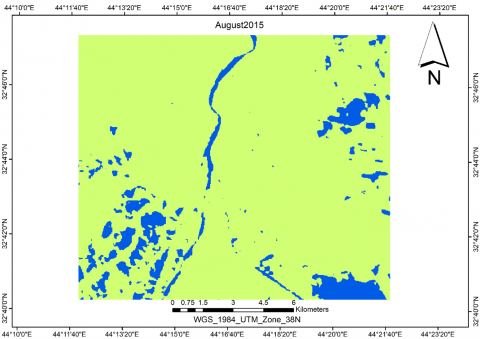
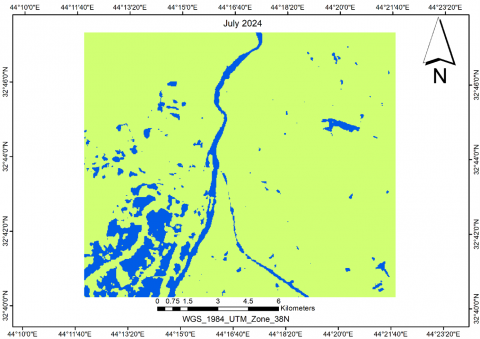
Time series analysis revealed a long-term warming trend, with summer temperatures rising at a faster rate than in other seasons. The Mann–Kendall trend test results indicate a statistically significant increasing trend in summer water temperature during the study period (1994–2024), with Z = 5.90 and p < 0.001. The Sen’s slope estimator shows that the summer water temperature increased at an average rate of 0.253 ℃ per year, confirming a clear long-term warming trend in the study area as shown in Table 11 and Figure 3. During summer, there is a reduction in the DO values since most of the gases are less soluble, evaporate more, the water levels are lower, and degradation activities are high [32]. In addition to the power generated by electric plants that consume large volumes of water for cooling, which results in high concentrations of salts because of evaporation, other factors include wastewater and urban runoff, agricultural and industrial discharges, and chemicals used in the water treatment process [33]. The increased heat flux into river waters is a result of rising solar radiation and air temperatures. It is anticipated that increases in air temperature and solar radiation will lead to higher water temperatures. However, a decrease in solar radiation combined with rising air temperatures will negatively impact water temperatures [6]. Spatial maps for typical years (1995, 2005, 2015, 2024) show a gradual increase in summer temperatures across the reservoir, indicating local climatic influences, as in Figure 4.
Table 11. Mann–Kendall trend test and Sen’s slope for average summer water temperature (1994–2024)
|
Test / Parameter |
Value |
Description |
|
Number of observations (n) |
31 |
Years (1994–2024) |
|
Mann–Kendall S |
348 |
Positive trend |
|
Mann–Kendall Z |
5.9 |
Standardized test statistic |
|
p-value |
3.68 × 10⁻⁹ |
Highly significant (p < 0.001) |
|
Sen’s slope |
0.253 °C/year |
Rate of temperature increase |
|
Trend direction |
Increasing |
Long-term warming trend |
Figure 3. Time series of average summer water temperature (1994–2024) with Sen’s slope trend line
Figure 4. Spatial maps for typical years (1995, 2005, 2015, 2024)
3.4 Impacts on water quality and aquatic ecosystems
An increase in water temperature impairs water quality as it reduces the capacity for oxygen dissolution and may also result in a decrease in water resources [4]. Rising water temperatures lead to increased stress on fish populations [6]. They discovered that when the temperature reached a threshold of 19 ℃, spawning was disrupted as individual fish sought thermal refuge [30].
Temperature can limit the distribution of fish by directly impacting their physiological functions. At a certain threshold, elevated temperatures will cause a sudden decrease in ingestion rates. Cold temperatures can also play a significant role, especially in regions with short growing seasons where fish must survive an extended period, such as winter, with limited resources [34].
When temperatures reach a critical level, metabolic rates may increase to a point where energy intake, such as food consumption, becomes inadequate to sustain essential physiological functions. Growth halts, and the cumulative effects of elevated temperatures may lead to mortality. The discharge of the Euphrates River typically experiences its most significant increase through the wet winter season, while notable decreases occur in summer [35].
Following the construction of dams by Turkey and Syria on the river, the discharge decreased by approximately 40% [1, 12]. Discharge exhibits an inverse correlation with TDS over the years [1]. Climate change has led to an increase in river water temperatures, which has been further exacerbated by anthropogenic heat emissions [36].
During the period from 2005 to 2010, the water type of the Euphrates River at Al-Hindiya Barrage was characterized by the presence of "Na⁺, Mg²⁺, Ca²⁺, SO₄⁻, Cl⁻", and is classified as NaSO₄ water type. The high amounts of sulfate (SO₄) in Hindiya show that the water from the Euphrates River has been altered by the breakdown of evaporite rocks that were exposed along its route [14].
The lower Euphrates' streamflow has dropped a lot, and the temperatures have gone up. These are key pieces of information for formulating plans for how to manage Iraq's water resources in the future [1].
Rivers and streams are crucial to the economic infrastructure of a community, supplying water for agriculture, industry, and energy production. However, these human interventions can diminish the hydro-ecological resilience of the river basin, potentially resulting in imbalances within the ecosystem and deteriorating water quality [34].
Humans increase the phosphorus concentration in rivers primarily during the use of detergents and phosphate fertilizers [37].
3.5 Discussion
These findings provide valuable insights into the impacts of climate change on river thermal dynamics. Such results are vital for water resource administration, ecological assessments, and sustainable design in the Euphrates River basin, particularly in the Hindiya Barrage area. The warming trends observed in this study are consistent with regional climate change patterns of rising air temperatures and decreasing rainfall.
Rising water temperatures lead to increased stress on fish populations [6]. Fine sediments can obstruct the exchange between surface waters and intragravel flows, thereby contributing to the warming of the water [34]. High water temperatures lead to a decline in water quality, reducing its ability to dissolve oxygen and potentially depleting its resources [4]. They also affect numerous water quality parameters important for domestic, environmental, industrial, and agricultural uses [5].
Global sediment discharge is decreasing more due to trapping in reservoirs than it is being increased by human activities such as agriculture, mining, and deforestation. The decline in assessed sediment transport over time is chiefly attributed to the weakening of maximum spring freshet flows [38].
The primary sources of thermal pollution in water are nuclear power plants and other industrial facilities that utilize water as a cooling agent [34].
It is anticipated that increases in air temperature and solar radiation will lead to higher water temperatures. However, a decrease in solar radiation combined with rising air temperatures will negatively impact water temperatures [6].
In a given climate regime, water temperature and its variability are influenced by the water source—groundwater-dominated rivers typically have cooler temperatures with less diurnal variation compared to those with minimal groundwater. Additionally, the volume of flow plays a role, as larger rivers generally exhibit less temperature variation over time. At a finer scale, the characteristics of the river corridor also impact temperature; for example, rivers shaded by overhanging vegetation.
Given the sensitivity of water temperature to variations in discharge, an increase of 20% in discharge typically mitigates the rise in water temperature. Conversely, reductions of 20% and 40% in discharge tend to exacerbate increases in water temperature across most river stations. This phenomenon can be attributed to the greater thermal capacity of a river at higher discharges, which increases water volume, and the reduced thermal capacity when discharges are diminished. We anticipate that the influence of river discharge on water temperatures will become more pronounced in the future. Furthermore, climate variability is anticipated to intensify, leading to a higher risk of droughts and heatwaves [7].
Long-term environmental risks include stress on aquatic species, changing habitat suitability, and challenges to reservoir operation and irrigation planning.
This study used thermal data derived from Landsat satellite imagery from 1994 to 2024 to examine long-term spatial and temporal changes in water temperature at the Hindiya Barrage on the Euphrates River. The results revealed a clear and continuous upward trend in temperature, particularly during the summer, which is closely linked to reduced river discharge, increased evaporation, and higher solar irradiance under changing climatic conditions.
The results show that summer water temperatures have increased at a faster rate than the annual averages, indicating increased vulnerability of the river system during periods of low flow. This temperature increase poses significant risks to aquatic ecosystems, including heat stress on fish populations, reduced dissolved oxygen levels, and a general decline in water quality. Furthermore, elevated water temperatures may negatively impact reservoir operation efficiency and the suitability of irrigation water in downstream areas.
From a practical standpoint, the results of this research offer a scientific foundation for local water resource administration and decision-making. Identifying warming trends can inform adaptation strategies for reservoir operation, help optimize irrigation scheduling, and guide ecosystem protection measures under increasing climate pressures. The findings are also valuable for policymakers seeking to enhance climate change adaptation strategies in the Euphrates River Basin.
Despite its contributions, this study highlights the need for further research. Future studies should aim to:
Link hydrological models with remote sensing data to differentiate relative contributions of climate change and human intervention (for example, dam operation and water withdrawal) to river water temperature.
Integrate high-resolution time-resolution satellite data (such as combining Landsat data with MODIS or Sentinel-3 data) to improve monitoring of short-term temperature fluctuations and extreme heat events.
Incorporate in-situ water temperature and discharge measurements to improve verification accuracy and reduce uncertainties associated with satellite-derived estimates.
Expand the analysis to include future climate scenarios, enabling the prediction of water temperature changes and their potential impacts on ecosystem health and water resource sustainability.
Overall, this research offers essential insights into the thermal dynamics of the Euphrates River (Al-Hindiya Barrage) and underscores the need to integrate remote sensing, hydrological modeling, and climate adaptation planning to ensure sustainable water resource administration in arid and semi-arid regions.
[1] Al-Ali, I.A., Al-Dabbas, M.A. (2021). Evaluating the climatic change effect on the water quality of Euphrates River from Haditha to Al-Hindiya/ Iraq. Review of International Geographical Education, 11(5): 4470-4481.
[2] IPCC fifth assessment report synthesis report: 16th annual symposium of the French renewable energy association. UNESCO House, Paris. https://ser-evenements.com/IMG/pdf/1.1_-_rajendra_kumar_pachauri_-_giec_-_18_slides_sur_20_.pdf.
[3] Damborska, I., Gera, M., Melo, M., Lapin, M., Nejedlik, P. (2016). Changes in the daily range of the air temperature in the mountainous part of Slovakia within the possible context of global warming. Meteorologische Zeitschrift, 25(1): 17-35. https://doi.org/10.1127/metz/2015/0569
[4] Czernecki, B., Ptak, M. (2018). The impact of global warming on lake surface water temperature in Poland - The application of empirical-statistical downscaling, 1971-2100. Journal of Limnology, 77(2): 330-348. https://doi.org/10.4081/jlimnol.2018.1707
[5] Deas, M.L. (2000). Water Temperature modeling review central valley. California Water Modeling Forum.
[6] Gooseff, M.N., Strzepek, K., Chapra, S.C. (2005). Modeling the potential effects of climate change on water temperature downstream of a shallow reservoir, Lower Madison River, MT. Climatic Change, 68(3): 331-353. https://doi.org/10.1007/s10584-005-9076-0
[7] van Vliet, M.T.H., Ludwig, F., Zwolsman, J.J.G., Weedon, G.P., Kabat, P. (2011). Global river temperatures and sensitivity to atmospheric warming and changes in river flow. Water Resources Research, 47(2). https://doi.org/10.1029/2010WR009198
[8] Seif, E., Shokr, H., Youssef, A.M., Sharaf Eddeen, M., Diab, Y., Imam, Y.E. (2023). Climate change effect on water temperature and evaporation in Lake Qarun. Water Science, 37(1): 1-10. https://doi.org/10.1080/23570008.2023.2189220
[9] Imteaz, M.A., Mahmood, W., Sagar, K.A., Yilmaz, A. (2017). Climate change fingerprints in lower Euphrates basin: Climate and flow data trend analysis. International Journal of Water, 11(3): 279-293. https://doi.org/10.1504/IJW.2017.085888
[10] Durack, P.J. (2015). Ocean salinity and the global water cycle. Oceanography, 28(1): 20-31. https://doi.org/10.5670/oceanog.2015.03
[11] Rahi, K.A., Halihan, T. (2010). Changes in the salinity of the Euphrates River system in Iraq. Regional Environmental Change, 10(1): 27-35. https://doi.org/10.1007/s10113-009-0083-y
[12] Al-Ansari, N., Adamo, N., Sissakian, V.K. (2019). Hydrological characteristics of the Tigris and Euphrates rivers. Journal of Earth Sciences and Geotechnical Engineering, 9(4): 1-26.
[13] Rehana, S., Mujumdar, P.P. (2011). River water quality response under hypothetical climate change scenarios in Tunga‐Bhadra River, India. Hydrological Processes, 25(22): 3373-3386. https://doi.org/10.1002/hyp.8057
[14] Muhammed, M., Al-Dabbas, M. (2022). Impact of climatic change and shortage of water flow on the Euphrates River water salinity between Al-Hindyia and Al-Nasiriya, Southern Iraq. Iraqi Geological Journal, 55(2A): 139-152. https://doi.org/10.46717/igj.55.2A.10Ms-2022-07-26
[15] Shi, X., Mao, J., Thornton, P.E., Hoffman, F.M., Post, W.M. (2011). The impact of climate, CO2, nitrogen deposition and land use change on simulated contemporary global river flow. Geophysical Research Letters, 38(8): L08704. https://doi.org/10.1029/2011GL046773
[16] Al-Ansari, N. (2016). Hydro-politics of the Tigris and Euphrates basins. Engineering, 8(3): 140-172. https://doi.org/10.4236/eng.2016.83015
[17] Hommadi, A.H., Dahir, F.M. (2018). Predicting sediment accumulation in Euphrates River: A case study of the upstream of Al-Hindiya Barrage, Iraq. Indian Journal of Natural Sciences, 9(51): 15450-15458.
[18] Kurt, C. (2013). The impact of the Southeast Anatolia Project (GAP) on displaced families: Household livelihoods and gender relations. Doctoral dissertation, Newcastle University.
[19] Al-Ansari, N. (2013). Management of water resources in Iraq: Perspectives and prognoses. Engineering, 5(6): 667-684. https://doi.org/10.4236/eng.2013.58080
[20] Obaid Hamad, S. (2015). Compared some water characteristics of Tigris River with Euphrates River. Journal of University of Anbar for Pure Science, 9(3): 191-200.
[21] Morozova, G.S. (2005). A review of Holocene avulsions of the Tigris and Euphrates Rivers and possible effects on the evolution of civilizations in lower Mesopotamia. Geoarchaeology, 20(4): 401-423. https://doi.org/10.1002/gea.20057
[22] U.S. Geological Survey. http://www.usgs.gov.
[23] Landsat Missions. (2020). Landsat 4-5 TM Collection 2 Level 2 Data Format Control Book. USGS. https://www.usgs.gov/media/files/landsat-4-5-tm-collection-2-level-2-data-format-control-book.
[24] Dwyer, J.L., Roy, D.P., Sauer, B., Jenkerson, C.B., Zhang, H.K., Lymburner, L. (2018). Analysis ready data: Enabling analysis of the Landsat archive. Remote Sensing, 10(9): 1363. https://doi.org/10.3390/rs10091363
[25] Wachmann, A., Starko, S., Neufeld, C.J., Costa, M. (2024). Validating landsat analysis ready data for nearshore sea surface temperature monitoring in the Northeast Pacific. Remote Sensing, 16(5): 920. https://doi.org/10.3390/rs16050920
[26] Landsat Missions. (2023). Landsat 8-9 OLI/TIRS Collection 2 Level 2 Data Format Control Book. USGS. https://www.usgs.gov/media/files/landsat-8-9-olitirs-collection-2-level-2-data-format-control-book.
[27] Wang Y, Deng Y, Yang Y, Tuo Y, Wang X, Zhu J. (2025). Investigation of the spatiotemporal patterns in water surface temperature from landsat data in Plateau Rivers. Remote Sensing, 17(7): 1141. https://doi.org/10.3390/rs17071141
[28] Cook, M., Schott, J.R., Mandel, J., Raqueno, N. (2014). Development of an operational calibration methodology for the Landsat thermal data archive and initial testing of the atmospheric compensation component of a Land Surface Temperature (LST) Product from the archive. Remote Sensing, 6(11): 11244-11266. https://doi.org/10.3390/rs61111244
[29] Ahmed, A.Y., Ali, A.M., Ahmed, N. (2024). Temporal dynamics of leaf area index and land surface temperature correlation using Sentinel-2 and Landsat OLI data. Environmental Systems Research, 13(1): 43. https://doi.org/10.1186/s40068-024-00371-6
[30] Benyahya, L., Caissie, D., St-Hilaire, A., Ouarda, T.B.M.J., Bobée, B. (2007). A review of statistical water temperature models. In Canadian Water Resources Journal, 32(3): 179-192. https://doi.org/10.4296/cwrj3203179
[31] McBean, E., Bhatti, M., Singh, A., Mattern, L., Murison, L., Delaney, P. (2022). Temperature modeling, a key to assessing impact on rivers due to urbanization and climate change. Water, 14(13): 1994. https://doi.org/10.3390/w14131994
[32] Bhateria, R., Jain, D. (2016). Water quality assessment of lake water: A review. Sustainable Water Resources Management, 2(2): 161-173. https://doi.org/10.1007/s40899-015-0014-7
[33] Al-Aboodi, A.H., Khudhair, K.M., Al-Aidani, A.S. (2016). Prediction of groundwater level in Safwan-Zubair area using artificial neural networks. Basrah Journal for Engineering Science, 16(1): 42-50. https://doi.org/10.33971/bjes.16.1.8
[34] Koycheva, Y. (2004). Stream Water Temperature and Climate Change: An Ecological Perspective. National Library of Canada.
[35] Wang, Y., Gastellu-Etchegorry, J.P. (2020). DART: Improvement of thermal infrared radiative transfer 1 modelling for simulating top of atmosphere radiance. Remote Sensing of Environment, 251: 112082. https://doi.org/10.1016/j.rse.2020.112082
[36] Liu, S., Xie, Z., Liu, B., Wang, Y., et al. (2020). Global river water warming due to climate change and anthropogenic heat emission. Global and Planetary Change, 193: 103289. https://doi.org/10.1016/j.gloplacha.2020.103289
[37] Hébert, M.P., Fugère, V., Gonzalez, A. (2019). The overlooked impact of rising glyphosate use on phosphorus loading in agricultural watersheds. Frontiers in Ecology and the Environment, 17(1): 48-56. https://doi.org/10.1002/fee.1985
[38] Naik, P.K., Jay, D.A. (2011). Human and climate impacts on Columbia River hydrology and salmonids. River Research and Applications, 27(10): 1270-1276. https://doi.org/10.1002/rra.1422