Karuppusamy Karpagavadivu*![]() | Thangavelu Baranidharan
| Thangavelu Baranidharan![]() | Mettupalayam Subramaniam Kavitha
| Mettupalayam Subramaniam Kavitha![]() | Thangavelu Sumathi
| Thangavelu Sumathi![]()
© 2026 The authors. This article is published by IIETA and is licensed under the CC BY 4.0 license (http://creativecommons.org/licenses/by/4.0/).
OPEN ACCESS
Diabetic retinopathy (DR) is a circumstance where a person with diabetes has abnormal blood vessels in their eyes, which can lead to fluid buildup in the macula resulting in diabetic macular edema (DME). However, the traditional method of identifying these conditions through manual analysis of photos is costly and time-consuming, and automated systems are limited in their adaptability to different illnesses and real-world situations. To address these challenges, a new system called Multilevel Classifier with Improved Grey Wolf Optimization (MC-IGWO) has been developed to diagnose and identify DR disorders. The MC-IGWO system extracts various properties of the optic cup, like blood vessels, neural tissue, and the optic disc, and uses feature clustering to find the vessel segment the fundus photograph. By combining the Spectral Classifier with Predictive Rules, the MC-IGWO framework aims to enhance the accuracy of classification for early disease identification. To locate and categorize DR lesions, the DenseNet-100 feature extraction technique is used on top of CenterNet, a one-stage detector. The proposed approach has been tested on challenging datasets such as APTOS-2019 and IDRiD and has realized high average accuracY of 97.89% and 98.1%, respectively. Moreover, the system has been validated across dataseats using EYEPACS and Diaretdb1 datasets. Our method can successfully identify DR and DME lesions, including grainy, low-intensity photos, and extract representative important points compared to previous classification approaches. Therefore, this new system can be highly beneficial in automating the detection and identification of DR and DME lesions, offering a more efficient and cost-effective solution for patients.
Multilevel Classifier, edema, EYEPACS, lesions, stroke, analytical rule and predictive rule mining
Diabetes is a chronic condition where the body’s ability to regulate blood sugar (glucose) is impaired, resulting in elevated blood glucose levels [1]. This occurs due to insufficient insulin production or the body's inability to effectively use insulin [2]. Although diabetes cannot be cured, it can be managed to prevent severe complications such as stroke, heart disease, kidney failure, and nerve damage. According to global statistics from 2017, approximately 8.8% of the world’s population is affected by diabetes, and this is expected to rise to 9.9% by 2045 [3].
There are two primary types of diabetes: Type 1 (T1D) and Type 2 (T2D) [4]. Type 1 diabetes commonly affects children and adolescents and requires insulin therapy as oral medications are ineffective. Type 2 diabetes is more prevalent among adults and is often associated with obesity, hypertension, and other metabolic disorders [5]. The incidence of diabetes is increasing worldwide, underscoring the importance of rapid and accurate diagnosis to facilitate timely treatment.
Traditionally, diagnosis relies on clinical tests such as blood glucose measurements and insulin tolerance assessments [6]. However, these methods can be time-consuming and may not always detect the disease early enough for effective intervention. Artificial intelligence (AI) and machine learning (ML) have emerged as promising tools to support early diagnosis by analyzing large amounts of patient data [7]. Key challenges in applying ML include identifying relevant features and selecting appropriate classification algorithms.
Common ML algorithms such as Support Vector Machines (SVM), Decision Trees (DT), and Logistic Regression (LR) have been applied to diabetes prediction with varying success [8]. Techniques like Principal Component Analysis (PCA) and fuzzy networks have been used to improve feature extraction and classification accuracy. More advanced models, including Weighted Least Squares SVMs and Quantum Particle Swarm Optimization (QPSO), have also been explored [9-11]. Ensemble methods, which combine multiple algorithms, have demonstrated improved performance in diabetes prediction tasks [12-14].
Deep learning approaches, especially Convolutional Neural Networks (CNNs), have shown potential in analyzing medical images such as retinal fundus photographs for early detection of diabetic complications [15, 16]. These AI-based models can assist clinicians by automating diagnosis and improving accuracy. The major contributions are,
In this context, this paper proposes a novel hybrid model that integrates advanced optimization techniques and deep learning for improved diagnosis of diabetic retinopathy (DR) using digital fundus images. The structure of the paper is as follows: Section 2 reviews relevant literature, Section 3 details the proposed methodology, Section 4 presents experimental results and discussion, and Section 5 concludes the study.
One of the major factors that contribute to vision impairment, especially in people with pre-existing diabetes, is the degeneration of the retina. For researchers who want to assist optometrists in dealing with an expanding number of patients and increasing data needs, there is a focus on detecting this condition properly to reduce manual effort and improve efficiency.
2.1 Review of image processing methods used to identify diabetic retinopathy
An important aspect of contemporary ML techniques for detecting diabetic eye diseases is image preprocessing. The research undertaken by Krishnamoorthi’s study mainly concentrated on applying structural techniques to identify exudates in fundus images. The techniques used for preprocessing include histogram equalization, thresholding to create binarized images, and applying the watershed algorithm to identify lesions. The techniques have been applied to databases such as Messidor and DRIVE databases and other local databases to identify abnormalities through techniques such as contrast enhancement, top hat transformations, and thresholding. For detecting red lesions, new techniques such as stochastic equalization and characterizing vessels have been developed to classify them into different classes such as normal, mild to moderate, and severe.
Preethi and Asokan’s study combined two different techniques for preprocessing to improve exudate detection in fundus images. The techniques used for preprocessing are based on vessel segmentation, brightness thresholding, and region filtering on one hand and edge detection and structural features on the other hand. Other techniques used for preprocessing include median filtering and subtraction for detecting lesions in images. Other techniques used for preprocessing include resizing images and applying techniques such as CLAHE and top hat filtering to improve feature detection.
In order to enhance the detection of microaneurysms, the blood vessels are usually eliminated. In this regard, Harini and Sheela [17] used candidate extraction techniques along with image enhancement techniques like CLAHE and morphological operations. In another study, Siddalingaswamy and Prabhu [18] used classification based on the distance of exudates from the foveal region, green channel extraction, and candidate overlap evaluation after identifying the optic disc and macula.
In other studies, researchers have used image databases like DIARETDB for image analysis [19], where the fundus image was converted into a green channel image for better contrast and exudates. In this study, CLAHE was used for illumination correction, and geometric operations were used for background removal. Region growing was used for exudates detection. In another study by Palavalasa and Sambaturu [20], digital image processing techniques like average filtering, illumination correction, and removal of the optic disc were used. Edge detection techniques like the Kirsch operator were used for exudates detection.
In another study, Yaşar et al. [21] used ML and expert knowledge for exudates and microaneurysms detection using a relatively smaller dataset. In this study, contrast correction using the IHS transform, detection of the optic disc by focusing on regions with high intensity variation, and detection of blood vessels using AI-based techniques were used. Exudates detection was performed using iterative region growing techniques.
2.2 Review of feature extraction techniques for detecting diabetic retinopathy
In the research paper by Sinthanayothin et al. [22], the researchers were motivated by the need to develop an approach for the detection of DR through the analysis of fundus images. The researchers used the Kirsch edge detection method for the extraction of features, with particular emphasis on the extraction of vascular features. The image was converted to grayscale and enhanced through the application of adaptive histogram equalization. The grayscale image was then used for the extraction of features through the application of the Kirsch operator. The image was then used for the extraction of vascular features.
Seoud et al. [23] focused on texture-based features by first identifying regions of interest using image processing. Local binary pattern (LBP) techniques were then used to detect exudates. Recently, new diagnostic techniques have also been proposed using texture-based features. For example, new sets of color features have been proposed to derive a wide range of features, allowing images to be classified into healthy and diseased categories.
Further work has also focused on the detection of red lesions using shape-based features. In this work, image quality was first improved using mean filtering. The optic disc was also eliminated. Various morphological features were used to classify images into diseased and healthy categories. Some of the features included area, perimeter, circularity, rectangularity, and solidity for features such as hemorrhages and microaneurysms.
Kukkar et al. [24] proposed several image processing techniques for exudates. Fuzzy c-means clustering features were used for exudates detection. Vessels were segmented, and image filters were used for image enhancement. In this work, several features were derived using a relatively smaller dataset. The features included the optic disc and vessels. In another work by Anupama et al. [25], the use of smaller datasets was emphasized. The features derived included the optic disc and vessels. The optic disc was eliminated using Sobel edge detection. Vessels were also extracted using Kirsch edge detection. Exudates were then detected using the green channel of the image. The position and number of exudates were accurately identified.
2.3 Review of the machine learning methods employed in the system for detecting diabetic retinopathy
Yu et al. [26] proposed an approach for the detection and classification of exudates and micro-aneurysms in retinal images. The approach was based on the extraction of vascular features by converting the image from the RGB color space to the CMY color space, followed by the removal of blood vessels using structural techniques. The application of the boundary detection and hole-filling approach was also used. The classification was performed using the decision tree algorithm and the SVM classifier.
Chandran et al. [27] proposed an approach for the detection of exudates in retinal images using various morphological and image processing techniques. The approach was based on the detection of the optic disc, removal of blood vessels, and the application of the region-based approach for the detection of exudates. The processed data were used for the classification using CNN.
Dutta et al. [28] proposed an image processing approach based on the application of the amplitude frequency modulation (AM-FM), demodulation, and Gabor filter for the detection of the boundaries of the lesions. The texture and vascular features were extracted, and the RF classifier was applied for the classification of the severity of the disease.
In another research, Yadav et al. [29] proposed an approach for the detection of micro-aneurysms and red lesions using image processing techniques such as thresholding, binarizing, removal of blood vessels, and morphological operators. The classification was performed using the Gaussian Mixture Model classifier, and the severity of the disease was determined based on the number of lesions.
Tjandrasa et al. [30] proposed a system for classification of diabetic retinopathy into various classes like hemorrhages and exudates. In this system, image processing techniques like image enhancement, subtraction, thresholding, and morphological processing are used. The important features like the optic disc and vessels are eliminated. Then, a neural network is used for classification.
Deep learning techniques have also been used for exudate detection. In this study, a CNN-based system [31] was used for classification. In this system, the images are preprocessed by enhancing the brightness of the image and removing the optic disc. Then, morphological opening operations are performed. This system can be used for both detection and classification of patients using the e-ophtha dataset [32].
In another study by Gurudath et al. [33], various ML techniques are used along with image preprocessing for the detection of exudates and hemorrhages. In this system, the irrelevant features like background and lens are eliminated. Then, statistical features like mean, standard deviation, and variance are used. After that, PCA is used for classification.
2.4 Research gap identified
Significant research has already been carried out in the field of diabetic retinopathy (DR), but it is important to examine the effectiveness of the techniques in real-world clinical scenarios. In real-world clinical scenarios, images have significant variability due to differences in imaging devices and conditions. In addition, images have patient-specific variability. In real-world clinical scenarios, the existing techniques for DR and DME have difficulty in achieving high accuracy in classification. Therefore, there is a significant need for developing more efficient and reliable techniques for DR and DME.
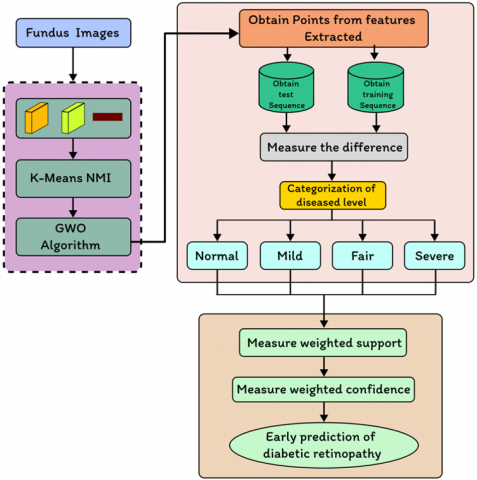
The model that was suggested is split into two stages: the extraction of features and identification. Figure 1 shows the entire concept. In the first section, an extraction method that can produce class-separable features is learned using k-means and GWO. The suggested model extracts information from the original retina pictures using a convolution layer and an enhancement layer.
In anticipation of an increase in precision when classification, the layer that pools data is replaced by an encoding phase to retain as many important features of the graphic as feasible. Additionally, the idea of improving the naturally occurring grouping of properties is looked into in order to create a tool for feature extraction that can be more effective. Here, the attribute extractor's parameters are optimised to provide a set of characteristics that can operate effectively in an independent clustering setting. The subsequent part involves teaching standard classifications how to classify fundus images using the recently picked up characteristics. The network's weights are modified without regard to categorization error. It is crucial to remember that the suggested feature modeling framework utilizes an incorrect classification neutral pattern strategy for learning and may be used in conjunction with any predictor.
Figure 1. Block diagram of the suggested system in general
3.1 The convolution layer
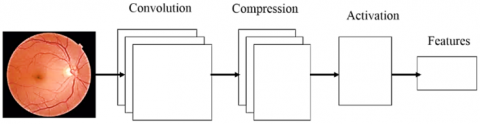
The recommended model's convolution stage is made up of a number of filters that are used to analyse the input retinal picture and draw out key characteristics. The convection layer is decompression layer, plus smoothing phase comprise the basic structure of the CNN used in the current research. The compression layer reduces the final result of the convolution process into space with fewer dimensions by applying a set of parameters. The function known as the sigmoid activation is employed before the final layer. A non-linear activation algorithm has been applied to the data that is compressed, and the final squashed layer simply reflects the output attributes that were retrieved from the picture itself. The NMI maximisation is used as the goal value for GWO to change the CNN weights. The NMI and its use in this process are covered in more detail in the following sections.
3.2 The compression layer
The characteristic region of the map is significantly increased by the convolution process. Usually, a pooling component is used to get the most important activations by reducing the amount of characteristics. It does, however, remove a sizable quantity of picture data. It is a lossy choice of applicants method that falls short of providing the best possible data about space preservation. The pooling layer decides whether to activate depending on a circumstance that could ignore crucial factors. The force of compression layer, which aims to map pixels data in a component space with reduced aspects, is suggested in line with this situation. simply decreasing the dimensions of the combination layer—rather than simply rejecting activations—it decreases the convolutional layer's expanded feature space. Convoluted maps of features are augmented by two-dimensional filtration in the compressing phase to provide a converted component with lower activated. Next, a feature for categorization is created using the recently collected activations. The weighted matrices used by the decompression layer for decreasing activation size can be acquired using systematic optimisation in order to provide attributes that can produce separability between classes.
Figure 2. The convolution network model
The NMI of k-means is used in the model that was suggested as a measure of the feature's separateness. The resultant multilayer architecture is shown in Figure 2. The benefits and specifics of NMI computation are discussed in the portion of the article that follows.
3.3 Feature learning framework
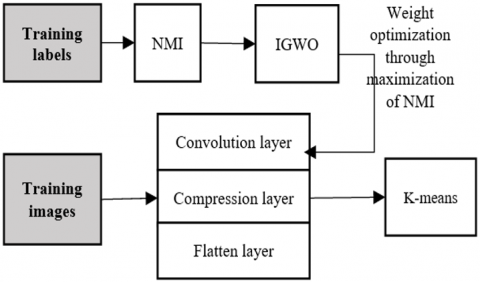
The suggested model's initial task is feature the extraction procedure, which is carried out using the feature training structure that has been suggested. Any forecasting or classifications issue must include features. Micro stenosis bleeding occurs and stiff discharge are the particular deviations or pathologies detected by fundus that have which are accepted in the categorization of DR. With extraction of features as the main objective this stage makes use of methodologies like aggregation and optimisation. The model suggests an element extractor that combines a compression layer with a convolution layer, as previously defined.
Figure 3. An illustration of a feature extraction phase
As shown in Figure 3, the characteristic classifier approach is used to determine characteristics of the foundation picture. The statistical significance of those characteristics can be determined based on how well they perform in a clustered setting. Based on how well the attributes performed in the clustering step of k-means and the NMI significance, GWO is used for modifying the weighting factors affecting the feature extractor. An illustration of the practical details of the phase is shown in Figure 3. The parts that following go into great depth on each model piece.
3.4 K-means clustering
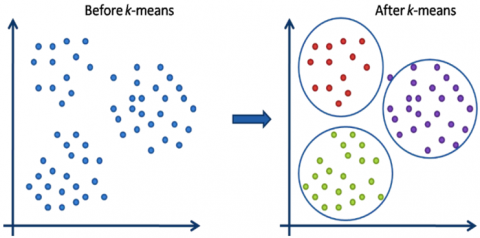
A grouping is a group of data components that have been combined according to particular commonalities. Utilizing K-means, the input dataset may be divided into clusters of k by reducing within-cluster deviations. The clustering method of K-means has been used as an attribute learner step in both supervised and unsupervised learning methods. The unsupervised ML technique using K-means clustering divides data sets with no labels into different groupings. The "k" parameter predetermines how many clusters need to be produced. Each cluster has a center linked with it, making it a centroid-based method. In simpler terms, the k-means method finds k centroids in order and, while keeping its centers as compact as possible, distributes every information point to the nearest clustering. Finding the center of mass or summing the data is what "means" in the k-means algorithm refers to. This method's primary objective is to reduce the total separation across every statistic to its corresponding cluster. The technique takes an unlabeled dataset as input, separates it into multiple clusters of k, and repeats this procedure until it is impossible to identify the best regions. The k-means clustering strategyis seen in action in Figure 4.
Figure 4. Working of the k-means clustering algorithm
The k-means clustering technique has the following two primary goals: Continuously determining the best value for k-center locations or the center. Every information point is associated with the closest k-center, and the information points near the particular k-center are gathered to form a cluster.
Consequently, each cluster comprises data points that are unique from the others and have certain characteristics and correlations. The phases of the k-means clustering process are described in the subsection that follows. The steps below outline how the k-Means method works.
Step 1: Choose k to calculate the number of clusters;
Step 2: Pick k centroids or random locations;
Step 3: Each data point should be assigned to its closest centroid to produce the set number of clusters, k;
Step 4: Find the difference and reposition each cluster's center;
Step 5: Repeat the third step to reassign every point of data to its new closest centroid for each cluster;
Step 6: If there is a re-assignment, go to step 4; otherwise, the algorithm is complete;
High intra-cluster similarity and minimal inter-cluster similarity are the ultimate goals of a clustering algorithm. The separation between the various clusters must be as great as feasible. A clustering model's effectiveness or clustering quality can be assessed using a variety of measures, including the Rand index, NMI, and Purity. The NMI is utilized for the same purpose in this experiment and is discussed in the part below.
3.5 Normalized Mutual Information
For evaluating the quality of groups, the NMI is a useful metric. By knowing the cluster labels, it reveals how much the uncertainty surrounding class labels reduces. Information gained from decision trees is comparable to this. Due to the fact that we require the instance's class labels in order to calculate the NMI, it is an external metric. However, because it has been normalized, it is possible to compare and quantify NMI between clustering with various numbers of clusters.
$N M I(Y, C)=\frac{2 \times I(Y ; C)}{\lceil H(Y)+H(C)\rceil}$ (1)
In this case, Y and C stand in for the levels of the training session and the cluster, respectively. Entropy is denoted by H (.), and shared information between Y and C is denoted by I (Y; C).
3.6 IGWO
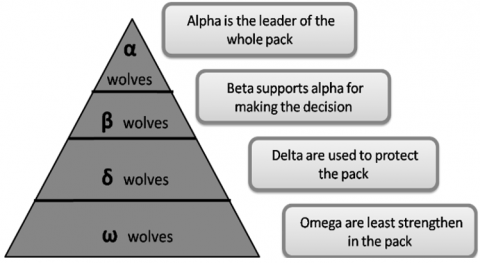
Based on a pack of grey wolves' social order and hunting methods. This method looks for the best answer while generally mimicking the traits of the grey wolf population. The distinctive hunting strategy used by the grey wolf colony inspired the creation of GWO, which generates the closest optimal answer using a number of built-in functionalities. The following Figure 5 depicts the leadership hierarchy, which is significant in this context and is explained as follows:
(a) Alpha Wolf: The leader and highest ranking member of the entire colony of grey wolves, the alpha wolf has the authority to rule over and order the entire group of wolves.
(b) Beta Wolf: Alpha wolves receive regular reports from beta wolves, who back them. They also help the dominant wolf make the best decisions possible.
(c) Delta Wolf: The omega wolf is superior to the delta wolf, who is subservient to the beta wolf and constantly updates the alpha and beta wolves. These are the wolf pack's guardians.
(d) Omega Wolf: Omega wolves are in charge of eliminating the wolves in the population of grey wolves. Additionally, they are in charge of raising juvenile wolves.
Figure 5. Leadership hierarchies of gray wolves
Because of the social order, the entire colony of grey wolves hunts its prey in packs or groups using a very specific method and special strategy. To remove the prey from the herd, they cooperate in packs while hunting. The delta and beta wolves then pursue and attack the intended prey after the omega wolves have successfully separated it from the herd.
As shown in Figure 6, the framework represents a problem-independent optimization algorithm consisting of four main stages: searching for prey, encircling prey, hunting, and attacking prey. The algorithm performs a global search by maintaining multiple candidate solutions. These solutions are categorized into four groups based on their fitness values: alpha (the best solution), beta (the second-best solution), delta (the third-best solution), and omega (the remaining solutions). The alpha, beta, and delta wolves guide the search process, while the omega wolves follow their directions.
Figure 6. Four steps of IGWO
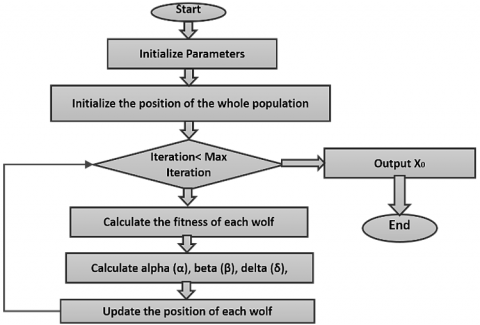
Figure 7. Flow of the GWO algorithm
The phases and progression of the GWO algorithm are depicted and described in Figure 7.
Step 1: The grey wolf searches for and tracks prey.
Step 2: The grey wolf guides the pack to encircle the prey from all sides.
Step 3: The $\alpha$ grey wolf commands the $\beta$ and $\delta$ wolves to attack the prey.
Step 4: If the prey runs away, the rear-supplied canines will chase after it.
The canines continue to attack the prey until they ultimately capture it.
Step 5: Following the prey search. Mathematically, the enclosure actions of grey wolves are represented by Eqs. (2) and (3).
$D=|C X(i)-X(i)|$ (2)
$(i+1)=(i)-A D$ (3)
where, C represents the control coefficient and A represents the convergence factor;
Step 6: The control coefficient formula is C = 2r1, where r1 is the random variable between 0 and 1. As defined by Eqs. (4) and (5), the convergence factor A is denoted by:
$A=2 a r 2-a$ (4)
Anda $=2\left(1-\frac{i}{i_{max }}\right)$ (5)
The random variables r1 and r2 enable the canines to attain any position between two given positions (points).
Step 7: The alpha wolf commands the group to encircle the prey after the grey wolves have captured it. After that, the wolf commands the other wolves to catch the prey. Using the locations of the, and wolves, the closest to the target, the prey's position may be found.
$D \alpha=|C 1(i)-X(i)|$ (6)
$D=|C 2(i)-X(i)|$ (7)
$D \delta=|C 3(i)-X(i)|$ (8)
$X 1=X \alpha-A 1 D \alpha$ (9)
$X 2=X \beta-A 2 D \beta$ (10)
$X 3=X \delta-A 3 D \delta$ (11)
Step 8: The proximity among (i) and $\alpha, \beta$, and $\delta$ wolves. Lastly, Eq. (8) is used to calculate the position of the canines as they approach their prey.
$X(i+1)=\frac{X_1+X_2+X_3}{3}$ (12)
Using the aforementioned GWO methodology, NN weights are optimised to provide more precise network features, as explained in the suggested method. The goal function for the multicolored-quality-improving optimisation procedure in this case is the amount of NMI. Prepare the k-means grouping of the properties that this network model has learnt. On the raw features, or CNN outputs, clustering is done. The features of learned labels or the target picture are prepared for cluster in exactly the same way. The conditioning labels from the fundus picture data are chosen here as an additional cluster. The NMI of these two clusters is then computed, as this is the objective function. This value is to be minimized, as a suitable normalized NMI value tends towards 1, and a minimum value of 0.65 is attained here. The extracted features are then used for classification in subsequent experiments.
3.7 Predictive rules framework for multi-level Classification
A Spectral Classifier with Predictive Rules (SC-PR) architecture for DR testing is created using fundus pictures. The four stages of the SC-PR framework are feature choices, feature extraction, spectrum classification for assessment, and predictive rule development for early identification. An effective automatic and helped DR diagnostic system is created during the feature selection stage by choosing potential fundus imaging characteristics. Next, each region's features are retrieved utilising feature clustering distinct attributes. Spectral classifier thoroughly classifies the affected region as normal, mild, moderate, or severe based on retrieved characteristics. They invented the Automatic Identification of Optic Disc and Macula (AD-OM) to enhance the performance of the optic disc and macula detection by integrating different systems' projections. The ADOM approach improved how well DR illnesses functioned. The AD-OM approach, however, proved useless for early detection.
Furthermore, developed a Detecting Optic Disc Boundary (DODB) in Digital Fundus Imagery that used a voting-style method to improve the detection rate by combining morphological and edge recognition technologies. The DODB approach enhanced DR illnesses' functionality. But DODB's effectiveness was inadequate for DR illnesses' early detection. To increase the effectiveness of DR disease prevention, the SC-PR system was created as in Figure 8.
Figure 8. Spectral Classifier with Predictive Rules paradigm for diagnosing and predicting diabetic retinopathy
By utilising a spectral classifier and prognostic rule power plant, the SC-PR system successfully detects and predicts the development of DR using computerized retinal pictures. Using points of interest that have been collected from the test as well as education sequences, the spectral classifiers accurately diagnoses the sick level. Applying the proportional backing and trust criteria improves classification accuracy by predicting DR accurately. Therefore, the SC-PR framework improves DR illness diagnostics and early identification. The SC-PR framework is detailed in more depth in the next subsections.
They created a system that detects new blood vessels in retinal pictures. An automated technique uses a dual classification approach, in which multiple vessel segmenting methods are used in order to generate two different discrete vessel mapping.
Each vessel has relevant information. Each binary vessel map generates two 4-D feature vectors from local morphological characteristics. Then, each feature vector was separately categorised by a computer-assisted technique using a SVM classifier. The final result is then reached by combining these individual findings using a computerized process. Next, a genetic algorithm-based feature selection technique is used to find feature subsets that improve classification performance. Insufficient sensitivity exists for illness diagnosis, however. The SC-PR architecture is suggested as a way to get around these limitations. For effective DR illness recognition, the SC-PR approach used a spectroscopic classification and a predictive rule power source, which enhanced disease diagnostic sensitivity compared to an automated technique.
An automated approach for the combination identification of DR and diabetic maculopathy was created process using blurry images methods. Identification of retinal features, such as the macula, also known as the fovea, the vessels that carry blood, and the disc that contains the optics, is one of the imperfect preprocessing of images approaches. Following the feature extraction, categorization is carried out using ML methods. Imprecise computational image analysis approaches boost sensitivity but not specificity, then which is inadequate for illness diagnostics. Reduce illness diagnostic specificity using the SC-PR methodology. The SC-PR approach identifies DR illness utilising a spectral a classification algorithm, which is less specific than fuzzy preprocessing of photographs.
3.8 Multi-level classification for Diabetes Retinopathy Diagnostics
The SC is used in the SC-PR architecture to accurately detect DR. Based on differences and similarities measurements of characteristics in distinct sequences (i.e., different photos), the SC is derived. For every interval of time, each recovered set of characteristics is "ResFE = r1, r2, ..., rn," where "n" is the quantity of sampled attributes. Let's put the derived attributes like this:
$R=r_1, r_2, r_3, \ldots, r_n$ (13)
"r1, r2, ..., rn" represent the total amount of extracted features and the amount of retrieved features in "R" that follow Eq. (14). The following mathematically formed function is assessed in order to obtain the number of elements from the retrieved features:
$\mathrm{P}=\left[\mathrm{p}_1, \mathrm{p}_2, \mathrm{p}_3, \ldots, \mathrm{p}_{\mathrm{n}}\right]=\frac{\mathrm{abs}(\mathbb{R})}{\operatorname{MAX}(\operatorname{ABS}(\mathbb{R}))}$ (14)
Based on the expression (5.2), each element "pi" of "P" represents the related element's points. The element "pi = 1, 2, 3, ..., n" represents the spectrum of selected elements for more categorization. Each spectrum is normalised using the utmost number of selected elements. Assume the test procedure is "pi = 1, 2, 3, ..., n" and the training procedure is "P s = p1 s, p2 s, ..., pi s, ... pn(s)". The mathematical expressions for the test sequence "$\text{Test}\,_{\text {seq }}$" and the training sequence "$\text{Train}\,_{\text {seq }}$" are as follows:
$\text{Test}\,_{\text {seq }}=\left[p_1(0), p_2(0), \ldots, p_m(0), \ldots, p_n(0)\right]$ (15)
$\text{Train}\,_{\text {seq }}=\left[\begin{array}{c}\mathrm{P}(1) \\ \mathrm{P}(2) \\ \ldots \\ \mathrm{P}(\mathrm{s}) \\ \ldots \\ \mathrm{P}(\mathrm{K})\end{array}\right]=\left[\begin{array}{c}\mathrm{p}_1(1) \mathrm{p}_2(1) \mathrm{p}_{\mathrm{m}}(1) \mathrm{p}_{\mathrm{n}}(1) \\ \mathrm{p}_1(2) \mathrm{p}_2(2) \mathrm{p}_{\mathrm{m}}(2) \mathrm{p}_{\mathrm{n}}(2) \\ \ldots \\ \ldots \\ p_1(\mathrm{s}) \mathrm{p}_2(\mathrm{s}) \mathrm{p}_{\mathrm{m}}(\mathrm{s}) \mathrm{p}_{\mathrm{n}}(\mathrm{s}) \\ \ldots \\ \mathrm{p}_1(\mathrm{k}) \mathrm{p}_2(\mathrm{k}) \mathrm{p}_{\mathrm{m}}(\mathrm{k}) \mathrm{p}_{\mathrm{n}}(\mathrm{K})\end{array}\right]$ (16)
$c(K)=\frac{\sqrt{\left(\operatorname{Diff}(\mathrm K)^2\right)}}{\Delta \operatorname{Diff}_{max }-\Delta \operatorname{Diff}_{min }}$ (17)
where,
$\Delta \operatorname{Diff}_{max }=\operatorname{MAX}[\Delta \operatorname{Diff}(\mathrm{k})]$ (18)
$\Delta \operatorname{Diff}_{min }=\operatorname{MIN}[\Delta \operatorname{Diff}(\mathrm{k})]$ (19)
When "m = 4, the sick level's classification dimension is lowered from "= c 1, c 2, ..., c(K)". There are four main classifications: "Normal, Mild, Medium, and Extreme." method 1 shows the Spectral Classifier method for identifying diabetic retinal detachment using digital foundation pictures:
|
Algorithm 1. Multi-level classification techniques |
|
Input: Image, Imagei = Image1, Image2, …, Imagen, Test sequence, Testseq, Training sequence, Trainseq Output: Increased the sensitivity and specificity rates 1: Begin 2: For every digitalized fundus image, Imagei 3: For every Test sequence, Testseq 4: Depending on the sliding window, choose the features 5: Area, convolution, and attributed ratio were used to extract the desired attributes, which were then stored in R. 6: For every extraction attribute, R 7: Obtaining the number of range from the extraction attributes using 8: Estimation means 9: Evaluate classification of diseased level store it in $\alpha$ 10: If $\alpha$ = c(1), c(2), c(3),…,c(k) 11: Name the class to which it belongs, Normal, Mild, Moderate, Severe 12. End all |
The SC-PR framework uses a spectroscopic classification to categorise illness severity as typical, mild, moderate, or serious, as shown in Algorithm 1. By computing the average from train as well as test patterns a spectral classifierscategorises the illness their level predicated on the collected features. The resulting number shows what category the sick level included in "belongs to. This improves disease categorization for DR. As a result, the SC-PR approach enhances both the specificity and the sensitivity of diabetes-related retinal for disease identification.
To identify and interpret vascular features in retinal pictures, it established a procedure for segmenting retinal vessels. The shape of the retinal blood vessels helps to classify the severity and distinguish the various disease's developmental phases. Variations in the retinal vessel's diameter are a sign of disorders with vascular pathology. Each picture pixel is classified as either an artery or a non-vessel using a method called retinal vascular categorization, which improves the precision of categorization for determining the presence of diabetes-related retinopathy. Classification accuracy isn't enough for early DR identification. Additionally, DR disease diagnostic sensitivity and specificity were poor. To overcome this, the SC-PR architecture is built. The SC-PR framework utilised in spectral classification for the purpose of identifying DR recognition increases the ability to classify reliability in early detection of the condition compared to the ocular vascular segment method. Thus, the SC-PR paradigm is more sensitive and specific than retinal vascular segmentation for diabetes-related eye early identification.
3.9 Analytical rule generative for premature recognition
An algorithm for the early identification of illness is created after diabetic retinal degenerationon digital fundus pictures has been identified. The set of prospective employees is produced using a spectral multicolored. Attribution sets that to be able to recognise DR supports "min_ sup" and minimum trust "min_ conf" requirements are not included in the analysis. The weighted support "w_ sup" and weighted confidence "w_ conf" are found by the record dimensions for every characteristic set and classification of classes.
Table 1. Factors for identifying diabetic retinopathy
|
HbA1c – Level |
Indication |
Range |
|
4%-5.6% |
Range in Normal |
0.10 |
|
5.7%-6.4% |
High risk in diabetics |
0.20 |
|
Indicates diabetics |
0.03 |
|
Eye Blood Pressure |
Indication |
Range |
|
115 over 75 mmHg |
Range in Normal |
0.04 |
|
120 over 80 mmHg |
BP are on Ideal |
0.05 |
|
140 over 90 mmHg |
High risk |
0.06 |
|
Optic Disc Size |
Indication |
Range |
|
1.5 mm |
Size in Normal |
- |
|
1.8 mm to 2 mm |
High risk of diabetics |
- |
|
> 2 mm |
Indicates diabetics |
- |
|
Ground Truth Confidence Level |
Indication |
Range |
|
0-50% |
Range in Normal |
- |
|
50-90% |
Probability for diabetics |
- |
|
90-100% |
Indicates diabetics |
- |
In DR with high HbA1c, blood pressure is significant. The SC-Pnmethodology thus gives any attribute value connected to this value of test the most weight, even though several values for other attributes having an impact on an evaluation of DR. Therefore, the SC-PR paradigm is taken into account for these two factors. Table 1 displays the weight of two different characteristics for estimating the likelihood of diabetic 102 hemorrhage and represents both the required assistance and the bare-bones assurance level. Additionally, for the detection of diabetes-related retinopathy, real-world confidence levels are calculated based on multicolored hemorrhaging and hard and soft fluid exudates The SC-PR also evaluates the size of the disc's optic nerve when identifying retinopathy caused by diabetes, as indicated in Table 1.
$W_{\_} sup (R)=\frac{\text { sum of record weight having } H b A 1 c=6.2 \% \text { and } B P=140 / 90}{\text { sum of weight of all transactions }}$ (20)
After calculating the weighted supported value, every attribute set that does not meet the "min_conf" threshold thresholds is removed using the proportional assurance (w_conf) number (Table 2). The weighted assurance is calculated as the difference between proportional support "A" and proportional supported "B." Consequently, weighted certainty 'w_conf' is calculated utilising the formula below.
$w_{\text {conf }}(R)=\frac{w_{-} sup (A \cup B)}{w_{-} sup (A)}$ (21)
The weighted probability of the rule "R" wherein (HbA1c = 6.2%) -> (Bp = 140/90) is calculated using the subsequent mathematical structure.
$w_{\text {conf }}(R)=\frac{\text { sum of record weight having } {HbAl}=6.2 \% \text { and } B P=\frac{140}{90}}{\text { sum of record weight having } {HbAl}=6.2 \%}$ (22)
Similarly to this, both weighted supporter ('w_sup') and proportional confidence ('w_conf') are calculated for all characteristics before the constraints are formed. The created predictive guidelines, or "PR," have the form '$\left(A_i, B_j\right),\left(A_m, B_n\right), \ldots,\left(A_n, B_n\right) \rightarrow R$' where '$R \in \alpha$', where "R" denotes the class that was produced using the algorithm-generated prognostic rules as the basis.
|
Algorithm 2. Predictive rule mining algorithm |
|
Input: Image… Imagei = Image1, Image2, …, Image3, minsup, minconf, Rules,support. Output: increased classification precision 1: Begin 2: For every image Imagei 3: Evaluate min support, minsup based on a Table 1 4: Evaluate min confidence minconf based on a Table 1 5: Assign wsup for rule R 6: Assign wconf for rule R 7: End for 8: End |
The approach used for predicting rule mining correctly forecasts the early warning rule generated identification of diabetic retinal degeneration on digital retinal pictures, as demonstrated in the second example. If the rule "R" meets the minimum level of support, minsup (where (Ai,Bj), (Am,Bn), …, (An, Bn)→R>minsup) and the minimal confident barrier, minconf (where (Ai,Bj), (Am,Bn), …, (An, Bn)→R>minconf).then this is only done. This improves the reliability of classification while helping in the early diagnosis of diabetic retinal illness.
It created a multivariate classifier based on m-Mediods to recognise aberrant blood vessels and grade DR. This multivariate m-Mediods-based classification system uses a multilayer thresholding algorithm and Hough evolve to first identify the vascular anatomy and optic disc. A multivariate m-Mediods-based classifiers algorithm identifies the retinal fundus picture accordingly to the different forms of retinopathy caused by diabetes using classifications and the position of the optical disc. Superior precision can be obtained in the diagnosis and grading of diabetes-related retinal illnesses by the multidimensional m-Mediods-based classification system, however early detection of the condition is not possible. The SC-PR framework's goal is to increase the effectiveness of early diabetes-related retinal disease identification. The SC-PR framework generates a predictive rule for early disease detection based on a candidate set generated by a spectral classifier. Consequently, the SC-PR framework outperforms a multivariate m-Medievals-based classifier in terms of early detection.
This section describes the metrics used in our experiments to evaluate databases in this part. Here, we summarize the testing results and conduct a comparison with alternative approaches.
4.1 Dataset description
Utilized APTOS 2019 as well as IDRiD, two separate datasets, to assess the effectiveness of the recently implemented methodology.
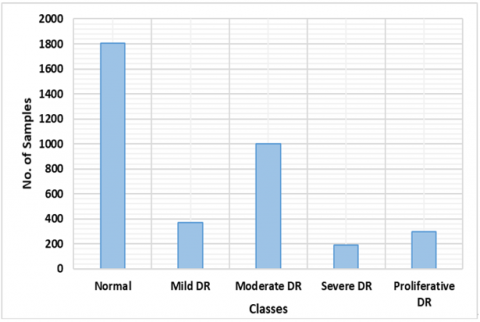
Figure 9. APTOS-2019 dataset distribution by class
Used the APTOS-2019 [21] and IDRiD [34] publicly accessible datasets to assess the DR and DME identification as well as classification accomplishments of our proposed methodology. The database itself has 3662 retina specimens entirely, which are grouped into five groups (negative, moderate, mild, moderate proliferative, and extreme DR), as illustrated in Figure 9. There are 1805 examples that belong to the first class, which is also known to be negative DR. There are 370, 999, 193, and 295 pictures, as well, that belong to the other categories, which are also known as moderate, severe, moderate, and proliferative DR. A total of 516 photos make up the IDRiD dataset, 413 of which were chosen from the instructional set and the balance of 103 from the control group set. Each of the samples includes a grading ground-truth based on the DR (5 classes) and DME kinds of eye abnormalities (3 classes).
4.2 Assessment metrics
Various evaluation metrics, such as Intersection through Union (IOU), precision, recall, accuracy, and MAP were used to assess our suggested method (mAP).
$Accuracy=T P+T N(T P+F P+T N+F N)$ (23)
Eq. (9) illustrates the mAP, where q is the test or query picture and AP stands for the mean accuracy of every class. Q represents the entire sample of test pictures.
$D S C=m A P:=\sum_{i=1}^Q \frac{A P\left(q_i\right)}{Q}$ (24)
4.3 Analysis
DNN-based object recognition systems were tested for eye illness categorization. We evaluated these networks' acknowledgment authority with various tumors in a single specimen and moles of various types (DR and DME) to see if they could differentiate among both normal and influenced eye regions with varied background conditions.
To do this, one-phase (CornerNet) and two-phase detectors, both of which are object recognition models, were taken into consideration. The fundamental difference among the two models is that detection with two phases identify the primary component in an image by employing a number of area suggestion approaches, which are subsequently reduced down, before carrying out the ultimate categorization task. Single-stage detector specify the principal objects' category and positioning fields are in single step.
We performed the evaluations of all object-detection classifiers using the modified AP measure, which scientists frequently utilise for recognizing image difficulties. We also evaluated each model's test length to assess computational complexity. The results show that the proposed framework has the greatest mAP value with the quickest test time. While the results of ResNet-101's Mask-RCNN are comparable to those of the suggested method, its operational cost is higher due to its two-phase detectors system. Furthermore, the corners approach fails to pick even small lesions in single-stage detection systems. By utilising the unique CenterNet with DenseNet-100 baseline system model, the proposed method more effectively addresses the drawbacks of the one-stage and dual-stage detectors currently in use. CenterNet can acquire a more representative collection of features thanks to DenseNet, which helps it find different categories of eye lesions more effectively. Furthermore, CenterNet has a computational edge over other models due to the fact that it is a one-stage detector. Table 2 shows the comparative results, which demonstrate that our suggested method gets 96% mAP, which is better than all other techniques.
Table 2. Comparing performance of proposed techniques
|
Technique |
mAP |
IoU |
Time(s) |
|
Faster RCNN |
0.962 |
0.999 |
0.45 |
|
MaskRCNN |
0.920 |
0.930 |
0.43 |
|
CornerNet |
0.966 |
0.981 |
0.43 |
|
Proposed |
0.990 |
0.874 |
0.21 |
4.4 Disease lesions' locations
In order to make a good model for automating the discovery of eye tumors, conditions of the eye must be correctly identified. To do this, we ran an experiment to see how well the suggested way worked for translation. We used mAP and IOU to measure the effectiveness of the stated method's ability to localise. These metrics aid in evaluating the rate at which the system can identify various kinds of eye lesions. When identifying DR and DME lesions from macular pictures, abnormalities are taken to be considered as positive while the surrounding regions, including the background as a whole, are taken into account as negative. More than 0.7% of the area has been impacted, and the part that overlaps is characterized with benchmark IOU. The regions are incorporated into the background when the IOU number is less than 0.3.
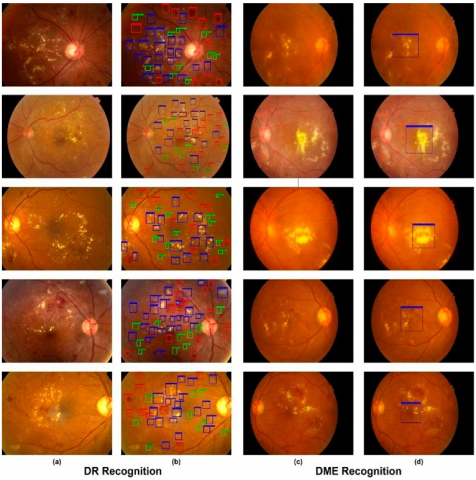
This model used the Custom CenterNet method in our tests to locate DR and DME lesions about pictures of the retina. Hemorrhages, microaneurysms, hard exudates, and soft exudates were all identified as lesions in the case of DR, whereas only the macula area was localised in the case of DME. Figure 10 displays the findings of the proposed method's localization for both diseases, including the lesion's location, class, and score of confidence for every region. For the DR in addition to DME lesions, respectively, we achieved the mAP of 0.96 as well as 0.965 along with the IoU for 0.973 and 0.975.
Figure 10. Simulation outcomes (a) Inputs (b) Outcomes of DR area multicolored: blue colour - hard exudates, green colour - microaneurysms, and red colour - blood vessels that are leaking (c) Images into the IDRiD collection (d) The results of DME's translation, (macula area)
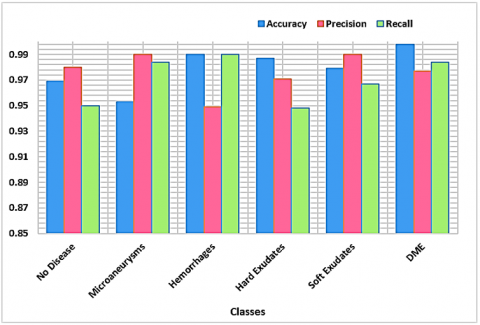
4.5 Classification of various classes
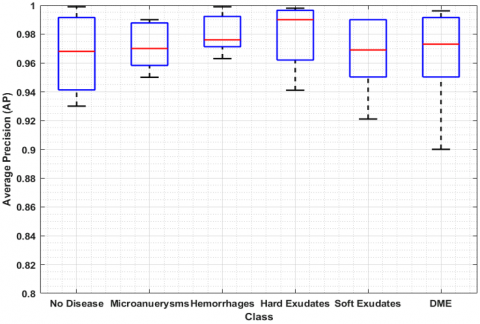
The suggested eye disease severity assessment technique was tested in our experiments. For classifying DR and DME, lessons learned Customizable CenterNet algorithms are fit to the test observations from the two datasets. Figure 11 shows how the study results changed at each step. Based on the results, the method has done a great job of recognising and classifying DR and DME from retina photos when it comes to of clarity, memory, and accuracy. In addition, our advanced technique's precise feature extraction with the aid of DenseNet-100 allows us to determine the degree of severity of eye disease with great efficiency. Due to the small number they have, it was difficult to accurately identify the DR along with DME diseases as well as the initial phases of DR before developing our method. Figure 12 is a box plot graphic that shows the AP outcomes. It is a good way to show the outcomes given that it shows the most significant, the smallest, and middle AP readings for every single one of the five categories of injuries.
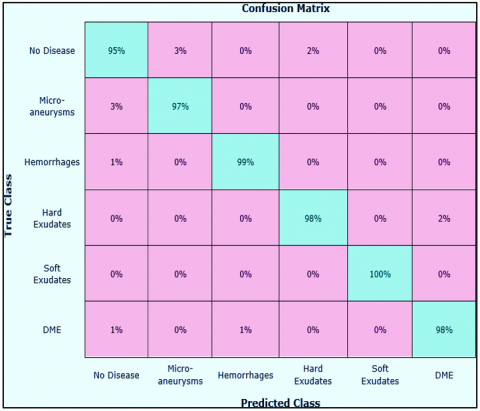
We also show the matrix of consternation to show that the proposed method is good at classifying things by class. This matrix can be used to show how well the Custom-CenterNet was able to guess the real class (Figure 13). The matrix of uncertainties shows that Customizable CenterNet has the best level of precision for classification for class and class alongside a rate of TPRs of 98%, while the preferred approach has an inferior rating for class (no disease) because it is more comfortable with class in terms of texture. (microaneurysms). Figure 13 shows the potency of our theory via demonstrating that the given method has a median FPR of about 2.16 percent. The given way also works exceptionally well for each of the additional classes.
Figure 11. Stage-by-stage application of the proposed method
Figure 12. Average precision results of the suggested technique
Figure 13. Confusion matrix
4.6 Compare and contrast
Implemented the suggested approach on a GPU-based system using the Python TensorFlow. We examined our shaded's results with the results of other methods utilizing the two different APTOS-2019 as well as IDRiD databases. We used the results from the comparative techniques suggested by references [35-37] for the APTOS-2019 database. The outcomes are displayed in Table 3. In contrast, we contrasted our findings regarding the IDRiD dataset with the results reported by the study [38] as well as the reference [39], and an accuracy analysis is shown in Table 4.
Table 3. Comparison of the Aptos-2019 dataset with cutting-edge methods
|
Method |
Accuracy (%) |
|
[35] |
97.41 |
|
[36] |
96.51 |
|
[37] |
84.31 |
|
Proposed |
97.93 |
Table 4. Comparative analysis using cutting-edge methods on the IDRiD dataset
|
Method |
Accuracy (%) |
|
[38] |
80.00 |
|
[39] |
67.96 |
|
Proposed |
98.10 |
The reported findings demonstrate that, in terms of accuracy, our method outperformed the comparable approaches. With a mean accuracy of 97.89% for the APTOS-2019 collections and 98.18% with the IDRiD a database, it is clear that our technique excelled previous approaches. The median precision of the comparing approaches was 92.79 on the APTOS-2019 database as well as 73.98 on that IDRiD collection; as an outcome, we can state that our methods outperformed them by 5.19% and 24%, respectively. The methods have a high computational expense and might not be able to find lesions of different sizes when there are drastic changes in light and colour. Despite the assistance of post-processing assaults such blurring, noise, color, light, and quantity fluctuations, the suggested design gives a useful set of characteristics that aid in locating the areas of inflammation. Furthermore, because of its single-stage object detection network, the proposed approach outperforms comparable methods in terms of computational efficiency. Hence, it can be said that the suggested method for classifying eye diseases is both successful and efficient.
4.7 Cross-dataset validation
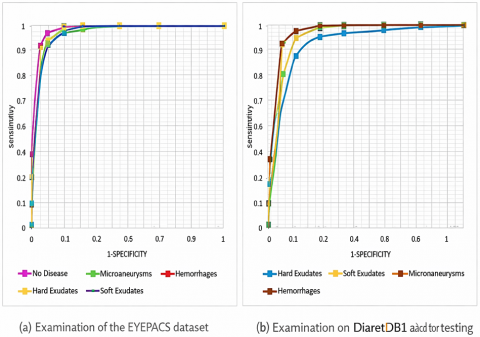
Conducted tests to evaluate how well our framework identified objects in a cross-database situation. Implementing cross-database validation is primarily done to evaluate how well the proposed technique generalises. To do this, we evaluated our technique using the EYEPACS [40] as well as Darietdb1 [41] databases after training it based on the APTOS-2019 as well as IDRiD datasets. EYEPACS is a difficult dataset with an overall of 88,704 samples and five different groups of lesions. The findings of the class-wise tests conducted using the EYEPACS as well as Diaretdb1 datasets are displayed in Figure 14(a). We represented the data in the form of ROC graphs. Figure 14(b) displays the area under the curve (AUC) values for the Diaretdb1 dataset, which has four classes or lesions, while Figure 14(a) displays the test findings for five categories within the EYEPACS data in terms of AUC. We can conclude from these tests or from the class-wise performance of the two datasets that the lesion detection capabilities of the work given are robust. As a result, it can be declared that the introduced method is reliable forclassifying and identifying DR and DME.
Figure 14. Performance of the suggested method across datasets (a) Examination of the EYEPACS dataset (b) the Diaretdb1 dataset for testing
Thereby, proposed model was trained and validated on diverse datasets such as APTOS-2019 and IDRiD, which include images with varying illumination, resolution, and noise levels, reflecting typical clinical screening conditions. This diversity helps improve the model’s robustness in handling low-quality and grainy images, as demonstrated by its ability to accurately detect DR and DME lesions even in challenging cases.
Furthermore, the system incorporates adaptive preprocessing steps—such as contrast enhancement and noise reduction—to mitigate image quality variations. Although detailed clinical false positive and false negative rates were not the primary focus of this work, initial validation results indicate that the model maintains a high sensitivity and specificity balance, minimizing both missed detections and unnecessary alarms. Future work will include prospective clinical trials to more rigorously evaluate these aspects in real-world screening environments.
In the effort to automate the detection and classification of DR and DME lesions, expert human input remains essential for accurately identifying subtle lesion locations in colored retina images and categorizing them with scoring systems. To address the limitations of conventional identification methods, our proposed framework offers a reliable automated solution leveraging specialized multicolored models and a DenseNet-100 feature extractor. Evaluated on two benchmark datasets, APTOS-2019 and IDRiD, the approach achieved high accuracies of 97.94% and 98.11%, respectively. Our results demonstrate the system’s capability to accurately detect and classify DR and DME lesions, even in low-intensity and noisy images, outperforming existing methods.
Looking ahead, we plan to enhance the system’s clinical applicability by integrating multimodal imaging data such as Optical Coherence Tomography (OCT) to capture deeper retinal structures and improve diagnostic precision. Additionally, we aim to address dataset biases by expanding training to include more diverse and representative populations, thereby increasing the model’s generalizability in real-world clinical settings. Further validation through prospective clinical trials will be pursued to rigorously assess false positive and negative rates in practical screening environments. Finally, we intend to extend our methodology to automate the detection of other retinal and ocular diseases, applying it to more challenging datasets to strengthen robustness and clinical impact.
[1] Zhao, X., Liu, Y., Zhang, W., Meng, L., Lv, B., Lv, C., Chen, Y. (2021). Relationships between retinal vascular characteristics and renal function in patients with type 2 diabetes mellitus. Translational Vision Science & Technology, 10(2): 20-20. https://doi.org/10.1167/tvst.10.2.20
[2] Björk, M., Melin, E.O., Frisk, T., Thunander, M. (2020). Admission glucose level was associated with increased short-term mortality and length-of-stay irrespective of diagnosis, treating medical specialty or concomitant laboratory values. European Journal of Internal Medicine, 75: 71-78. https://doi.org/10.1016/j.ejim.2020.01.010
[3] Saeedi, P., Petersohn, I., Salpea, P., Malanda, B., Karuranga, S., Unwin, N., IDF Diabetes Atlas Committee. (2019). Global and regional diabetes prevalence estimates for 2019 and projections for 2030 and 2045: Results from the International diabetes federation diabetes atlas. Diabetes Research and Clinical Practice, 157: 107843. https://doi.org/10.1016/j.diabres.2019.107843
[4] Tsalamandris, S., Antonopoulos, A.S., Oikonomou, E., Papamikroulis, G.A., Vogiatzi, G., Papaioannou, S., Tousoulis, D. (2019). The role of inflammation in diabetes: Current concepts and future perspectives. European Cardiology Review, 14(1): 50. https://doi.org/10.15420/ecr.2018.33.1
[5] Freeman, J. (2019). Management of hypoglycemia in older adults with type 2 diabetes. Postgraduate Medicine, 131(4): 241-250. https://doi.org/10.1080/00325481.2019.1578590
[6] Hod, M., Kapur, A., McIntyre, H.D., Prevention of early NCD Committee. (2019). Evidence in support of the International Association of Diabetes in Pregnancy study groups’ criteria for diagnosing gestational diabetes mellitus worldwide in 2019. American Journal of Obstetrics and Gynecology, 221(2): 109-116. https://doi.org/10.1016/j.ajog.2019.01.206
[7] Ferdousi, R., Hossain, M.A., El Saddik, A. (2021). Early-stage risk prediction of non-communicable disease using machine learning in health CPS. IEEE Access, 9: 96823-96837. https://doi.org/10.1109/ACCESS.2021.3094063
[8] Beevi, S.Z. (2023). Multi-Level severity classification for diabetic retinopathy based on hybrid optimization enabled deep learning. Biomedical Signal Processing and Control, 84: 104736.
[9] Yue, C., Xin, L., Kewen, X., Chang, S. (2008). An intelligent diagnosis to type 2 diabetes based on QPSO algorithm and WLS-SVM. In 2008 International Symposium on Intelligent Information Technology Application Workshops, Shanghai, China, pp. 117-121. https://doi.org/10.1109/IITA.Workshops.2008.36
[10] Çalişir, D., Doğantekin, E. (2011). An automatic diabetes diagnosis system based on LDA-wavelet support vector machine classifier. Expert Systems with Applications, 38(7): 8311-8315. https://doi.org/10.1016/j.eswa.2011.01.017
[11] Steena, T.B., Perumal, P., Suganthi, C., Asokan, R., Sreeji, S., Preethi, P. (2022). Optimizing image fusion using wavelet transform based alternative direction multiplier method. In 2022 2nd International Conference on Advance Computing and Innovative Technologies in Engineering (ICACITE), Greater Noida, India, pp. 2021-2024. https://doi.org/10.1109/ICACITE53722.2022.9823804
[12] Georga, E.I., Protopappas, V.C., Ardigo, D., Polyzos, D., Fotiadis, D.I. (2013). A glucose model based on support vector regression for the prediction of hypoglycemic events under free-living conditions. Diabetes Technology & Therapeutics, 15(8): 634-643. https://doi.org/10.1089/dia.2012.0285
[13] Albadr, M.A.A., Ayob, M., Tiun, S., Al-Dhief, F.T., Hasan, M.K. (2022). Gray wolf optimization-extreme learning machine approach for diabetic retinopathy detection. Frontiers in Public Health, 10: 925901. https://doi.org/10.3389/fpubh.2022.925901
[14] Preethi, P., Vasudevan, I., Saravanan, S., Prakash, R.K., Devendhiran, A. (2023). Leveraging network vulnerability detection using improved import vector machine and Cuckoo search based Grey Wolf Optimizer. In 2023 1st International Conference on Optimization Techniques for Learning (ICOTL), Bengaluru, India, pp. 1-7. https://doi.org/10.1109/ICOTL59758.2023.10435119
[15] Khan, A.Q., Sun, G., Khalid, M., Imran, A., Bilal, A., Azam, M., Sarwar, R. (2024). A novel fusion of genetic grey wolf optimization and kernel extreme learning machines for precise diabetic eye disease classification. PLOS One, 19(5): e0303094. https://doi.org/10.1371/journal.pone.0303094
[16] Krishnamoorthi, R., Joshi, S., Almarzouki, H.Z., Shukla, P.K., Rizwan, A., Kalpana, C., Tiwari, B. (2022). A novel diabetes healthcare disease prediction framework using machine learning techniques. Journal of Healthcare Engineering, 2022(1): 1684017. https://doi.org/10.1155/2022/1684017
[17] Harini, R., Sheela, N. (2016). Feature extraction and classification of retinal images for automated detection of Diabetic Retinopathy. In 2016 Second International Conference on Cognitive Computing and Information Processing (CCIP), Mysuru, India, pp. 1-4. https://doi.org/10.1109/CCIP.2016.7802862
[18] Siddalingaswamy, P.C., Prabhu, K.G. (2010). Automatic grading of diabetic maculopathy severity levels. In 2010 International Conference on Systems in Medicine and Biology, Kharagpur, India, pp. 331-334. https://doi.org/10.1109/ICSMB.2010.5735398
[19] Sukeerthi, G., Sindhu, R., Rakesh, K.R. (2017). Detection of micro aneurysm in fundus images for the monitoring of diabetic retinopathy. In 2017 2nd International Conference on Computational Systems and Information Technology for Sustainable Solution (CSITSS), Bengaluru, India, pp. 1-5. https://doi.org/10.1109/CSITSS.2017.8447609
[20] Palavalasa, K.K., Sambaturu, B. (2018). Automatic diabetic retinopathy detection using digital image processing. In 2018 International Conference on Communication and Signal Processing (ICCSP), Chennai, India, pp. 0072-0076. https://doi.org/10.1109/ICCSP.2018.8524234
[21] Yaşar, B., Yeşilkaya, B., Cura, Ö.K., Akan, A. (2018). A new method to detect diabetic retinopathy. In 2018 Medical Technologies National Congress (TIPTEKNO), Magusa, Cyprus, pp. 1-4. https://doi.org/10.1109/TIPTEKNO.2018.8596776
[22] Sinthanayothin, C., Boyce, J.F., Williamson, T.H., Cook, H.L., Mensah, E., Lal, S., Usher, D. (2002). Automated detection of diabetic retinopathy on digital fundus images. Diabetic Medicine, 19(2): 105-112. https://doi.org/10.1046/j.1464-5491.2002.00613.x
[23] Seoud, L., Hurtut, T., Chelbi, J., Cheriet, F., Langlois, J.P. (2015). Red lesion detection using dynamic shape features for diabetic retinopathy screening. IEEE Transactions on Medical imaging, 35(4): 1116-1126. https://doi.org/10.1109/TMI.2015.2509785
[24] Kukkar, A., Gupta, D., Beram, S.M., Soni, M. et al. (2022). Optimizing deep learning model parameters using socially implemented IoMT systems for diabetic retinopathy classification problem. IEEE Transactions on Computational Social Systems, 10(4): 1654-1665. https://doi.org/10.1109/TCSS.2022.3213369
[25] Anupama, B.C., Rao, S.N., Malini, M.B., Athreya, V.V. (2025). Comparative analysis of novel preprocessing techniques and deep learning based multi modal feature fusion for diabetic retinopathy grading. Scientific Reports. 16: 1743. https://doi.org/10.1038/s41598-025-31339-w
[26] Yu, S., Xiao, D., Kanagasingam, Y. (2017). Exudate detection for diabetic retinopathy with convolutional neural networks. In 2017 39th Annual International Conference of the IEEE Engineering in Medicine and Biology Society (EMBC), Jeju, Korea (South), pp. 1744-1747. https://doi.org/10.1109/EMBC.2017.8037180
[27] Chandran, A., Nisha, K.K., Vineetha, S. (2016). Computer aided approach for proliferative diabetic retinopathy detection in color retinal images. In 2016 International Conference on Next Generation Intelligent Systems (ICNGIS), Kottayam, India, pp. 1-6. https://doi.org/10.1109/ICNGIS.2016.7854014
[28] Dutta, A.K., Aljarallah, N.A., Sait, A.R.W. (2026). Diabetic retinopathy severity detection using an improved Whale optimization algorithm and convolutional Kolmogorov-Arnold network. Frontiers in Medicine, 13: 1709872. https://doi.org/10.3389/fmed.2026.1709872
[29] Yadav, J., Sharma, M., Saxena, V. (2017). Diabetic retinopathy detection using feedforward neural network. In 2017 Tenth International Conference on Contemporary Computing (IC3), Noida, India, pp. 1-3. https://doi.org/10.1109/IC3.2017.8284350
[30] Tjandrasa, H., Putra, R.E., Wijaya, A.Y., Arieshanti, I. (2013). Classification of non-proliferative diabetic retinopathy based on hard exudates using soft margin SVM. In 2013 IEEE International Conference on Control System, Computing and Engineering, Penang, Malaysia, pp. 376-380. https://doi.org/10.1109/ICCSCE.2013.6719993
[31] Yalçin, N., Alver, S., Uluhatun, N. (2018). Classification of retinal images with deep learning for early detection of diabetic retinopathy disease. In 2018 26th Signal Processing and Communications Applications Conference (SIU), Izmir, Turkey, pp. 1-4. https://doi.org/10.1109/SIU.2018.8404369
[32] Santhakumar, R., Tandur, M., Rajkumar, E.R., Geetha, K.S., Haritz, G., Rajamani, K.T. (2016). Machine learning algorithm for retinal image analysis. In 2016 IEEE Region 10 Conference (TENCON), Singapore, pp. 1236-1240. https://doi.org/10.1109/TENCON.2016.7848208
[33] Gurudath, N., Celenk, M., Riley, H.B. (2014). Machine learning identification of diabetic retinopathy from fundus images. In 2014 IEEE Signal Processing in Medicine and Biology Symposium (SPMB), Philadelphia, USA, pp. 1-7. https://doi.org/10.1109/SPMB.2014.7002949
[34] Chaturvedi, K., Bhandari, V., Kothari, A., Tekerek, A., Tiwari, R., Shrivastava, R. (2024). An intelligent approach to analyze severity levels of diabetic retinopathy by data classification using transfer learning. In International Conference on Data Science and Big Data Analysis, pp. 1-16. https://doi.org/10.1007/978-981-97-9855-1_1
[35] Porwal, P., Pachade, S., Kokare, M., Deshmukh, G., Son, J., Bae, W., Meriaudeau, F. (2020). Idrid: Diabetic retinopathy–segmentation and grading challenge. Medical Image Analysis, 59: 101561. https://doi.org/10.1016/j.media.2019.101561
[36] Bodapati, J.D., Naralasetti, V., Shareef, S.N., Hakak, S., Bilal, M., Maddikunta, P.K.R., Jo, O. (2020). Blended multi-modal deep convnet features for diabetic retinopathy severity prediction. Electronics, 9(6): 914. https://doi.org/10.3390/electronics9060914
[37] Bodapati, J.D., Shaik, N.S., Naralasetti, V. (2021). Deep convolution feature aggregation: An application to diabetic retinopathy severity level prediction. Signal, Image and Video Processing, 15(5): 923-930. https://doi.org/10.1007/s11760-020-01816-y
[38] Wu, Z., Shi, G., Chen, Y., Shi, F., Chen, X., Coatrieux, G., Li, S. (2020). Coarse-to-fine classification for diabetic retinopathy grading using convolutional neural network. Artificial Intelligence in Medicine, 108: 101936. https://doi.org/10.1016/j.artmed.2020.101936
[39] Luo, L., Xue, D., Feng, X. (2020). Automatic diabetic retinopathy grading via self-knowledge distillation. Electronics, 9(9): 1337. https://doi.org/10.3390/electronics9091337
[40] Priya, S. (2025). A novel deep learning approach for diabetic retinopathy classification using optical coherence tomography angiography. Multimedia Tools and Applications, 84: 38613-38651. https://doi.org/10.1007/s11042-025-20708-2
[41] Wei, X., Liu, Y., Zhang, F., Geng, L., Shan, C., Cao, X., Xiao, Z. (2025). MSTNet: Multi-scale spatial-aware transformer with multi-instance learning for diabetic retinopathy classification. Medical Image Analysis, 102: 103511. https://doi.org/10.1016/j.media.2025.103511