Temitayo M. Azeez*![]() | Humbulani S. Phuluwa
| Humbulani S. Phuluwa![]() | Lateef O. Mudashiru
| Lateef O. Mudashiru![]()
© 2025 The authors. This article is published by IIETA and is licensed under the CC BY 4.0 license (http://creativecommons.org/licenses/by/4.0/).
OPEN ACCESS
This study focused on the challenges of exploration connected with natural reinforced composites, like inconsistencies in the mechanical properties, including tensile and flexural strengths, and took luffa fibre and nano clay availability advantage (white clay) in the composite development, which focused on reducing these challenges. This research aims to develop a sustainable polymer matrix composite reinforced with white clay and luffa powder that has similar properties to automotive bumper tensile and flexural strength. These two properties were assessed on the developed composites using the Response Surface methodology (RSM) approach of Design Expert software. The findings revealed that luffa powder has a substantial impact on the mechanical properties of the composites, while diglycidyl epoxy exhibits the least impact. The tensile and flexural optimal settings were achieved at luffa powder (18.9045 g), white clay powder (9.07951 g), and diglycidyl epoxy (78.1207 g). These yielded 18.4466 MPa and 32.2467 MPa tensile and flexural strengths, respectively, at a desirability of 1.0. The model precisely forecasts the mechanical properties of the composite with a minimal percentage deviation between the predicted and experimental values. The research outcomes predict the ability of the developed composite to effectively function in automotive applications, especially in bumper production. The luffa fiber and nano-clay application enable sustainable and environmentally friendly substitutes to conventional materials in durability enhancement, and support for more effective automotive components.
polymer matrix, luffa fibre, nano clay, composite reinforcement
The need for sustainable and biodegradable materials has propelled the evolution of fiber-reinforced polymer composites, especially in the automotive and construction industries. Conventional materials such as concrete and steel have systematically replaced these composites owing to their unique properties, like cost effectiveness, low weight, and high strength [1]. Organic fibres, like luffa, are very popular because they are biodegradable, renewable, non-corrosive in nature, non-toxic, low-density, high-strength, and above all, they are very cheap. All these have substantially and positively impacted the environment [2]. However, organic fiber-reinforced composites encounter drawbacks like low longevity, lower strength, and lower moisture resistance compared to synthetic composites. To eradicate these challenges, different research has introduced different hybrid composites by merging a synthetic polymer matrix with natural fibre [3].
In this work, the manufacturing factors on establishing an efficient polymer matrix composite reinforced with nano clay and luffa fibre in automobile applications demand many important considerations that substantially impact the efficiency of the composite, longevity, and sustainability [4]. These factors comprise luffa fibre treatment by chemical techniques such as alkalization to improve interfacial bonding with polymer matrix, fibre proportion, nano-clay loading, and identification of the most adequate polymer matrix that enables efficient mechanical properties and compatibility. This factor assessment entails a detailed evaluation of the mechanical properties of the composite, like impact resistance, thermal resistance, moisture absorption ability, tensile and flexural strength, etc. [5, 6].
Experimental methods such as mechanical testing following ASTM procedures, scanning electron microscopy (SEM) for the analysis of morphology and assessment of thermal properties, require adequate application in assessing the varying operating factors. Therefore, these factors’ systemic variation and evaluation aim to establish the ideal settings for sustainable and high-performance eco-friendly materials composite development that tallies with automotive bumper application demand [7]. The target of this research is to formulate an efficient polymer matrix composite reinforced with nano clay to enhance the automobile bumper performance, employing Response Surface Methodology (RSM) of Design Expert software for the composite’s mechanical properties prediction and optimization.
The relationship between nano clay materials and Luffa powder on composite mechanical behavior will be established using RSM, which is a component of the Design Expert software. Specifically, the properties such as flexural and tensile strength will be assessed. Through this study, the challenges of producing high fibre-based composites with highly efficient and performance materials suitable for the automotive industry will be addressed.
2.1 Materials and equipment used
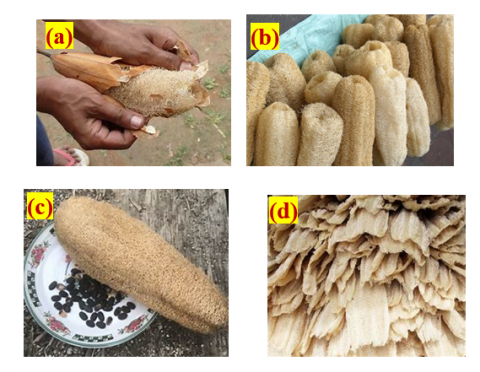
The epoxy composites reinforced with luffa fibre and nano clay development involve the combination of different materials and equipment usage. Epoxl resin was considered as the matrix material owing to its bonding ability and unique mass-to-strength ratio. 50 g of HV-953-IN hardener was used in the curing process, while the dried luffa (Figure 1(a)), which is in abundance in Nigeria, was obtained from a local farm. Various equipment was employed in the production and testing of the composites, some of which include a glass stirrer, mixing bowl, measuring cylinder, blender, scissors, and a Universal Tensile Machine to carry out the mechanical testing of the composite.
Figure 1. Pictures of (a) dried luffa, (b) dehusked luffa, (c) deseeded luffa, (d) luffa strips
2.2 Materials preparation
2.2.1 Luffa fiber preparation
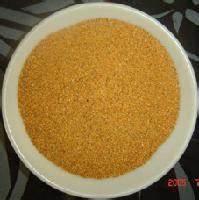
Dried luffa pieces were stripped of their husks (Figure 1(b)), seeds were removed (Figure 1(c)), and the fruit was cut into long pieces using scissors (Figure 1(d)). Three kilograms of luffa fiber were treated with 0.1 M NaOH solution for 1 hour at room temperature. The fibers were then washed with distilled water to remove impurities and sun-dried for 48 hours. The dried fibers were mechanically milled at 300 revolutions per minute for 2 hours and sieved to obtain micro-sized luffa particles (20-100 µm) (Figure 2).
Figure 2. Milled luffa powder
2.2.2 Nano-clay preparation
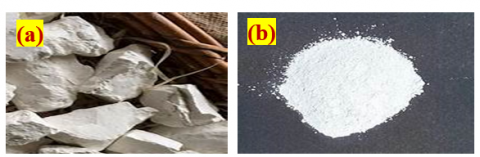
Six kilograms of white clay (Figure 3(a)) were sourced from multiple regions in Nigeria (Ilorin, Ekiti and Akure) to reduce sampling bias. The clay was washed to remove impurities, dried at room temperature for 12 hours, and mechanically milled at 300 revolutions per minute. The milled clay was sieved into two mesh size ranges: -20 μm (particles passing through a 20 μm sieve) and -100 to +20 μm (particles passing through a 100 μm sieve but retained on 20 μm sieve) as presented in Figure 3(b).
Figure 3. White clay (a) un-milled, (b) milled
2.3 Experimental design with model formulation and optimization
Experimental design of the required composite samples was achieved using Design Expert software version 6.0.8 to investigate the effect and interactions of micro-Luffa powder, nano-clay powder, and diglycidyl epoxy ratios on the composite material. The experimental range of the variables is presented in Table 1. The influence of the amount composition of some materials, such as luffa powder, clay powder, and diglycidyl epoxy, was evaluated on the tensile and flexural strength of different composite materials using RSM, an effective modeling and analytical approach with a variety of applications. According to Tables 1 and 2, the experiment was created using the RSM approach of the Design Expert software. Tensile and flexural strength values were chosen as the dependent factors (responses), whereas percentage composition of luffa powder, clay powder, and diglycidyl epoxy was chosen as the independent variables.
Table 1. Experimental design variables
|
Factors |
Level |
||||
|
|
Code |
-1 |
+1 |
-alpha |
+alpha |
|
Luffa powder (g) |
L |
12 |
20 |
9.27 |
22.72 |
|
Clay powder (g) |
C |
8 |
15 |
5.61 |
17.38 |
|
Diglycidyl epoxy (g) |
D |
70 |
80 |
66.59 |
83.41 |
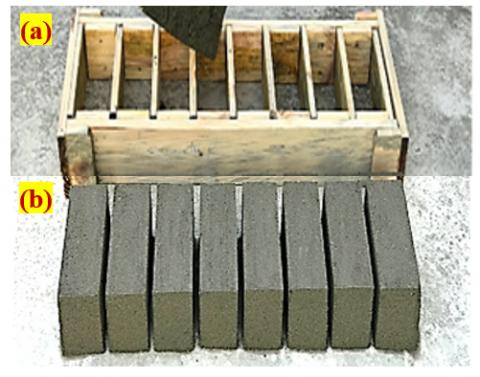
Twenty samples of different percentages of formulations were carried out based on the RSM recommendation (Table 2). The composition proportion of luffa powder ranges from 12 to 20 grams, clay powder ranges from 8 to 15 g, while diglycidyl epoxyl ranges from 70 to 100 g. Both the epoxy resin and the curing agent hardener were mixed in the ratio 10:1. The weight proportion of both the luffa fiber and clay powder was measured using a beam balance and serially mixed with epoxy resin/hardener. To ensure uniformity, the luffa fibers were dried for 2 hours at 60℃ for moisture content control, and the mixing procedure was carried out in a temperature-controlled condition (23 ± 2℃) for reducing curing temperature fluctuations. The composite was gently stirred for 5 minutes and poured into a prepared wooden mold. Eight cups, wooden molds of dimension 150 mm by 100 mm by 5 mm each, shown in Figure 4(a), were used for casting the composite presented in Figure 4(b). This will enable faster casting of larger numbers of composites at a time.
Table 2. Range of materials composition in design models
|
Sample No. |
Coded Value |
Original Value |
||||
|
|
L |
C |
D |
Luffa Powder (g) |
Clay Powder (g) |
Diglycidyl Epoxyl (g) |
|
1 |
-1 |
-1 |
-1 |
12 |
8 |
70 |
|
2 |
1 |
-1 |
-1 |
20 |
8 |
70 |
|
3 |
-1 |
1 |
-1 |
12 |
15 |
70 |
|
4 |
1 |
1 |
-1 |
20 |
15 |
70 |
|
5 |
-1 |
-1 |
1 |
12 |
8 |
80 |
|
6 |
1 |
-1 |
1 |
20 |
8 |
80 |
|
7 |
-1 |
1 |
1 |
12 |
15 |
80 |
|
8 |
1 |
1 |
1 |
20 |
15 |
80 |
|
9 |
-α |
0 |
0 |
9.27 |
11.5 |
75 |
|
10 |
+α |
0 |
0 |
22.72 |
11.5 |
75 |
|
11 |
0 |
-α |
0 |
16 |
5.61 |
75 |
|
12 |
0 |
+α |
0 |
16 |
7.39 |
75 |
|
13 |
0 |
0 |
-α |
16 |
11.5 |
66.59 |
|
14 |
0 |
0 |
+α |
16 |
11.5 |
83.41 |
|
15 |
0 |
0 |
0 |
16 |
11.5 |
75 |
|
16 |
0 |
0 |
0 |
16 |
11.5 |
75 |
|
17 |
0 |
0 |
0 |
16 |
11.5 |
75 |
|
18 |
0 |
0 |
0 |
16 |
11.5 |
75 |
|
19 |
0 |
0 |
0 |
16 |
11.5 |
75 |
|
20 |
0 |
0 |
0 |
16 |
11.5 |
75 |
In this work, a quadratic response surface model was employed, factoring in all linear, interaction, and square terms (Eq. (1)) [8]. This model enables the relationship analysis between the independent variables (luffa powder, clay powder, and diglycidyl epoxy) and the dependent variables (tensile and flexural strength). The quadratic response surface model, which includes linear, interaction, and quadratic terms, was used to describe the relationships (Eq. (1)).
$\begin{gathered}\mathrm{A}=\alpha_o+€ \sum_{m=1}^l \alpha_m x_m+ \sum_{m-1}^l \alpha_{m n} x_m x_n+\sum_{m=1}^l \alpha_{m m} x_m^2+\varepsilon\end{gathered}$ (1)
where, A = predicted response, αo= overall mean, αm= linear effect of the input factors xm, αmn= linear by linear interaction effect, αmm =quadratic effect of the input factor xm, Ɛ= random error term. A mathematical formulation with various regression equations and second-order best fits was created. Multiple regression analysis was performed on each outcome using the provided equations. Analysis of variance (ANOVA) was used to analyze the model's significant terms for each output. The evaluation of the significance level was done using the probability level that, when determined, was less than 5%. R2, adjusted R2, predicted R2, and prediction error sum of squares (PRESS) were applied to assess the model's adequacy. To confirm the ANOVA premise, residual analysis was performed after the model fit. The Levene’s test was also conducted to validate the ANOVA results using Microsoft Excel. The desirability function method was used to achieve fitting through the maximization and minimization of polynomials. The degree to which the response matches the ideal value is indicated by its desirability, which ranges from 0 to 1 [9]. The RSM response optimizer was used to find the ideal settings that gave the best results in terms of tensile and flexural strength.
Figure 4. Presentation of (a) wooden mold, (b) cast composites
2.4 Testing methods
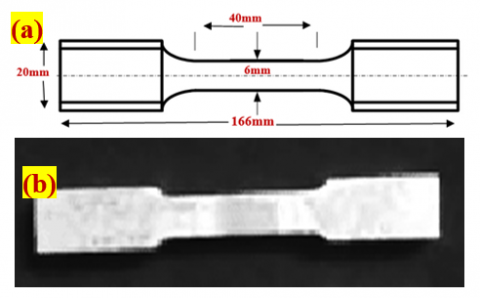
ASTM-D638 standard [9] testing procedures were employed in evaluating the tensile strength of all the composites machined to the dimensions of 166 mm × 20 mm × 6 mm with 40 mm gauge length as presented in Figure 5(a) and Figure 5(b). The tensile testing is followed by subjecting the already machined specimen to a pulling force and crosshead speed of 500 kN and 5mm/min, respectively, on a Universal Testing Machine (Instron 5906). This test was carried out at a room temperature of 23℃ ± 3℃. The maximum load reached before fracture was noted to determine the maximum load at which failure occurred.
Figure 5. Machine tensile specimen (a) dimension, (b) sample
ASTM D790 [10] standard testing procedures were employed in the specimen’s flexural testing by machining the sample to dimensions 128 mm × 12.8 mm × 5.5 mm. This was followed by a bending setup in three distinct positions using a 100 mm span to initiate bending on the specimen at 2mm/min crosshead speed. The load at which the bending occurred was noted. The respective strength values of both flexural and tensile were evaluated using the displacement data obtained during testing. The specimens were carefully handled to prevent undue damage that may affect the results’ values, and there is proper monitoring and control of the testing procedure to ensure the reliability and accuracy of the results.
3.1 Flexural and tensile strength values
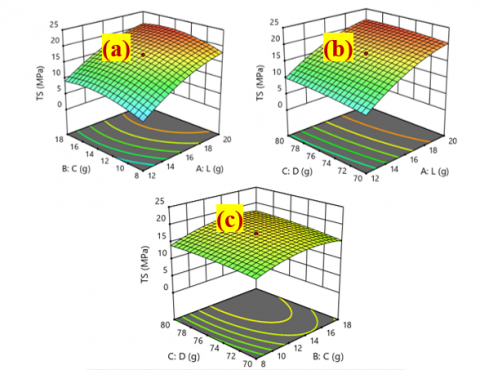
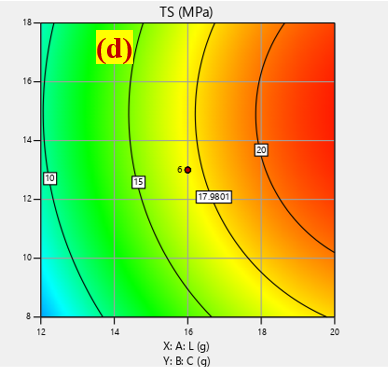
The average values of both flexural and tensile strength for each of the twenty samples of composites developed are presented in Table 3. From the results, it can be deduced that Luffa powder substantially impacted the flexural and tensile strength of the composite more than the other two materials, while diglycidyl epoxy exhibits the lowest impact on the responses. This can further be explained in Table 3 by comparing composite samples 1 and 2 with constant diglycidyl epoxy and white clay of 70 g and 8 g, respectively, while the luffa powder was varied from 12 to 20 g. This resulted in an increase of tensile strength from 4 g to 16.5 g and flexural strength (FS) from 7.44 g to 26.69 g, with a deviation of 12.5 g and 19.25 g, respectively. Similarly, comparing composite samples 1 and 3, having constant Luffa powder and diglycidyl epoxy mass of 12 g and 70g, respectively, but with white clay variation from 8 g to 15 g, produced an increase in tensile strength (TS) from 4 g to 7.22 g and flexural strength from 7.44 g to 13.43 g. This led to a variation of 3.22 g and 5.99 g for tensile and flexural strength, respectively. Lastly, the comparison between composite samples 1 and 5, with constant Luffa and clay powder at 12 g and 8 g, respectively, while the diglycidyl epoxy was varied from 70 g to 80 g, resulted in a tensile strength increase from 4 g to 5.10 g and a flexural strength increase from 7.44 g to 9.49 g. The deviations in this case are 1.1g (for tensile strength) and 2.05 g (for flexural strength). The degree of deviation of tensile and flexural strengths from material composition variation dictates the impact level of each material in composites. Figure 6(a-d) and Figure 7(a-d) show the response level and contour plot of material composition in relation to tensile strength and flexural strength, respectively.
Grubbs' (G) test was used in detecting the data set outliers. This was done for the identification of data that are substantially different from other datasets presented in Table 3. The first set of Outliers is 9.27 g and 22.72 g of luffa powder found in S9 and S10, respectively, in Table 3. The second set of outliers is 5.61 g and 17.39 g of clay powder found in S11 and S12, while the third set is 66.59 g and 83.41 g of diglycidyl epoxyl found on S13 and S14. Eq. (2) was used to calculate the values of G(cal). For n = 20 and α = 0.05, the critical value of G is 2.57. Therefore, all the datasets cannot be thrown out because the critical value is greater than all the calculated values as presented in Table 4.
$G=\frac{ { Outlieirs }- { Mean }}{ { Standard \, Deviation }}$ (2)
Table 3. The average tensile and flexural strength values for each composite formulation, along with standard deviations
|
Sample |
Input Variables |
Responses |
|||
|
Luffa Powder (g) |
Clay Powder (g) |
Diglycidyl Epoxyl (g) |
TS (MPa) |
FS (MPa) |
|
|
S1 |
12 |
8 |
70 |
4 |
7.44 |
|
S2 |
20 |
8 |
70 |
16.5 |
29.69 |
|
S3 |
12 |
15 |
70 |
7.22 |
13.43 |
|
S4 |
20 |
15 |
70 |
19.84 |
34.9 |
|
S5 |
12 |
8 |
80 |
5.1 |
9.49 |
|
S6 |
20 |
8 |
80 |
17.16 |
29.92 |
|
S7 |
12 |
15 |
80 |
9.89 |
18.4 |
|
S8 |
20 |
15 |
80 |
21.57 |
38.12 |
|
S9 |
9.27 |
11.5 |
75 |
3.16 |
5.88 |
|
S10 |
22.72 |
11.5 |
75 |
22.15 |
39.2 |
|
S11 |
16 |
5.61 |
75 |
11.64 |
21.65 |
|
S12 |
16 |
17.39 |
75 |
13.96 |
25.97 |
|
S13 |
16 |
11.5 |
66.59 |
15.98 |
29.72 |
|
S14 |
16 |
11.5 |
83.41 |
17.96 |
31.41 |
|
S15 |
16 |
11.5 |
75 |
17.34 |
30.25 |
|
S16 |
16 |
11.5 |
75 |
17.42 |
30.4 |
|
S17 |
16 |
11.5 |
75 |
17.24 |
30.07 |
|
S18 |
16 |
11.5 |
75 |
17.42 |
30.4 |
|
S19 |
16 |
11.5 |
75 |
17.43 |
30.42 |
|
S20 |
16 |
11.5 |
75 |
17.35 |
30.27 |
Figure 6. Tensile strength response to (a): luffa and white powder, (b): luffa powder and diglycidyl epoxyl, (c): diglycidyl epoxyl and white powder, (d) contour plot
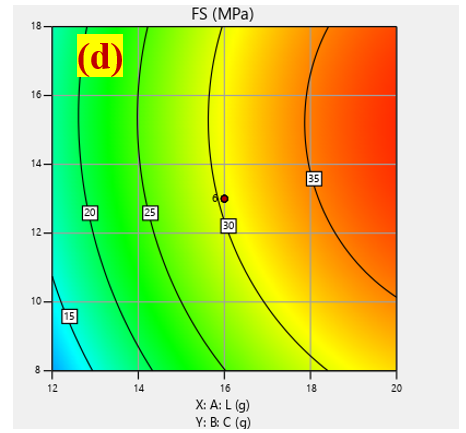
Figure 7. Flexural srength response to (a): luffa and white powder, (b): luffa powder and diglycidyl epoxyl, (c): diglycidyl epoxyl and white powder, (d): contour plot
Table 4. Grubbs’ test results
|
Index |
Luffa Powder Outliers |
Clay powder Outlier |
Diglycidyl Epoxyl Outlier |
|
1 |
9.27 |
5.61 |
66.59 |
|
2 |
22.72 |
17.39 |
83.41 |
|
Data set mean |
16 |
11.5 |
75 |
|
SD |
3.39 |
2.89 |
4.13 |
|
Gcal.1 |
1.98525 |
2.03806 |
2.03632 |
|
Gcal.2 |
1.982301 |
2.038062 |
2.03632 |
|
G critical |
2.57 |
2.57 |
2.57 |
3.2 Model generation and its statistical analysis
In predicting the tensile and flexural strength of each developed composite sample with various amounts of input parameters (luffa, powder, white clay powder, and diglycidyl epoxyl), a second-order quadratic equation was developed through the RSM of the Design Expert software used. The tensile and flexural stress predicting equations are presented in Eqs. (3) and (4).
$\begin{aligned} & \mathrm{R}_1=7.41+5.92 \mathrm{~L}+1.44 \mathrm{C}+0.6949 \mathrm{D}-0.0325 \mathrm{LC}- 0.1725 \mathrm{LD}+0.33 \mathrm{CD}-1.94 \mathrm{~L}^2-1.89 \mathrm{C}^2-0.4116 \mathrm{D}^2\end{aligned}$ (3)
$\begin{aligned} & \mathrm{R}_2=30.39+10.24 \mathrm{~L}+2.6 \mathrm{C}+0.9748 \mathrm{D}-0.1863 \mathrm{LC}- 0.4462 \mathrm{LD}+0.7387 \mathrm{CD}-3.31 \mathrm{~L}^2-2.86 \mathrm{C}^2-0.4728 \mathrm{D}^2\end{aligned}$ (4)
where, R1 and R2 denote tensile and flexural strength, respectively.
L, C, and D denote the mass of luffa powder, white clay powder, and diglycidyl epoxyl, respectively.
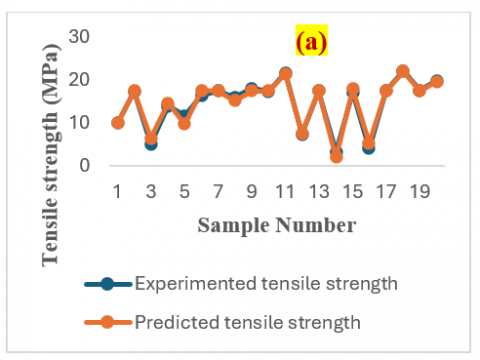
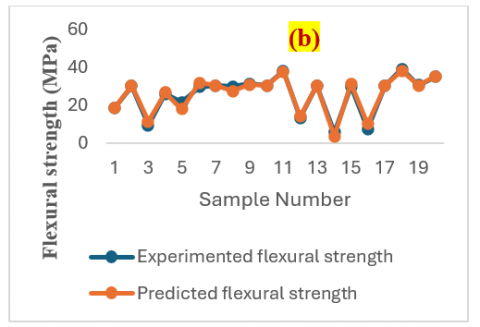
These developed models are presented in Eqs. (2) and (3) were used to predict the tensile flexural strengths, and the relationship between the predicted and experimental values is presented in Figure 8(a) and Figure 8(b) for tensile and flexural strengths, respectively. The overlapping nature of the experimental and predicted curves in both cases indicates an insignificant deviation between the values and implies that the model predicted accurately.
Figure 8. Experimented versus predicted (a) tensile strength, (b) flexural strength
3.3 ANOVA and model fittings result
Table 5 presents the suitability of the developed model in accurately predicting the responses for the samples with different compositions. The suitability of this model is evaluated based on the p-value. A p-value ≤ 0.05 indicates a statistically significant model [8]. In Table 5, all materials used are substantial in predicting tensile strength because luffa powder (L), white clay (C), and diglycidyl epoxide (D) have respective values of <0.0001, 0.0006, and 0.0382. Luffa powder has the lowest value, and diglycidyl epoxyl has the highest value. This implies that luffa powder has the highest impact and diglycidyl epoxyl has the lowest. Also, the square terms of the three materials are significant as all their values are ≤ 0.05 (L2 < 0.0001, C2 < 0.0001, and D2=0.1772). The interactions between luffa powder and white clay (LC) are also significant because their value is within the significance threshold (LC=0.0073). However, interactions between diglycidyl epoxyl and the other two materials are not substantial because of their values outside the significance range (LD=0.254, and CD=0.7519). This is a good model for tensile strength forecast because all the indicators agree with the significance level and conform to the result in Table 3, which indicates luffa powder as the most significant material and diglycidyl epoxyl as the least. The degree of freedom of the model in both cases is 9. Since it is greater than 5 for two predictors, they are regarded as being precise.
There is a similar response in flexural strength prediction, as all the materials showed a significant response. All of them also have p-value ≤ 0.05 (L<0.0001, C=0.0009, and D=0.0136). All their squared term are also significant (L2 = 0.0001, C2 = 0.0004, and D2=0.4079). In flexural strength prediction, all their interactions are not within the significance threshold of p-value ≤ 0.05 (LC=0.8050, LD=0.5570, and CD=0.3382) and therefore not significant.
Table 5. Flexural and tensile strength ANOVA outcomes
|
Source |
Tensile Strength |
Flexural Strength |
||
|
|
F Value |
p-Value |
F Value |
p-Value |
|
Model |
58.49 |
< 0.0001 |
46.25 |
< 0.0001 |
|
L-luffa powder |
512.55 |
< 0.0001 |
332.08 |
< 0.0001 |
|
C-white clay |
24.43 |
0.0006 |
21.47 |
< 0.0009 |
|
D- diglycidyl epoxyl |
5.69 |
0.0382 |
3.01 |
0.0136 |
|
LC |
0.0073 |
0.9336 |
0.0443 |
0.8050 |
|
LD |
0.2054 |
0.6600 |
0.3691 |
0.5570 |
|
CD |
0.7519 |
0.4062 |
1.01 |
0.3382 |
|
L2 |
46.68 |
< 0.0001 |
36.58 |
0.0001 |
|
C2 |
44.24 |
< 0.0001 |
27.33 |
0.0004 |
|
D2 |
2.11 |
0.1772 |
0.7464 |
0.4079 |
|
Df |
9 |
9 |
||
Table 6. Second-order model fitting ANOVA outcomes
|
Model factor |
Tensile Strength |
Flexural Strength |
|
Standard Deviation |
1.08 |
2.08 |
|
R2 |
0.9814 |
0.9765 |
|
Adjusted R2 |
0.9646 |
0.9554 |
|
Predicted R2 |
0.8590 |
0.8227 |
|
Adeq Precision |
26.144 |
23.46 |
Table 7. Levene’s results
|
ANOVA |
||||
|
Source of Variation |
df |
F |
p-Value |
F crit |
|
Between Groups |
1 |
0.045826652 |
0.8328975 |
4.413873419 |
|
Within Groups |
18 |
|||
|
Total |
19 |
|||
The second-order ANOVA outcomes presented in Table 6 are also used to determine the fit ability of the developed model for accurately predicting the tensile and flexural strength from the materials composites used. A good fit model must have the square of the coefficient correlation (R2)>0.95. Also, the difference between predicted R2 and adjusted R2 must be less than 0.20, and the adequate precision that evaluates the signal-to-noise ratio should be greater than 4 [8]. All the correlation metrics in Table 6 agree with the fitting’s conditions because R2 = 0.9814, Adjusted R2 - predicted R2 = 0.1056, and adequate prediction = 26.144 for tensile strength. Likewise in flexural strength where R2 = 0.9765, Adjusted R2 - predicted R2 = 0.1327 and adequate prediction = 23.46. This is also confirmation that the model is fit to forecast tensile and flexural strength. Levene’s test results for ANOVA result validation at α = 0.05 are presented in Table 7. Since the p-value (0.8328975) is greater than the α (0.05), the variance is equal among the groups and very precise.
The presented results conform with past findings that emphasize particle fillers and natural fiber reinforcement impacts in polymer composites [11]. The luffa powder has substantial effects on tensile strength agrees with the findings that have revealed the natural fibre's ability in composite material properties quality improvement [12]. There is also an agreement on the results that substantiates the particle-matrix interactions advantage in finding composite materials' general response [13].
3.4 Optimization results
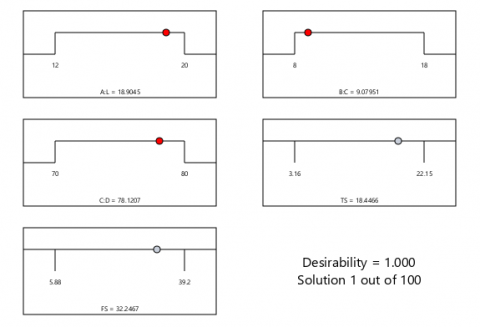
The optimum parameter settings of all the input parameters (luffa powder, white clay, and diglycidyl epoxyl) used in the development of composites that yield the best results were derived through the desirability approach function of the RSM. At a desirability of 1.0, the optimum parameters that yield the best tensile and flexural strengths of 18.4466 MPa and 32.2467 MPa are luffa powder (L), white clay (C), and diglycidyl epoxyl (D) of 18.0045 g, 9.07951 g, and 78.1207 g, respectively. The details of this are revealed in the optimization ramp presented in Figure 9.
Figure 9. Optimized values ramp
In furtherance of the optimization outcomes, another five confirmatory experiments were conducted (Table 8) using the optimized parameter settings (L=18.9045, C=9.07951, and D=78.1207) obtained from the optimization ramp to evaluate the tensile and flexural strengths. The results obtained through the confirmatory experiment were used to validate the optimum responses forecasted by the model, and the variation percentage between experimental (Exp.) and predicted (Pred.) was evaluated using Eq. (5). The percentage variations obtained are 1.62 %, 0.91 %, 1.43 %, 1.43% and 0.91% for five confirmatory experiments conducted for tensile strength (TS) evaluation, and 1.21 %, 2.29 % 1.53 %, 2.29 %, and 1.53 % for five experiments conducted to evaluate flexural strength (FS). These percentage variations are very small, and this is also an indication of accurate model prediction.
% elongation (experimental value – predicted value/experimental value) × 100 (5)
Table 8. Flexural and tensile strength confirmation experiments with variation percentage
|
Trials |
TS (MPa) |
FS (MPa) |
% Variation |
|||
|
|
Exp. |
Pred. |
Exp. |
Pred. |
TS |
FS |
|
1 |
18.7502 |
18.4466 |
32.6427 |
32.2467 |
1.62 |
1.21 |
|
2 |
18.6150 |
18.4466 |
33.0019 |
32.2467 |
0.91 |
2.29 |
|
3 |
18.7151 |
18.4466 |
32.7472 |
32.2467 |
1.43 |
1.53 |
|
4 |
18.7151 |
18.4466 |
33.0019 |
32.2467 |
1.43 |
2.29 |
|
5 |
18.6150 |
18.4466 |
32.7472 |
18.4466 |
0.91 |
1.53 |
3.5 Mechanical properties of luffa powder reinforced composites in automobile bumper application
The optimal flexural and tensile strengths of the developed luffa powder reinforced composite in this research are, respectively, 32.2467 MPa and 18.4466 MPa. These values are lower compared to the mechanical properties of the bumper made from steel, which have tensile and flexural strengths of 350 MPa - 550 MPa and 450 MPa - 650 MPa, respectively [14-16]. Aluminum bumper also has higher tensile and flexural strength compared to the developed composite, as its values fall between 200 MPa - 400 MPa, and 300 MPa - 500 MPa tensile and flexural strength, respectively. However, it has higher tensile and flexural strengths than bumpers manufactured from polypropylene materials, with tensile strengths ranging from 24 MPa to 45 MPa and flexural strengths ranging from 35 MPa to 65 MPa [16, 17]. When the density of the developed composite was measured it was found to be 1.3 g/cm3 which is lower than density of steel and aluminum bumper of 7.8 g/cm3 to 8g/cm3 and 2.6 g/cm3 to 2.8 g/cm3 [18, 19]. This low density of the developed composite compared to steel and aluminum bumper has compensated for the strength. It is an added advantage in automobile applications in the production of lightweight vehicles. The luffa powder and nano clay reinforced composite exhibits higher density (1.3 g/cm³), relative to other bio-composites such as sisal clay (1.009-1.297 g/cm³) [13] and fibre composites (1.011 g/cm³) [17]. Its tensile strength also exhibits performance comparability with similar fibre composites reported values (16 MPa) [17, 20].
The composite material reinforced with luffa powder and white clay was effectively developed and optimized for automobile bumper use. The mechanical properties of the composite were enhanced through the combination of luffa powder, white clay, and diglycidyl epoxyl in an adequate proportion. The flexural and tensile strengths of 32.2467 MPa and 18.4466 MPa were respectively obtained as the optimal response of an adequate proportion of inputs (L=18.9045, C=9.07951, and D=78.1207), making it a suitable substitute to conventional materials. From these outcomes, it is proposed that future work can emphasize the production process scale-up, using other organic reinforcement, with more research on recyclability and durability aspects of the composite. Also, investigate the mechanical properties and clay particle size quantitative relationship using regression analysis for optimizing particle size selection, optimization, to completely achieve its power of sustainability and automotive implementation.
[1] Ojo, A.A., Awogbemi, O., Olanipekun, K.A. (2024). Development and characterization of sustainable epoxy resin composites reinforced with palm kernel shell particulate and sisal fiber. Discover Applied Sciences, 6: 558. https://doi.org/10.1007/s42452-024-06226-0
[2] Asthana, A., Srinivas, R., Chauhan, S.S., Bandhu, D., Dwivedi, S.P., Saxena, K.K., Kaur, K., Alnaser, I. (2024). Development and mechanical properties evaluation of environmentally sustainable composite material using various reinforcements with epoxy. Case Studies in Construction Materials, 21: e03624. https://doi.org/10.1016/j.cscm.2024.e03624
[3] Selvaraj, V.K., Subramanian, J., Mouleswaran, S., Keerthan, T.K., Muneeswaran, T., Nath, A.K., Raju, M.P. (2025). Sustainable development of bioepoxy composites reinforced with recycled rigid polyurethane foam for mechanical, thermal, acoustic, and electromagnetic applications in a circular economy approach. Scientific Reports, 15: 8295. https://doi.org/10.1038/s41598-025-91273-9
[4] Alsuwait, R.B., Souiyah, M., Momohjimoh, I., Ganiyu, S.A., Bakare, A.O. (2022). Recent development in the processing, properties, and applications of epoxy-based natural fiber polymer biocomposites. Polymers, 15(1): 145. https://doi.org/10.3390/polym15010145
[5] Owa, A.F., Olubambi, P.A. (2024). Development and structural evaluation of dog bone particle–reinforced epoxy composites for biomedical applications. Advances in Materials Science and Engineering, 2024(1): 2259630. https://doi.org/10.1155/2024/2259630
[6] Battawi, A.A., Abed, B.H., Al-Filfily, A.A.H. (2024). Enhancements of creep compliance of Kevlar and Carbon fibers reinforced Sika epoxy composites. Revue des Composites et des Matériaux Avancés-Journal of Composite and Advanced Materials, 34(5): 593-602. https://doi.org/10.18280/rcma.340507
[7] Das, P., Manna, S., Behera, A.K., Shee, M., Basak, P., Sharma, A.K. (2022). Current synthesis and characterization techniques for clay-based polymer nano-composites and their biomedical applications: A review. Environmental Research, 212: 113534. https://doi.org/10.1016/j.envres.2022.113534
[8] Azeez, T.M., Mudashiru, L.O., Asafa, T.B., Adeleke, A.A., Ikubanni, P.P. (2021). Mechanical properties of Al 6063 processed with equal channel angular extrusion under varying process parameters. International Journal of Engineering Research in Africa, 54: 23-32. https://doi.org/10.4028/www.scientific.net/JERA.54.23
[9] Azeez, T.M., Mudashiru, L.O., Asafa, T.B., Adeleke, A.A., Yusuff, A.S., Ikubanni, P.P. (2023). Mechanical properties and stress distribution in aluminium 6063 extrudates processed by equal channel angular extrusion technique. Australian Journal of Mechanical Engineering, 21(4): 1326-1334. https://doi.org/10.1080/14484846.2021.2003003
[10] All Standards and Publication. (2021). ASTM. https://standards.iteh.ai/catalog/standards/astm/.
[11] Rashid, A.B., Haque, M., Islam, S.M., Labib, K.R.U. (2024). Nanotechnology-enhanced fiber-reinforced polymer composites: Recent advancements on processing techniques and applications. Heliyon, 10(2): e24692. https://doi.org/10.1016/j.heliyon.2024.e24692
[12] El Hadouchi, M., Kiers, H., Boerstra, B.A., Veenhof, C., van Dieën, J. (2024). Therapeutic validity and replicability of power training interventions in older adults: A review using the TIDieR checklist and CONTENT scale. Heliyon, 10(2). e24362. https://doi.org/10.1016/j.heliyon.2024.e24362
[13] Alhijazi, M., Safaei, B., Zeeshan, Q., Asmael, M., Eyvazian, A., Qin, Z.Y. (2020). Recent developments in luffa natural fiber composites: Review. Sustainability, 12(18): 7683. https://doi.org/10.3390/su12187683
[14] Pratiwi, H., Wildan, M.W. (2025). Development and characterization of polyester/ramie fiber hybrid composites reinforced with crystalline nanocellulose extracted from durian peel waste. Journal of Materials Research and Technology, 34: 1201-1212. https://doi.org/10.1016/j.jmrt.2024.12.159
[15] Baskar, S., Subbiah, G., Guntaj, J., Kumar, M., Kaliappan, N. (2025). Development and characterization of an epoxy matrix composite reinforced with Al2O3 embedded banyan fibers for secondary structural applications. Results in Engineering, 26: 105587. https://doi.org/10.1016/j.rineng.2025.105587
[16] Liu, H.L., Chen, Y.F., Chai, M.Z., Wu, Y.Q., Xue, K.L., Liu, L., Huang, Y.D. (2024). High-performance carbon fiber-reinforced epoxy resin composites based on novel, environmentally friendly, stability, and heat-moisture resistant nano emulsion encapsulated POSS sizing agent interface modification. Composites Part B: Engineering, 284: 111697. https://doi.org/10.1016/j.compositesb.2024.111697
[17] Saw, S.K., Purwar, R., Nandy, S., Ghose, J., Sarkhel, G. (2013). Fabrication, characterization, and evaluation of luffa cylindrica fiber reinforced epoxy composites. BioResources, 8(4): 4805-4826.
[18] Shelly, D., Singhal, V., Jaidka, S., Banea, M.D., Lee, S.Y., Park, S.J. (2025). Mechanical performance of bio‐based fiber reinforced polymer composites: A review. Polymer Composites, pp. 1-35. https://doi.org/10.1002/pc.30000
[19] Vijayarajan, K., Saikrishnan, S., Tamilmani, M., Yuvaraj, V., Praveen, M. (2025). Development and characterization of banana fiber reinforced composites. International Journal of Multidisciplinary Research Transactions, 5(6): 259-268. https://zenodo.org/records/7883406.
[20] Alhijazi, M., Zeeshan, Q., Qin, Z.Y., Safaei, B., Asmael, M. (2020). Finite element analysis of natural fibers composites: A review. Nanotechnology Reviews, 9(1): 853-875. https://doi.org/10.1515/ntrev-2020-0069