Renny Eka Putri*![]() | Irriwad Putri
| Irriwad Putri![]() | Ashadi Hasan
| Ashadi Hasan![]() | Muhammad Kharisman Darajat
| Muhammad Kharisman Darajat![]()
© 2025 The authors. This article is published by IIETA and is licensed under the CC BY 4.0 license (http://creativecommons.org/licenses/by/4.0/).
OPEN ACCESS
This study presents the design and implementation of a solar power generation system (SPGS) to harness solar energy as an alternative power source for greenhouse operations. The system is developed to support vertical hydroponic crop cultivation while operating independently through an off-grid configuration. The specific objectives of this research are to optimize the energy efficiency of the SPGS, ensure the reliability of power supply for hydroponic operations, and evaluate the system's effectiveness in supporting sustainable agricultural practices. The SPGS utilizes solar panels to convert solar radiation into direct current (DC), which is stored in batteries or converted to alternating current (AC) to power various loads. The results showed that the SPGS operated effectively and was capable of supplying consistent energy to the greenhouse. The highest recorded solar irradiance was 1072.82 W/m², resulting in a voltage of 42.8 V and current of 6.9 A. The maximum power output reached 295.32 W, with the solar panel system achieving an efficiency of 18.72%. The combination of a solar energy system specifically created and fine-tuned for greenhouse use, along with a vertical hydroponic system. This research offers a customized energy approach that guarantees effective energy collection, storage, and delivery, perfectly aligned with the fluctuating energy needs of a greenhouse setting.
solar power generation system (SPGS), off-grid energy system, greenhouse energy supply, renewable energy, hydroponic farming
Energy is the ability to do work or cause change. In physics, energy is a measurable quantity that indicates the capacity of a system to do work. It can take various forms, such as kinetic energy, potential energy, thermal energy, chemical energy, electrical energy, and others. Several alternative energies sourced from nature can be used as renewable energy. Renewable energy is a clean alternative because it does not cause pollution, is safe and has an unlimited supply [1]. A solar power plant is a system for generating electrical energy that harnesses solar energy as its primary energy source [2]. Indonesia has a lot of clean and environmentally friendly renewable energy potential, including solar energy. Indonesia is a tropical country and is located on the equator, so Indonesia has abundant solar energy. The intensity of solar radiation throughout Indonesia has an average value of 4.8 kWh/m2 per day [3]. Solar power offers a clean, unlimited energy resource with minimal maintenance costs and zero greenhouse gas emissions [4]. Solar power generation system (SPGS) can produce electrical energy by converting the intensity of sunlight through the photovoltaic process into electrical energy using semiconductor components that we commonly refer to as solar panels [5]. SPGS are designed to capture solar energy on sunny days and retain heat for use during the night or on cloudy days [6]. SPGS can be used for a variety of relevant purposes and in various places such as housing, offices, factories and others. The use of SPGS can also be utilized in other fields, one of which is in agriculture. In this study, researchers will use SPGS as a source of electrical energy in greenhouses. SP will be used as a source of electrical energy for all components in the greenhouse such as pumps, misting, exhaust fans and lights. A solar panel system provides low-cost green energy, making it an ideal solution for agricultural operations in remote areas [7].
Hydroponic farming is a plant cultivation system using water and the addition of nutrients to replace soil and fertilizer to provide nutrients to plants [8, 9]. Hydroponic cultivation is generally carried out in a greenhouse or indoors so that the plants grown can be protected from the influence of external elements such as weather, climate, pests, and so on. Hydroponic cultivation requires a method of cultivating plants in a controlled environment. One of the hydroponic methods is the Tower Hydroponic System method. The Tower Hydroponic System is an innovation in farming methods that utilizes vertical space, ideal for urban environments with limited land [10, 11]. This system uses nutrient-enriched water as a growing medium, replacing soil, and allowing the efficient cultivation of various plants. With its vertical design, the Hydroponic Tower optimizes the use of space and water, allowing plants to grow faster with better yields. In addition, the system is environmentally friendly, as it does not require the use of pesticides or herbicides, making it suitable to meet the needs of modern agriculture amidst the challenges of urbanization and climate change. A greenhouse is a building designed to create environmental conditions that are manipulated according to the needs of plants [12].
Greenhouses are helpful in protecting plants from extreme temperatures, protecting them from dust and dirt, and keeping plants away from pests and diseases [13]. In tropical regions, greenhouses serve to shield plants from excessive solar radiation, minimize water loss through leaf and soil evaporation, and lower the likelihood of pest infestations [14]. Plants often cultivated by farmers in greenhouses are usually vegetable plants grown using the hydroponic method. Greenhouse plays a crucial role in optimizing environmental conditions necessary for effective plant cultivation, leading to improved crop quality and yields [15]. To get quality crop results, it is necessary to carry out regular maintenance and control of the environmental conditions of the greenhouse and hydroponic plants. For the environmental conditions in the greenhouse to be maintained, it is necessary to control the temperature and humidity conditions that are suitable for the plants in the greenhouse [16]. To maintain the temperature and humidity conditions to keep it suitable for plants, several components are needed such as exhaust fans and misting to help create an optimal environment for plant growth by controlling temperature, humidity, and air circulation and greenhouse environmental management to help create optimal conditions for plant growth and health. The objective of the research is to develop a solar panel technology to utilize existing alternative energy as a source of electricity for all components in the greenhouse and apply automation to all components to make it easier to control environmental conditions in the greenhouse.
2.1 Design a greenhouse
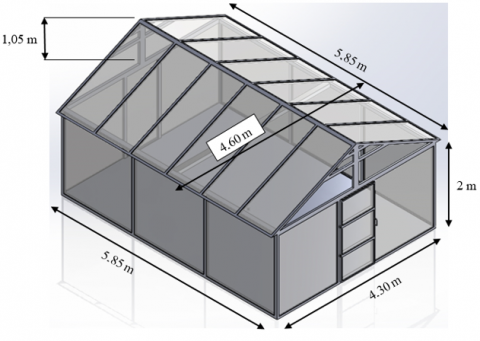
The greenhouse is designed to determine the appropriate size on the land used for making greenhouses. In this design, the greenhouse will be designed with dimensions of 5.85 meters long, 4.30 meters wide, and 2 meters high. As for the dimensions of the triangular roof, with a length of 5.85 meters, a base of 4.60 meters, and a height of 1.05 meters. The greenhouse framework is constructed using TASO mild steel. The walls and roof of the greenhouse will be covered with UV plastic and insect net. The following greenhouse design made using Solidworks software can be seen in Figure 1 below.
Figure 1. Greenhouse design
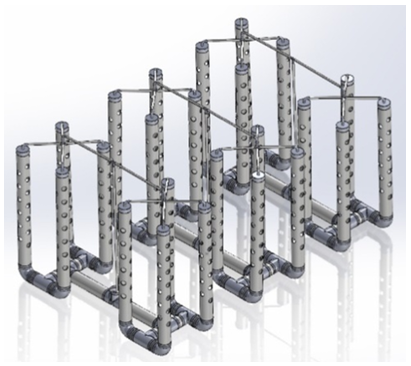
Then after designing the greenhouse, make a design on the Tower Hydroponic System. The Tower Hydroponic System is used as a medium for plant growth that will be placed in the greenhouse. In one set of THS (Tower Hydroponic System), 8 towers will be made. Each tower has a total of 26 planting holes with a distance of 15 cm between holes. The tower pipe is designed using a 4-inch pipe with a tower pipe height of 125 cm in each tower. In this design, we will make 3 sets of THS so that it has a total of 624 planting holes. The following is the Tower Hydroponic System design made using Solidworks software can be seen in Figures 2 and 3.
Figure 2. Tower hydroponic system
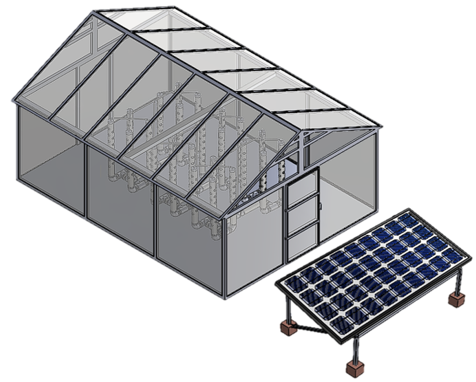
Figure 3. Greenhouse and solar panel
2.2 Solar power plant system design
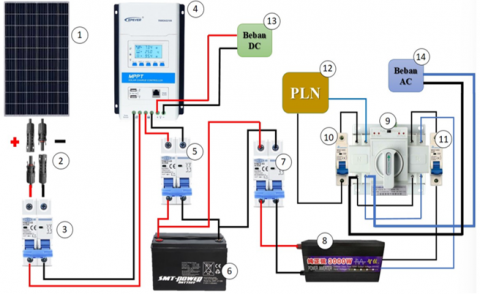
The SPGS system in this research is designed to utilize solar energy to convert it into electrical energy, which will be used as an alternative source of electrical energy in the greenhouse. Solar panels are an important component in building a SPGS system. Solar panels convert solar energy into electrical energy, whose output will produce direct current (DC). The SPGS will be assembled in this design with a series of off-grid systems. Off-grid SPGS systems are designed to supply DC or alternating current (AC) loads [17]. Generally, the electric current produced by solar panels is a DC electric current, so the electrical energy produced can be stored in batteries. However, the electronic equipment used in the greenhouse is mostly AC electric current. Therefore, it is necessary to convert the DC electric current into AC. One way is to use an inverter. Inverters are used to convert DC into AC. So, the DC electric current stored in the battery can be directly converted into AC by flowing it through the inverter so that the output can be directly used for electrical installations in the greenhouse. The circuit scheme of the off-grid solar system is shown in Figure 4.
In order for the design results on the SPGS system to run well and optimally, it is necessary to know in advance the capacity of each component in the off-grid SPGS system circuit to be installed. If the entire capacity of each component has been determined properly, the PGS system will avoid obstacles or errors in the electrical part, so that the SPGS system has a long service life. The way to determine the capacity of each component in the SPGS system can be determined using the following formula.
Table 1. Solar panel specifications
|
Specifications |
|
|
Maximum power (Pmax) |
550 Wp |
|
Maximum power voltage (Vmp) |
41.58 V |
|
Maximum power current (Imp) |
13.23 A |
|
Open-circuit voltage (Voc) |
50.27 V |
|
Short-circuit current (Isc) |
14.01 A |
|
Module efficiency (%) |
21.68% |
|
Maximum system voltage |
1500VDC |
|
Maximum series fuse rating |
30 A |
|
Power tolerance |
±3% |
|
Area |
2.58 m2 |
|
Weight |
32 kg |
The system uses a monocrystalline solar panel (1) rated at 550 Wp, with a maximum power voltage (Vmp) of 41.58 V and maximum current (Imp) of 13.23 A, as outlined in Table 1 of the manuscript. The MC-4 connector cables (2 and 5) are used to connect the solar panel safely to the rest of the system. A DC circuit breaker (3) is installed for overcurrent protection before connecting to the MPPT solar charge controller (4), which is rated at 20 A, exceeding the minimum calculated requirement of 16.53 A for added safety.
The charge controller regulates charging to the VRLA battery (6), which is rated at 12 V, 100 Ah, supporting the daily load demand of 1573.8 Wh. Another DC circuit breaker (5) is placed between the charge controller and battery, while a third DC MCB (7) protects the line between the battery and inverter (8). The inverter has a capacity of 3000 W, providing AC output with an efficiency of 90-93%.
To enable automatic source switching between the solar system and utility grid (PLN), the system incorporates an Automatic Transfer Switch (9). AC MCBs (10 and 11) provide safety protection before and after the ATS. Load 13 represents DC-powered components (e.g., sensors or small controllers), while Load 14 includes AC-powered devices in the greenhouse such as pumps, misting systems, fans, and lighting.
2.3 Calculating the electricity used per day
In determining the amount of electric power needed per day can be calculated using Eq. (1):
$\mathrm{Et}=P \times t$ (1)
where, Et: Daily energy consumption (Wh); P: Power (Watt); t: Operational time (hour).
Table 2. Total electrical power requirement per day
|
Electrical Load |
Amount |
Power (Watt) |
Operational Time (Jam) |
Energy Consumption (Wh) |
|
Pump |
3 |
36 |
12 |
1296 |
|
Misting |
1 |
60 |
0.13 |
7.8 |
|
Exhaust fan |
1 |
45 |
6 |
270 |
|
Total energy consumption (Wh) |
1573.8 |
|||
Electronic devices that will be used in the greenhouse are 4 pumps, 1 misting, 1 exhaust fan and 1 lamp. The amount of electrical power required per day can be seen in Table 2. Based on Table 2, it is known that the total amount of electrical power demand from 3 pumps, 1 misting and 1 exhaust fan used per day is 1573.8 Wh.
2.4 Calculating the number of batteries required
In knowing the number of batteries needed in the SPGS system, you must first determine the capacity of the battery or battery to be installed. To determine the required battery capacity can be calculated by Eq. (2):
$\mathrm{AH}=\frac{E t}{V s}$ (2)
where, AH: Current per hour (Ah); Et: Energy consumption (Wh); Vs: System voltage of battery (V); AH $=\frac{1573.8 \mathrm{~Wh}}{12 \mathrm{~V}}=$ 131.15 Ah.
In most cases, the Depth of Discharge (DOD) of a battery is indicated in percentage. A typical battery has a DOD of 80%, which means that only 80% of the available energy can be used and 20% remains in reserve. The DOD setting plays an important role in extending battery life. So, to find the value of battery capacity with a DOD of 80% can be calculated by Eq. (3):
$\mathrm{Cb}=\frac{A H \times A D}{\% D O D}$ (3)
where, Cb: Battery capacity (Ah); AH: Current per hour (Ah); AD: Autonomy days (Day); %DOD: Depth of discharge (80%); $\mathrm{Cb}=\frac{131.5 \times 1}{80 \%}=163.93 \mathrm{Ah}$.
Based on the results of the above calculations, it can be determined for the suitable battery capacity to be used which has capacity of 163.93 Ah. However, the SPGS system in this research will use one battery with a voltage of 12 V and a battery capacity of 100 Ah because, in this SPGS system, the battery is used with the battery in charge so that it can supply the maximum electrical power needed.
2.5 Determining the capacity of a solar panel
After determining the total electrical power needs used per day, we can determine the capacity of solar panels that will be needed. The maximum amount of solar energy that can be absorbed by solar panels in Indonesia is five hours every day, from 09.00 to 14.00. Furthermore, to find the value of the required solar panel capacity can be calculated by Eq. (4):
$\mathrm{SP}=\frac{E t}{T \max }$ (4)
where, SP: Solar Panel capacity (Wp); Et: Daily energy consumption (Wh); Tmax: Maximum time of solar energy (hour); $\mathrm{SP}=\frac{1573.8 \mathrm{~Wh}}{5 h}=314.76 \mathrm{Wp}$.
Based on the results of the above calculations, it can be determined that the right solar panel capacity to use has a minimum capacity value of 314.76 Wp. So the SPGS system in this study will use one solar panel with a capacity of 550 Wp. The reason for using a solar panel with a capacity of 550 Wp is that it will maximize the condition of the battery can be used with the battery on charge. The following solar panel specifications that will be used can be seen in Table 1.
Determining the Capacity of Solar Charge Controller
The capacity of the solar charnge controller can be determined by Eq. (5):
$\mathrm{Cscc}=\frac{P \max \times S f}{V m p}$ (5)
where, Cscc: Solar Charge Controller capacity (A); Pmax: Maximum power of solar panel (Watt); Sf: Safety Factor (1.25); Vmp: Maximum voltage of solar panel (V); Cscc = $\frac{550 \mathrm{~W} \times 1.25}{41.58 \mathrm{~V}}=16.53 \mathrm{~A}$.
Based on the results of the above calculations, it can be determined that the capacity of the solar charge controller that is appropriate for use has a minimum capacity value of 16.53 A. So, the installation of a solar charge controller in the SPGS system in this study will use a solar charge controller with a capacity of 20 A.
2.6 Determining the capacity of the inverter
The inverter capacity can be determined by the following Eq. (6):
$\operatorname{Cinv}=\mathrm{Dw} \times S f$ (6)
where, Cinv: Inverter capacity (Watt); Dw: Demand Watt (Watt); Sf: Safety Factor (1.25); Cinv = 1573.8 × 1.25 = 1967.25 Watt.
Based on the results of the above calculations, it can be determined that the right inverter capacity used in the SPGS circuit system this time has a minimum capacity of 1967.25 Watts. The inverter that will be used in this research will use an inverter with a capacity of 3000 Watts. The inverter used has a rated conversion efficiency of approximately 90-93%, which is typical for off-grid solar applications [18]. This efficiency range reflects the proportion of DC electricity from the solar panel or battery that is successfully converted to usable AC power, with the remainder lost as heat.
2.7 Observation
2.7.1 Solar intensity
The intensity of sunlight is observed to find the input power value of the solar panel. Light intensity is measured using a lux meter instrument that can get the value of light intensity. The unit of light intensity obtained from the lux meter is lux. The unit will be converted to W/m2 to calculate the output power of the solar panel later. Observations of light intensity are made every 30 minutes from 08.00 – 16.00 WIB with a span of data collection every three days for one month. Value conversion 1 lux = 0.0079 W/m2.
2.7.2 Input (Pin) and output (Pout) power of solar panel
Solar panels are used to convert solar energy into electrical energy whose output produces a DC electric current. The input power of the solar panel is obtained from the intensity of sunlight (W/m2) and the cross-sectional area of the solar panel (m2). While the output power of the solar panel is obtained from the current and voltage generated by the solar panel. Observations were made every 30 minutes from 06.00 – 18.00 WIB with a data collection time span of three days for one month. To determine the Pin and Pout of the solar panel, the following Eqs. (7) and (8) can be used:
$P_{\text {in }}=\mathrm{G} \times A$ (7)
where, Pin: Solar panel input power (W); G: Sunlight intensity (W/m2); A: Solar panel cross-sectional area (m2).
$P_{\text {out }}=\mathrm{Vmp} \times \operatorname{Imp}$ (8)
where, Pout: Solar panel output power (W); Vmp: Maximum voltage (V); Imp: Maximum current (A).
After obtaining the value of the Pin and Pout on the solar panel, observations can be made on the efficiency of the solar panel.
2.7.3 Solar panel efficiency
Solar panel efficiency is obtained from the ratio between the Pout and the Pin of the solar panel. Observation of the efficiency of solar panels is carried out every 30 minutes from 06.00 – 18.00 WIB with a span of data collection every three days for one month. Then the value of the efficiency of the solar panel is obtained from the following Eq. (9):
$\eta=\frac{P_{\text {out }}}{P_{\text {in }}}$ (9)
2.7.4 Battery capacity
Battery observation is carried out to find battery power by finding the current and voltage values of the battery when used. The tool used to find the current and voltage values of the battery is using a multimeter. Observations were made every 30 minutes from 06.00 – 18.00 WIB with a data collection time span of three days once for one month. To measure the amount of battery power when used can be obtained from the following Eq. (10):
$P=\mathrm{V} \times I$ (10)
where, P : Battery Power (Watt); V: Voltage on battery (V); I: Current on battery (A).
2.7.5 Temperature and humidity
Temperature and humidity observations were made at ambient temperature and humidity conditions inside and outside the greenhouse. The instrument used to take temperature and humidity values this time is a thermohygrometer. Temperature and humidity observations are also motorized using a DHT 22 sensor and the data will immediately appear on the web database used. Observations are made every 30 minutes from 06.00 – 18.00 WIB.
3.1 Solar intensity
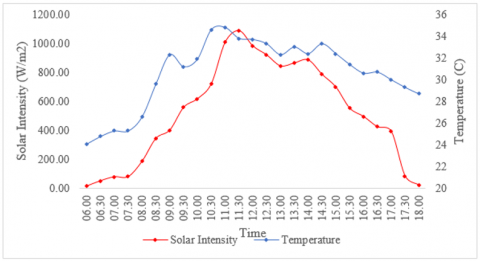
The intensity of sunlight was measured using a lux meter. Sunlight intensity was measured every 30 minutes from 06:00 – 18:00 WIB. The method of taking the value of sunlight intensity is by positioning the lux meter parallel to the solar panel facing the sunlight source. Based on Figure 5, it can be seen that there is an increase in the light intensity graph from 06:00 until it reaches the peak value at 11:30 with a light intensity value of 1090.20 W/m2. Then, from 11:30 to 14:30, the decrease and increase in the graph are not very significant. The smallest light intensity value was recorded at 06:00 with a value of 14.68 W/m2. Temperature and sun intensity are strongly positively correlated. The temperature tends to rise in tandem with an increase in solar intensity. This is due to the fact that the Earth's surface receives the majority of its heat from solar radiation.
Figure 5. Graph of solar intensity measurement
3.2 Voltage and electric current solar panel
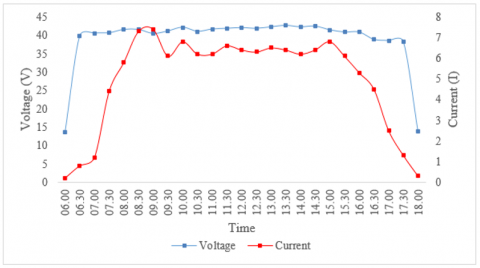
Measurements on the voltage and electric current generated by the solar panel were carried out every 30 minutes from 06:00 – 18:00 WIB. Measurements of the voltage and electric current generated by the solar panel were obtained from the display on the solar charge controller connected to the solar panel. Based on Figure 6, it can be seen that the highest voltage value was obtained at 13:30 with a voltage value of 42.6 V, and the highest current value was obtained at 09:00 with a current value of 7.4 A. Meanwhile, the lowest voltage and current values were obtained at 18:00 with values of 13.8 V and 0.3 A, respectively. The difference in the highest voltage and current values not occurring at the same time is caused by the temperature factor on the solar panel. The temperature on the solar panel also affects efficiency, so the voltage and current values obtained at the peak of the highest light intensity are not always high.
Figure 6. Solar panel voltage and electric current measurement
Though the SPGS creates DC, we opted to employ an inverter to change the DC into AC, as the majority of electrical devices utilized in the greenhouse—including pumps, misting systems, exhaust fans, and lighting—operate on AC. These air conditioning parts are more commonly accessible, affordable, and simpler to incorporate with typical greenhouse setups in our area. Although using an inverter leads to energy conversion losses (usually about 5-10% based on the inverter's quality) [19], this method provides greater compatibility and flexibility, particularly when future integration with the utility grid or hybrid energy systems is taken into account. Furthermore, air conditioning systems make maintenance and the replacement of parts easier. However, we recognize that employing DC-powered devices may enhance energy efficiency by minimizing conversion losses. Therefore, future system development might investigate the direct use of DC, especially regarding DC microgrids for agricultural purposes, as suggested in recent research [20].
3.3 Pin, Pout, and solar panel efficiency
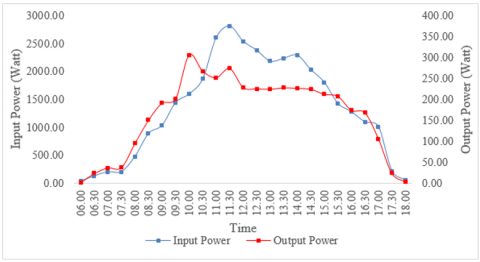
The Pin, Pout, and efficiency generated by solar panels were measured every 30 minutes from 06:00 – 18:00 WIB. Measurement of Pin was carried out by multiplying the light intensity value obtained by the cross-sectional area of the solar panel. Pout was obtained from the value that came out of the display on the solar charge controller. Meanwhile, the efficiency of the solar panel was obtained by dividing the Pout by the Pin.
Based on Figure 7, it can be seen that the value of incoming power and outgoing power generated from solar panels tends to be high. In the graph above, it can also be seen that the incoming power is directly proportional to the outgoing power. It is caused by several factors, such as the intensity of sunlight, the surface area of solar panels, and the voltage and electric current generated by solar panels. The incoming power of the solar panel is influenced by the intensity of sunlight and the panel's surface area. At the same time, the voltage and electric current produced influence the output power of the solar panel. In this research, the solar panel used has a surface area of 2.58 m2. The most considerable incoming power was obtained at 12:00, with a power value of 2767.9 watts. In contrast, the lowest incoming power value is obtained at 06:00 with a power value of 30.7 watts. Then the largest output power value is obtained at 10:30 with a power value of 295.32 watts, and the lowest value is obtained at 06:00 with a power value of 2.70 watts.
Figure 7. Graph of input power and output power measurement results solar panel
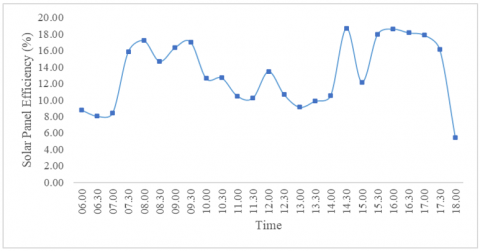
Meanwhile, in Figure 8, the graph shows that the highest efficiency value occurs at 08:00 with a value of 19.93% and the lowest efficiency value at 06:00 with a value of 7.29%. The efficiency of solar panels is influenced by several factors, namely the intensity of sunlight, weather, environmental conditions, the effect of dirt on the panel, and temperature drop. To achieve high efficiency, solar panels must be placed in environmental conditions where no obstructions can cover the rays of sunlight. The cleanliness of the panel must also always be considered because if there is dirt on the panel, it dramatically affects the value of the incoming power generated by the panel. Hence, the efficiency obtained is also tiny. Temperature drop also affects the efficiency of solar panels because the higher the panel temperature, the lower the efficiency obtained. The panels used in this study have specifications with a maximum efficiency of 21.68%. The panels' temperature must be carefully considered to increase the use of solar panels. Solar panels work optimally at around 25℃, and every 10℃ increase in temperature from the optimal temperature can reduce the panel's efficiency by up to 0.4% [21].
Figure 8. Solar panel efficiency graph
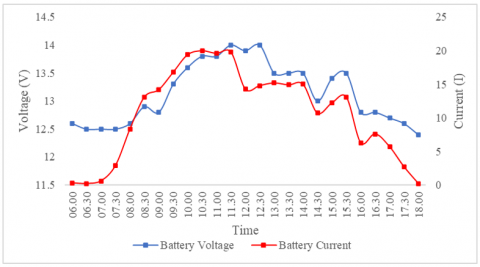
3.4 Battery voltage and current measurement
The results of the voltage and electric current measurements on the battery used in the SPGS system were carried out every 30 minutes from 06:00 – 18:00 WIB. The measurement of the battery voltage and electric current was obtained from the values on the solar charge controller display connected to the battery. Figure 9 shows that the battery voltage and current increase gradually from early morning until they peak around 12:00, with a voltage of about 13.8 V and a current of 20 A. This pattern reflects the battery's maximum charge in the middle of the day when the sunlight intensity is highest.
Figure 9. Graph of the results of measuring voltage and electric current on the battery
This charge was essential for ensuring the system functioned properly during the late afternoon and early morning times, when solar energy was low. The battery functioned successfully as a buffer, guaranteeing that crucial components (like the exhaust fan and misting system) continued to work even when solar energy production decreased. This greatly enhances the overall functionality of the system by minimizing periods of inactivity and ensuring consistent environmental control within the greenhouse [22, 23].
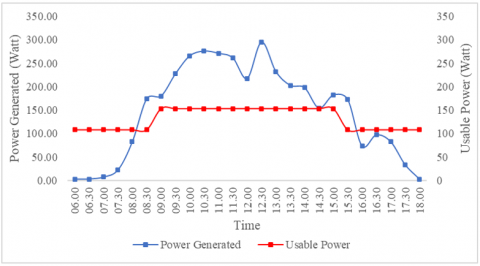
Figure 10. Distribution of power supply by the solar panel
Meanwhile, the graph in Figure 10 shows that the power generated increased sharply from 06:00, reaching a peak of around 300 W at 08:30 and remaining stable until 15:00, then gradually decreasing until 18:00. Meanwhile, the power used remained stable at around 150 W throughout the day, indicating that the system only utilized a portion of the generated power, with the excess power likely stored for use when the battery charging conditions began to decline in the late afternoon. The excess generated power was used for power needs in the late afternoon when battery charging began to decrease and for power needs the next morning when battery charging was not yet maximized.
Additionally, the stable power usage (150 W) throughout the day, in contrast to fluctuating power generation, demonstrates that the battery helped regulate and balance energy supply and demand. By storing excess energy during peak sunlight hours and releasing it during low irradiance periods, the battery enhanced system resilience and ensured uninterrupted power delivery. This analysis has been added to clarify the importance of battery behavior in supporting the energy needs of the greenhouse system [24, 25].
The SPGS makes it adaptable for larger greenhouse sizes. The system can be scaled by increasing the number or capacity of solar panels, batteries, and inverters to meet higher energy demands. For example, in a larger greenhouse with more electrical loads (e.g., multiple fans, pumps, or grow lights), additional solar modules can be integrated in parallel or series, and energy storage capacity can be expanded accordingly. Moreover, the system is not limited to a specific crop. Although this study was conducted using a tower hydroponic system for leafy greens, the energy system can be adapted for other crops with different environmental control requirements by adjusting the load specifications. This flexibility makes the SPGS suitable for various controlled environment agriculture applications.
3.5 Plant observation
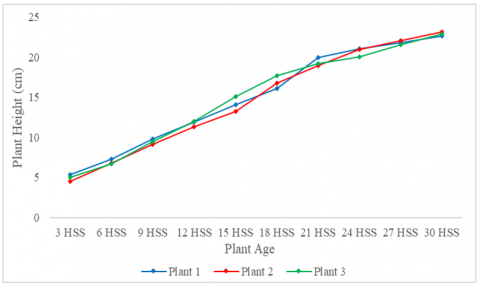
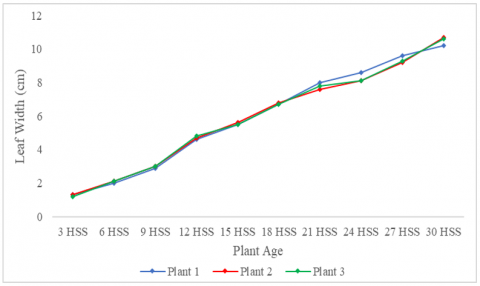
Observations on plant growth include measuring plant height, leaf width, leaf length, and the number of leaves on Pak choi plants grown inside the greenhouse. Observations will be conducted every three days at 9:00 AM WIB. Figure 11 shows the relationship between plant age (in HSS) and plant height (in cm) for three different plant samples, namely Plant 1, Plant 2, and Plant 3. Each plant exhibits a similar growth pattern, with a consistent increase in plant height as age increases. At 3 HSS, the height of the plants is still around 5 cm for all three samples, and it gradually increases over time. At 30 HSS, all three plants reach a height of nearly 20 cm. Although there are slight variations among the three plants, the height differences between the samples remain relatively small, indicating uniform growth under the same conditions. This indicates that the three plants grew well and had almost identical growth patterns throughout the observation. In general, all the plants show a positive growth trend, where the leaf width increases with the age of the plants. The three plants have very similar growth patterns, with slight variations at some points. At the early growth stage (3 HSS), the leaf width is still very small, around 1-2 cm (Figure 12).
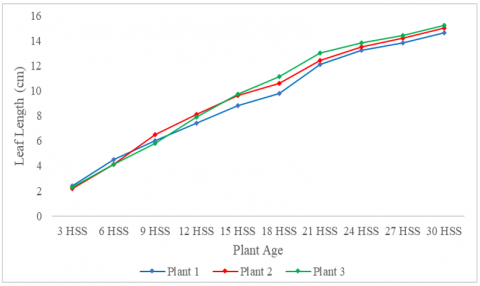
However, over time, the leaf width consistently increases until it reaches about 10 cm at 30 HSS. The consistently increasing leaf width indicates that the plants are able to optimally absorb nutrients, water, and light to support photosynthesis. The leaf growth reaches a size that meets the pakcoy cultivation standards, which is around 8-15 cm for optimal harvest, then this process is considered good [26]. Overall, the graph shows that leaf length increases consistently with the age of the plants, from about 2 cm at 3 Days After Planting (DAP) to around 14-15 cm at 30 DAP (Figure 13). The three plants exhibit a nearly uniform growth pattern with slight variations at some age points, indicating stable and even growth. The cultivation standards for pakcoy indicate that the leaf length of pakcoy at harvest age, which is around 30-35 HSS, ranges from 12-20 cm, depending on the variety and environmental conditions [27]. With leaf lengths on the graph reaching 14-15 cm at 30 HSS, this plant is within the optimal range for harvest. This good growth indicates that the plants are receiving enough light, nutrients, and water during their vegetative growth phase.
Figure 14 indicates that the number of leaves consistently increases with the age of the plants. Initially (3-9 DAS), the number of leaves was relatively few (around 2-4 leaves), then increased significantly after 15 DAS until reaching 14-18 leaves at 30 DAS. The small differences between the three plants indicate that the growth was relatively uniform, although Plant 2 had slightly more leaves compared to the others at 30 DAS. The increasing number of leaves over time indicates that the pakcoy plants are growing well. In pakcoy plants, the number of leaves is one of the main indicators of the success of the vegetative phase. A large number of healthy leaves indicate that the plant has optimal photosynthesis conditions, with sufficient nutrient and water intake. The number of leaves 14-18 at 30 HSS corresponds to the optimal growth standard for pakcoy at harvest age, which is around 12-20 leaves [28].
Figure 11. Plant height graph
Figure 12. Leaf width graph
Figure 13. Leaf length graph
Figure 14. Number of leaf graph
Based on the research, the SPGS successfully utilizes solar energy to convert it into electrical energy that will be used as an alternative source of electrical energy in the greenhouse. Solar panels are an essential component in building a power system. Solar panels convert solar energy into electrical energy, the output of which will produce a DC. This SPGS in a greenhouse can support growing crops with a tower hydroponic system. The results showed that the SPGS worked perfectly and was able to supply energy for the greenhouse. The results showed the highest light intensity data obtained was 1072.82 W/m², which produced a voltage and electric current of 42.8 V and 6.9 A. The highest electrical energy generated during the observation reached 295.32 W, with a solar panel efficiency of 18.72%. In order to produce pak choi of the highest standard, the plants must meet the required growth characteristics, such as leaf width, leaf length, and leaf number.
The authors are very grateful to the Directorate of Research, Technology, and Community Service (DRTPM) of the Directorate General of Higher Education, Research, and Technology of the Ministry of Education, Culture, Research, and Technology on the Fundamental-Regular Research scheme in accordance with Research Contract Number: 041/E5/PG.02.00.PL/2024 Fiscal Year 2024.
|
Et |
daily energy consumption (Wh) |
|
p |
power (Watt) |
|
t |
operational time (hour) |
|
AH |
current per hour (Ah) |
|
Vs |
system voltage of battery (V) |
|
Cb |
battery capacity (Ah) |
|
AD |
autonomy days (Day) |
|
%DOD |
depth of discharge (80%) |
|
SP |
solar panel capacity (Wp) |
|
Tmax |
maximum time of solar energy (hour) |
|
Cscc |
solar charge controller capacity (A) |
|
Sf |
safety factor (1.25) |
|
Cinv |
inverter capacity (Watt) |
|
Dw |
demand watt (Watt) |
|
Pin |
solar panel input power (Watt) |
|
G |
sunlight intensity (W.m-2) |
|
A |
solar panel cross-sectional area (m2) |
|
Pout |
solar panel output power (Watt) |
|
V |
voltage on battery (V) |
|
I |
current on battery (A) |
|
Greek symbols |
|
|
η |
efficiency |
|
Subscripts |
|
|
Pmax |
maximum power |
|
Vmp |
maximum power voltage |
|
Imp |
maximum power current |
|
Voc |
open-circuit voltage |
|
Isc |
short-circuit current |
[1] Ramadhan, A.I., Diniardi, E., Mukti, S.H. (2016). System design analysis of 50 WP solar power plant. Engineering, 37(2): 59. https://doi.org/10.14710/teknik.v37i2.9011
[2] Perez, E., Beltran, H., Aparicio, N., Rodriguez, P. (2013). Predictive power control for PV plants with energy storage. IEEE Transactions on Sustainable Energy, 4(2): 482-490. https://doi.org/10.1109/TSTE.2012.2210255
[3] Sunarso, A., Ibrahim-Bathis, K., Murti, S.A., Budiarto, I., Ruiz, H.S. (2020). GIS-based assessment of the technical and economic feasibility of utility-scale solar PV plants: Case study in West Kalimantan Province. Sustainability, 12(15): 6283. https://doi.org/10.3390/su12156283
[4] Venkateswaran, D., Cho, Y. (2024). Efficient solar power generation forecasting for greenhouses: A hybrid deep learning approach. Alexandria Engineering Journal, 91: 222-236. https://doi.org/10.1016/j.aej.2024.02.004
[5] Parida, B., Iniyan, S., Goic, R. (2011). A review of solar photovoltaic technologies. Renewable and Sustainable Energy Reviews, 15(3): 1625-1636. https://doi.org/10.1016/j.rser.2010.11.032
[6] Gorjian, S., Hashjin, T.T., Ghobadian, B. (2011). Solar powered greenhouses. In SET2011, 10th International Conference on Sustainable Energy Technologies, Istanbul, Turkey, pp. 1-6. https://doi.org/10.13140/RG.2.1.5064.2082
[7] Aroonsrimorakot, S., Laiphrakpam, M., Paisantanakij, W. (2020). Solar panel energy technology for sustainable agriculture farming: A review. International Journal of Agricultural Technology, 16(3): 553-562. https://www.cabidigitallibrary.org/doi/full/10.5555/20203437661.
[8] Anindyarasmi, D., dan Budiyanto, S., Purbajanti, E.D. (2021). The growth and production responses of red lettuce (Lactuca sativa var. Crispa) to LED Power and Plant Position on the Tower Hydroponic System. J. Agro Complex, 5(1): 49-56. https://doi.org/10.14710/joac.5.2.49-56
[9] Velazquez-Gonzalez, R.S., Garcia-Garcia, A.L., Ventura-Zapata, E., Barceinas-Sanchez, J.D.O., Sosa-Savedra, J.C. (2022). A review on hydroponics and the technologies associated for medium- and small-scale operations. Agriculture, 12(5): 646. https://doi.org/10.3390/agriculture12050646
[10] Putri, R.E., Fauzia, W., Cherie, D. (2023). Monitoring and control system development on IOT-based aeroponic growth of pakcoy (brassica rapa L.). Jurnal Keteknikan Pertanian, 11(2): 222-239. https://doi.org/10.19028/jtep.011.2.222-239
[11] Dadhich, V., Singh, M., Singh, P.K., Chhipa, B.G. (2024). Vertical hydroponic farming for indoor: A review. International Journal of Agriculture Extension and Social Development, 7(7): 480-485. https://doi.org/10.33545/26180723.2024.v7.i7g.838
[12] Putri, R.E., Wibowo, M.J.A., Ardli, J., Andasuryani. (2023). Monitoring and controlling of vertical farming system using Internet of Things (IoT). AIP Conference Proceedings, 2592(1): 020001. https://doi.org/10.1063/5.0115083
[13] Wang, A., Lv, J.R., Wang, J., Shi, K., et al. (2022). CO2 enrichment in greenhouse production: Towards a sustainable approach. Frontiers in Plant Science, 13: 1029901. https://doi.org/10.3389/fpls.2022.1029901
[14] Yusuf, A.G., Al-Yahya, F.A., Saleh, A.A., Abdel-Ghany, A.M. (2025). Optimizing greenhouse microclimate for plant pathology: Challenges and cooling solutions for pathogen control in arid regions. Frontiers in Plant Science, 16: 1492760. https://doi.org/10.3389/fpls.2025.1492760
[15] Putri, R.E., Lestari, N.U., Arlius, F., Putri, I., Hasan, A. (2024). Monitoring and controlling system of smart mini greenhouse based on Internet of Things (IoT) for spinach plant (Amaranthus sp.). International Journal on Advanced Science, Engineering and Information Technology, 14(1): 131-136. https://doi.org/10.18517/ijaseit.14.1.18408
[16] Soussi, M., Chaibi, M.T., Buchholz, M., Saghrouni, Z. (2022). Comprehensive Review on climate control and cooling systems in greenhouses under hot and arid conditions. Agronomy, 12(3): 626. https://doi.org/10.3390/agronomy12030626
[17] Torres, M.A., Muñoz, D., Burgos, C., Casagrande, D., et al. (2024). Design and performance evaluation of a photovoltaic greenhouse as an energy hub with battery storage and an electric vehicle charger. Sustainability, 16(3): 981. https://doi.org/10.3390/su16030981
[18] Kaldellis, J.K., Zafirakis, D., Kavadias, K. (2012). Minimum cost solution of wind-photovoltaic based stand‑alone power systems for remote consumers. Energy Policy, 42: 105-117. https://doi.org/10.1016/j.enpol.2011.11.054
[19] Dwivedi, P., Sudhakar, K., Soni, A., Solomin, E., Kirpichnikova, I. (2020). Advanced cooling techniques of P.V. modules: A state of art. Case Studies in Thermal Engineering, 21: 100674. https://doi.org/10.1016/j.csite.2020.100674
[20] Xu, Z.T., Elomri, A., Al-Ansari, T., Kerbache, L., El Mekkawy, T. (2022). Decisions on design and planning of solar-assisted hydroponic farms under various subsidy schemes. Renewable and Sustainable Energy Reviews, 156: 111958. https://doi.org/10.1016/j.rser.2021.111958
[21] Harmailil, I.O., Sultan, S.M., Tso, C.P., Fudholi, A., et al. (2024). A review on recent photovoltaic module cooling techniques: Types and assessment methods. Results in Engineering, 22: 102225. https://doi.org/10.1016/j.rineng.2024.102225
[22] Hannan, M.A., Hoque, M.M., Mohamed, A., Ayob, A. (2017). Review of energy storage systems for electric vehicle applications: Issues and challenges. Renewable and Sustainable Energy Reviews, 69: 771-789. https://doi.org/10.1016/j.rser.2016.11.171
[23] Hassan, S.H., Jadallah, A.A., Bilal, G.A. (2023). Design and implementation of a smart greenhouse automated and conditioned by solar power system. Engineering and Technology Journal, 41(1): 37-44. https://doi.org/10.30684/etj.2021.131279.1024
[24] Mekhilef, S., Saidur, R., Safari, A. (2011). A review on solar energy use in industries. Renewable and Sustainable Energy Reviews, 15(4): 1777-1790. https://doi.org/10.1016/j.rser.2010.12.018
[25] Blaabjerg, F., Liserre, M., Ma, K. (2012). Power electronics converters for wind turbine systems. IEEE Transactions on Industry Applications, 48(2): 708-719. https://doi.org/10.1109/TIA.2011.2181290
[26] Mustofa, M.J., Prihatiningrum, A.E., Nurmalasari, I.R. (2022). Effect of types and concentration of liquid organic fertilizer on the growth and production of pakcoy plants (Brassica rapa L.). IOP Conference Series: Earth and Environmental Science, 1104(1): 012010. https://doi.org/10.1088/1755-1315/1104/1/012010
[27] Gumelar, A.I., To, Y.K. (2021). Effect of frequency of application of liquid organic fertilizer and biochar dosage on growth and yield of pakcoy mustard (Brassica rappa L.). Savana Cendana, 6(1): 4-7. https://doi.org/10.32938/sc.v6i01.1227
[28] Zahrah, S., Kustiawan, N. (2024). Increasing growth, production and nutrient uptake of pakcoy (Brassica rapa L) plant on peat soil by applying polyvalent cation ameliorant Cu²⁺, Fe³⁺, Zn²⁺ and palm frond compost. Jurnal Agronomi Tanaman Tropika (JUATIKA), 6(2): 425-439. https://doi.org/10.36378/juatika.v6i2.3613