Laberiano Andrade-Arenas![]() | Cesar Yactayo-Arias*
| Cesar Yactayo-Arias*![]()
© 2025 The authors. This article is published by IIETA and is licensed under the CC BY 4.0 license (http://creativecommons.org/licenses/by/4.0/).
OPEN ACCESS
Diabetes is a persistent health condition that impacts millions of people globally. Early and accurate prediction of this disease is critical for prevention and effective management. Machine learning models have emerged as promising tools for this task; however, the variability in the performance of different algorithms requires a thorough evaluation to identify the most effective ones. The main objective of this study was to assess several machine learning models using different performance metrics to identify the most robust and consistent approaches to diabetes prediction. Nine machine learning models were evaluated using the Pima Indian dataset, with data balancing performed via Synthetic Minority Over-sampling Technique (SMOTE) and performance assessed through cross-validation and test data. Among the models, Random Forest and AdaBoost produced the most robust and consistent results across key metrics, such as the AUC-ROC and AUPRC. These findings highlight their potential use in clinical decision support systems for early risk detection and improved patient management. In conclusion, the study emphasizes the significance of utilizing various evaluation metrics to obtain a thorough insight into the performance of machine learning models in predicting diabetes.
Artificial Neural Networks, AdaBoost, diabetes, ensemble learning, machine learning, Pima Indian dataset, Random Forest, SMOTE
Diabetes represents the most widespread metabolic condition and poses a serious challenge to the global healthcare system due to its associated complications. It is now recognized as a long-term, non-infectious illness and ranks among the most severe health issues following cardiovascular and cerebrovascular diseases [1]. For example, as reported in the study [2], Saudi Arabia ranks second in diabetes prevalence within the Middle East and holds the seventh position worldwide, as reported by the World Health Organization. This condition, characterized by elevated blood glucose levels [3], requires significant healthcare resources and effective management strategies due to its widespread impact. Early and accurate detection of people susceptible to developing diabetes is critical to the implementation of preventive interventions and the proper management of the disease [4]. In the past, predicting diabetes without specialized tools has been a significant challenge for physicians and specialists [5]. However, recent advances in machine learning (ML) provide a significant chance to enhance the prediction and diagnosis of diabetes [6].
The present study addresses the need for a detailed comparative evaluation of different ML models to address the challenges associated with diabetes prediction. Using a meticulous approach, the study conducts a detailed assessment of machine learning techniques. Classical techniques such as Decision Tree (DT), Naive Bayes (NB), K-Nearest Neighbors (KNN) and Logistic Regression (LR) are contrasted with ensemble methods like Random Forest (RF), XGBoost and AdaBoost, while more sophisticated paradigms, including Artificial Neural Networks (ANN) and Support Vector Machines (SVM), are also incorporated to provide a comprehensive evaluation. The main objective of the study is to use a standardized set of evaluation metrics to examine how these models perform in terms of accuracy, precision, recall, F1 score, and other relevant measures to determine which of the above ML models performs better in diabetes prediction. By taking such a comprehensive approach, we aim to provide a more nuanced and comprehensive perspective on the relative effectiveness of these models for the specific task of diabetes prediction.
The ability to predict diabetes with greater accuracy and reliability has significant implications for both clinical practice and public health. A thorough comparative evaluation allows the identification of the most effective model, facilitates its implementation in clinical settings, and improves diabetes prevention and treatment strategies. This study adds to the existing body of research by offering a direct, yet systematic comparison of several ML models based on a broad set of evaluation metrics. For this purpose, publicly available diabetes datasets are used, which are preprocessed and divided into training and test sets. The selected ML models are trained and evaluated using the specified metrics, and validation through cross-validation methods is applied to guarantee the reliability of the results.
Numerous studies have applied computational learning approaches to forecasting diabetes using different models. Aouragh et al. [7] assessed five different ML algorithms: KNN, SVM, RF, DT, and gradient boosting on an unbalanced dataset. To address the class imbalance, they used advanced techniques such as SMOTE, a technique for generating synthetic samples to balance class distribution, and ADASYN, a method that adapts the sampling process based on data density, were used to tackle the imbalance and ensured the robustness of the results by cross-validation with K = 10. The model with additional trees, optimized by grid search, proved to be the most effective, reaching 92.5% accuracy, an F1 score of 93.7%, and an AUC-ROC value of 92.47%. Similarly, Alzboon et al. [8] evaluated several ML models, including RL, DT, RF, KNN, NB, SVM, gradient boosting, and neural networks, using a dataset of 768 Pima Indian patients. They evaluated the performance of these models and found that RL and neural networks had the best overall performance, while kNN and DT had less favorable results. SVM, RF, and NB models also performed moderately well. Along the same lines, Bandhu et al. [9] evaluated three machine learning techniques aimed at predicting the probability of diabetes onset. For this purpose, the authors relied on a dataset that incorporated multiple clinical and demographic variables, including blood pressure, history of pregnancy, glucose concentration, age, among other relevant indicators. The models evaluated included DT, RF, and SVM classifiers. It is essential to highlight that the assessment primarily concentrated solely on the accuracy of each model. The result shows that the DT classifier yielded an accuracy of 78.89%.
Similarly, Kumar et al. [10] conducted a comparative study to identify the most appropriate machine learning method for predicting diabetes. They evaluated five models: LR, SVM, (DT, RF, and kNN, using a dataset related to diabetes prognosis. Their results showed that the RF classifier attained the highest level of performance, with an accuracy of 92.23%, demonstrating strong capability in capturing complex and non-linear patterns in the data. In contrast, Logistic Regression obtained the lowest accuracy at 74.42%, indicating its limitations in handling intricate relationships among features. The study emphasizes the advantage of applying more sophisticated ensemble techniques, such as RF, in healthcare contexts to aid early diagnosis and clinical decision-making. In the same vein, Charan et al. [11] addressed the growing global impact of diabetes mellitus, a chronic metabolic condition influenced by factors such as obesity, age, hypertension, glucose levels, heredity, and ethnicity. With projections estimating over 578 million cases of diabetes worldwide by 2030, the study underlines the significance of early detection. To this end, the authors proposed a hybrid approach that integrates Random Forest and Logistic Regression through a soft voting classifier to enhance predictive performance. Their approach improved accuracy by 1.75% compared to the traditional Support Vector Machine (SVM) model, demonstrating the value of ensemble techniques in improving diagnostic accuracy in clinical settings.
On the other hand, Imaduddin et al. [12] explored the use of Random Forest and Decision Tree algorithms to classify diabetes cases, using a dataset of 100,000 records from Kaggle. After applying preprocessing techniques like normalization and feature selection, the data was split into training and testing sets to evaluate model performance. Their results showed that Random Forest slightly outperformed Decision Tree, achieving 96% accuracy versus 95%, along with better sensitivity and specificity. The study highlights the value of proper data preparation and algorithm choice, suggesting that ensemble methods like Random Forest can offer more reliable predictions in medical contexts. Likewise, Abdalrada et al. [13] evaluated a regression approach based on logistic modeling to estimate the probability of the occurrence of diabetic syndrome, using the sigmoid function to take advantage of the capabilities of this approach. The model was evaluated on a dataset comprising Pima Indian diabetes cases, demonstrating outstanding effectiveness with an accuracy of 77.6%, sensitivity of 72.4%, and specificity of 79.6%. In addition, Type I and Type II errors were 27.6% and 20.4%, respectively. The study underscores the practicality of employing laboratory indicators such as pregnancy, glucose, blood pressure, BMI, and diabetes pedigree traits to anticipate disease progression, highlighting the model’s capacity to support both patients and physicians in the early understanding and management of diabetes.
In the area of diabetes prediction, there is an increasing focus on developing and implementing advanced machine learning techniques. Previous research has shown the efficacy of machine learning algorithms in forecasting the likelihood of diseases. However, most studies concentrate on assessing the performance of a single model or a limited set of models without offering a broad comparison of multiple models under a unified set of evaluation metrics. This absence of direct comparison complicates the identification of the most suitable model for this particular objective.
3.1 Dataset and processing
3.1.1 Data description
For this study, data was obtained from a publicly available dataset on diabetes among Pima Indian individuals, accessed through the Kaggle platform [14]. The dataset was designed to evaluate the chances of developing diabetes by analyzing several clinical variables. All records correspond exclusively to women of Pima Indian ancestry, each at least 21 years old.
The dataset contained 768 records, each characterized by eight diagnostic attributes and a variable that specifies whether diabetes is present or not. Table 1 presents the attributes included in the dataset.
Table 1. Dataset attributes
|
Num |
Attribute |
Description |
|
1 |
Number of pregnancies |
The total count of pregnancies the patient has experienced. |
|
2 |
Glucose |
The glucose concentration in plasma measured two hours after completing a test in which glucose is ingested to assess the body’s capacity to metabolize it. |
|
3 |
Diastolic blood pressure |
The pressure in the arteries between heartbeats, expressed in millimeters of mercury (mm Hg). |
|
4 |
Skinfold thickness |
The measurement of the triceps skinfold expressed in millimeters (mm). |
|
5 |
Insulin |
The concentration of serum insulin recorded two hours after the test, measured in μU/ml. |
|
6 |
Body mass index (BMI) |
Weight in kg / (height in m)2. |
|
7 |
Diabetes Pedigree Function |
An index derived from the presence of diabetes within the individual’s family background. |
|
8 |
Age |
The age of the patient expressed in years. |
|
9 |
Outcome |
Categorical variable indicating class (0 or 1). |
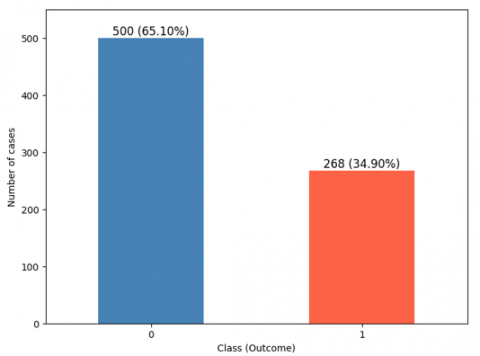
The target variable, called “outcome,” is binary: a value of 1 signifies that diabetes is present, while a value of 0 means it is not. This variable is critical to the predictive purpose of the analysis. As shown in Figure 1, of the 768 available records, 500 records, or 65.10% of the total, correspond to patients without diabetes, while the remaining 268 records, or 34.90%, correspond to patients with diabetes. This distribution provides an adequate basis for training and evaluating predictive models, allowing a clear differentiation by distinguishing individuals with and without diabetes.
Figure 1. Distribution of positive and negative cases of diabetes
3.1.2 Training and testing data
To thoroughly evaluate different approaches using machine learning to predict diabetes, the dataset was carefully split, with 80% used for training the models and the remaining 20% reserved for evaluation. The training dataset included a representative selection of patients, covering key clinical and demographic factors such as blood glucose levels, arterial pressure, body mass index (BMI), and genetic predisposition to diabetes. This subset of data was utilized for optimizing the parameters of the ML models, allowing them to learn to recognize relationships and trends present in the clinical data. In contrast, the test dataset, made up of the leftover 20%, was set aside solely for assessing how well the models performed. This subset was not used during the training process, ensuring an unbiased and objective evaluation of the models' performance on previously unseen data.
3.1.3 Handling of unbalanced data
Given the significant imbalance in the dataset, with 65.10% of records from patients without diabetes and 34.90% of records from patients with diabetes, the SMOTE technique was applied to mitigate this problem. SMOTE was applied to produce synthetic instances of the minority class (patients with diabetes) by generating new examples through interpolation of existing data. This technique increased the presence of underrepresented cases in the training dataset, balanced the proportion of records, avoided overfitting, and enhanced the model’s capacity to generalize to unseen data.
Imbalances between classes frequently occur in medical datasets, with the less frequent class usually corresponding to the condition being studied. SMOTE, a technique that generates synthetic instances by interpolating between minority samples and their closest neighbors, was used to address this issue [15]. Unlike methods such as ADASYN, which can introduce noise in complex regions, SMOTE maintains better class separation. Additionally, SMOTE contributes to a more representative and balanced sample, which improves model performance.
3.1.4 Cross validation
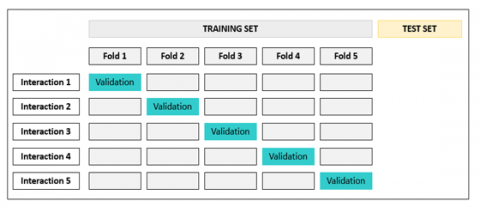
To guarantee the stability and dependability of the developed machine learning models, a 5-fold cross-validation approach was implemented. As shown in Figure 2, this approach consisted of splitting the dataset into five equal portions. During each iteration, four of these sections were allocated for model training, whereas the last one was designated for evaluating how well it performed. This process was carried out five times, with a different segment chosen for validation in each cycle, allowing for a clearer and more reliable evaluation of how well the model performs.
Figure 2. Cross-validation representation
3.2 Machine learning models
Nine algorithms based on supervised learning were selected to assess their effectiveness in predicting diabetes. To perform this evaluation, the Python programming language was used, which is known for its wide range of libraries specialized in ML. In addition, Jupyter Notebook was utilized as an interactive platform, providing a flexible and efficient environment for coding, data analysis, and result visualization. Its features allowed for seamless execution of code, facilitating both the implementation of ML models and the interpretation of their outcomes. Each of the chosen models is described below.
3.2.1 Decision tree
This ML approach is employed to address problems involving either classification or regression. As indicated in the study [16], this method allows for the identification of relationships between data in a dataset by building tree-like structures. To build a decision tree, the data is split into multiple subsets, producing a sequence of decision nodes that further branches into additional nodes. The initial node, called the root node, is the starting point of this division, while the final nodes, which are not further divided, are called leaf nodes. Decision trees are developed using a top-down structured model, which facilitates the identification of underlying trends and associations in the dataset.
3.2.2 Naïve bayes
NB utilizes Bayes' theorem as its foundation for classification, assuming that the features in the dataset are independent of one another [17]. It is a simple yet powerful approach, especially well-suited for processing large datasets efficiently.
3.2.3 K-Nearest Neighbors
The KNN classifier is a supervised ML model that makes no assumptions about the underlying data distribution, making it non-parametric. It works by considering the distance between data points, classifying a new instance according to the most common class among its closest neighbors [18]. In other words, KNN assigns a class to an object based on the predominant classes among its nearest neighboring data samples.
3.2.4 Logistic regression
RL is a statistical analysis and ML technique applied to estimate the likelihood of a dichotomous result. RL models rely on the independent relationship between predictor variables to estimate the likelihood of an event taking place [19].
3.2.5 Random Forest
RF is a machine learning approach that can be employed for solving tasks involving either classification or regression. This ensemble method builds multiple decision trees from the training data and evaluates the test data against them [20]. Through the integration of outputs from every tree, RF enhances accuracy and minimizes overfitting, producing a model that is more stable and capable of generalizing to new data.
3.2.6 Artificial Neural Networks
ANN represent a machine learning approach modeled after the organization and operation of the human brain. These networks consist of three main layers: the input layer, responsible for receiving the data; the hidden layers, where processing and feature extraction take place; and the output layer, which produces the final prediction or classification. Each layer is interconnected, enabling data flow and processing to generate precise outcomes [19]. At the initial stage, the layer receives the raw data, the hidden layers handle computations and extract features, and the output layer delivers the final prediction.
3.2.7 Support victor machine
SVM is a supervised learning method employed to separate data into two clearly defined classes. This method is trained on a previously classified data set, allowing a model to be built that reflects the characteristics of that data. The purpose of an SVM classifier is to determine which of the two categories a new data point belongs to base on the trained model [21]. Thus, SVM acts as a linear classifier that can effectively handle non-binary classification problems.
3.2.8 XGBoost
XGBoost is a sophisticated machine learning technique mainly applied to tackle both classification and regression tasks. Its key advantage is the ability to build multiple decision trees in sequence, where each new tree aims to correct the mistakes of the previous ones. This method of continuously adding trees and adjusting the features allows the model to grow and improve its accuracy with each iteration [22].
3.2.9 AdaBoost
The AdaBoost functions as an algorithm in machine learning created to improve the effectiveness of models that classify data into two categories. This iterative algorithm adjusts the weights of misclassified instances in each cycle, focusing on the most difficult examples to progressively improve the model. As an ensemble learning method, AdaBoost increases the efficiency of classifiers by identifying and correcting their errors, transforming weak classifiers into robust and accurate classifiers [23].
3.3 Evaluation metrics
3.3.1 Accuracy
It is a metric that evaluates how accurate a model's predictions are compared to the total set of available data [24]. In other words, it represents the ratio of accurate predictions compared to the total amount of data assessed.
3.3.2 Precision
It is a measure used to assess how accurately a model predicts both positive and negative outcomes [25]. It focuses on the proportion of correct predictions within a given category relative to all predictions made in that category.
3.3.3 Recall
Also known as sensitivity, it is an important metric within statistics and machine learning that evaluates the effectiveness of a classification model in identifying positive instances. More specifically, it quantifies the fraction of correctly identified positive instances out of the total number of true positives, offering insight into the model’s ability to minimize false negatives [26].
3.3.4 F1 score
Serving as a performance indicator, the F1 score merges information from both precision and recall into one unified measure, offering a comprehensive assessment of a classifier’s effectiveness. It ensures a balanced assessment by considering both Type I and Type II errors, making it particularly useful in scenarios where an even trade-off between these two factors is crucial. With values ranging from zero to one, an F1 score close to one indicates better classifier performance [27], i.e., an effective combination of precision and recall in classifying data.
3.3.5 The region beneath the receiver operating characteristic curve (ROC-AUC)
ROC-AUC serves as a key metric for assessing a model’s capacity to differentiate among different classes [28]. It provides insight into the overall effectiveness of a classifier by measuring how effectively it separates positive and negative instances. A higher AUC value indicates an improved capacity of the model to differentiate among the various classes. This measure is essential for understanding the effectiveness of a model in accurately classifying data.
3.3.6 Area under the precision-recall curve
AUPRC is a metric designed to assess the accuracy of a classification model, particularly in scenarios involving imbalanced datasets [29]. This metric evaluates the relationship between the accuracy and recall of the model, helping to understand how well the model handles both positive and negative cases. Additionally, AUPRC is critical in such settings because it focuses on the minority class, providing more informative insights than AUC-ROC when positive instances are rare.
4.1 Evaluation with test data
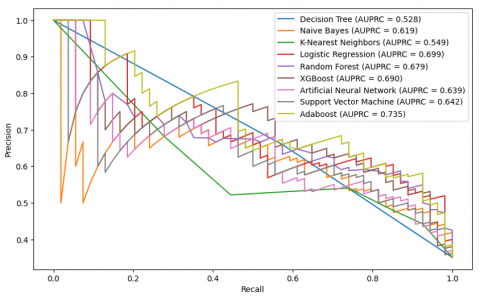
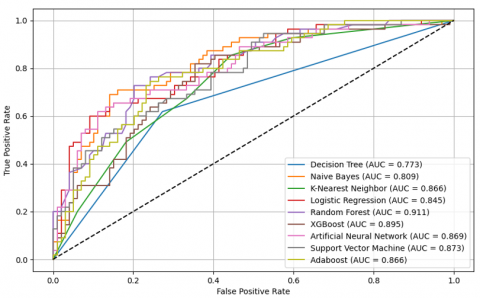
Table 2 presents the evaluation results on the test dataset, emphasizing the models’ performance through common assessment measures. The analyses of AUC and AUPRC are displayed in Figures 3 and 4, providing a comprehensive view of the models’ capacity to differentiate between classes and accurately classify diabetes cases. As can be seen, AdaBoost achieves the highest accuracy (0.766), a recall of 0.741, the highest F1 score (0.690), and stands out with an AUC of 0.839 and an AUPRC of 0.735. Based on the ROC and AUPRC curves, these metrics show that AdaBoost is not only good at telling the difference between diabetes cases that are positive and those that are negative, but it is also very good at discrimination and prediction.
Table 2. Evaluation result with test data
|
Model |
Accuracy |
Precision |
Recall |
F1 score |
|
DT |
0.745 |
0.660 |
0.574 |
0.614 |
|
NB |
0.721 |
0.582 |
0.722 |
0.644 |
|
KNN |
0.689 |
0.541 |
0.741 |
0.625 |
|
LR |
0.740 |
0.610 |
0.722 |
0.661 |
|
RF |
0.747 |
0.627 |
0.685 |
0.654 |
|
XGBoost |
0.760 |
0.650 |
0.685 |
0.667 |
|
ANN |
0.681 |
0.540 |
0.648 |
0.588 |
|
SVM |
0.714 |
0.569 |
0.759 |
0.651 |
|
AdaBoost |
0.766 |
0.645 |
0.741 |
0.690 |
On the other hand, XGBoost displayed notable performance, correctly identifying positives in about 76% (0.760) of cases, capturing roughly 68.5% (0.685) of all actual positive instances, and achieving an F1 score near 0.667. Its ability to distinguish between classes was strong, reflected in an AUC close to 0.82, while the area under the precision-recall curve reached approximately 0.69. Although competitive, XGBoost falls slightly behind AdaBoost in terms of AUC and AUPRC, suggesting that AdaBoost has slightly superior generalization and discrimination capabilities on this dataset. Similarly, RF and Logistic LR performed well. RF showed an overall accuracy of 0.747, capturing 68.5% (0.685) of the true positive cases, with an F1 score of 0.654. Its ability to distinguish between classes was reflected in an AUC of 0.821, while the area under the precision-recall curve reached 0.679. LR also demonstrated strong results, achieving an accuracy of 0.740, identifying 72.2% (0.722) of the positive instances, and obtaining an F1 score of 0.661, along with an AUC of 0.822 and an AUPRC of 0.699. In addition, other evaluated models show average performance and do not reach the performance level of AdaBoost or XGBoost in the key metrics of AUC and AUPRC. Finally, ensemble models, especially AdaBoost, stand out as the most effective for diabetes prediction on this test dataset, providing an optimal balance between precision, recall, and discriminative metrics such as AUC and AUPRC, making them highly recommended for practical applications in healthcare.
4.2 Evaluation with cross validation
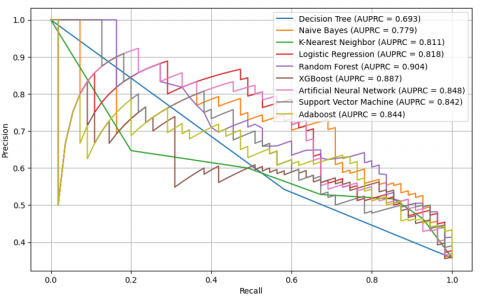
To enhance the reliability of the diabetes prediction models, cross-validation with five folds was applied for their evaluation. Table 3 presents the results of standard performance metrics including accuracy, precision, recall, and F1 score. On the other hand, Figure 5 and Figure 6 show the analysis of the AUC and AUPRC metrics, respectively, providing a detailed view of the discriminative capacity and accuracy of the models in classifying positive and negative cases of diabetes.
Table 3. Evaluation result with cross validation
|
Model |
Accuracy |
Precision |
Recall |
F1 Score |
|
DT |
0.769 |
0.756 |
0.783 |
0.771 |
|
NB |
0.717 |
0.750 |
0.651 |
0.697 |
|
KNN |
0.798 |
0.760 |
0.872 |
0.811 |
|
LR |
0.758 |
0.767 |
0.743 |
0.755 |
|
RF |
0.816 |
0.804 |
0.866 |
0.828 |
|
XGBoost |
0.811 |
0.783 |
0.858 |
0.816 |
|
ANN |
0.786 |
0.773 |
0.808 |
0.795 |
|
SVM |
0.794 |
0.778 |
0.826 |
0.800 |
|
Adaboost |
0.791 |
0.797 |
0.786 |
0.788 |
Figure 5. AUC-ROC analysis with cross-validation
Figure 6. AUPRC analysis with cross validation
The findings reveal clear differences in how the models perform. The Random Forest model performs particularly well, leading in key metrics with values of 0.816 for overall accuracy, 86.6% (0.866) for correctly identifying positive cases, an F1 score of 0.828, and demonstrating strong discriminative capability with an AUC of 0.911 and an AUPRC of 0.904. This superior performance suggests that RF is highly effective in both correctly classifying positive diabetes cases and minimizing false positives and false negatives. Similarly, XGBoost also shows outstanding performance, with metrics nearly comparable to RF, such as a recall of 0.858, an F1 score of 0.816, an AUC of 0.895, and an AUPRC of 0.887, indicating its robust ability to handle the complexity of the dataset. AdaBoost also stands out with remarkable performance, achieving an F1 score of 0.788, an AUC of 0.866, and an AUPRC of 0.844, suggesting its effectiveness in predicting diabetes, although it does not reach the performance of RF or XGBoost.
Other models such as SVM and ANN also perform well overall, with F1 scores of 0.800 and 0.795, respectively, and AUCs above 0.86, although they do not outperform RF, XGBoost, or AdaBoost on any key metric. The K-Nearest Neighbors (KNN) model performs well with an F1 score of 0.811 and an AUC of 0.866 and stands out in terms of recall (0.872), but its overall accuracy is slightly lower than the best models. On the other hand, the Naive Bayes (NB) and Logistic Regression (LR) models show inferior performance compared to the other models, especially in terms of recall (0.651 for NB and 0.743 for LR) and F1 score (0.697 for NB and 0.755 for LR), indicating that these models may not be the most appropriate for this type of prediction on this dataset.
While RF showed superior performance during cross-validation (Table 3), AdaBoost outperformed it on the test set (Table 2). This discrepancy may be attributed to potential overfitting in Random Forest, which can capture noise during training, whereas AdaBoost’s iterative focusing on difficult samples might enable better generalization to unseen data. Such variation underscores the importance of evaluating models on both validation and independent test sets.
This study evaluated how well several supervised machine learning models can predict diabetes. Although previous studies have examined machine learning approaches for diabetes prediction, the majority have focused on assessing the effectiveness of a single model or a limited group of models, without providing a comprehensive comparison across multiple models using the same set of evaluation metrics. The absence of direct comparisons has made it challenging to determine which model performs best for this particular task.
In this study, a comparative analysis of the results obtained through evaluation of test data and cross-validation reveals notable differences in the performance of machine learning models for diabetes prediction. In cross-validation, the RF model stood out with an accuracy of 0.816, an AUC-ROC of 0.911, and an AUPRC of 0.904, indicating superior performance in terms of discrimination and overall accuracy. It was followed by the XGBoost, ANN, SVM, AdaBoost, and RL models, which also showed significant performance. However, when evaluated on test data, AdaBoost stood out with the highest accuracy of 0.766, an AUC-ROC of 0.839, and an AUPRC of 0.735, indicating greater robustness to unseen data. It was followed by the RL, Random Forest, and XGBoost models, which also achieved remarkable performance.
By comparing the results with previous studies that evaluated machine learning models using similar data, it was observed that various factors such as blood pressure, maternal history, blood sugar concentration, age, insulin levels, dermal thickness, and the diabetes pedigree feature are useful for estimating the likelihood of diabetes onset. In the study by Bandhu et al. [9], decision tree models were found to have an accuracy of 78.89%, while in the study by Abdalrada et al. [13], logistic regression models showed high accuracy with a rate of 77.6% and good sensitivity and specificity. Furthermore, the study by Muntiari et al. [30] highlighted that the Random Forest algorithm achieved an accuracy of 93.5%, establishing itself as an effective method for diabetes diagnosis. In the study [7], the authors applied advanced techniques to handle class imbalance, including SMOTE and ADASYN, along with K=10 cross-validation. Their optimized extra trees model achieved strong results: 92.5% accuracy, 93.7% F1-score, and an AUC-ROC of 92.47%. In contrast, the present study used SMOTE and K=5 cross-validation, with AdaBoost emerging as the best performer on the test set, while Random Forest showed robust results during cross-validation, achieving an AUC-ROC of 0.911 (91.1%). While both studies report high predictive performance, the slightly lower AUC-ROC in the present study may be influenced by differences in model architecture, validation strategy, and data resampling techniques. Specifically, while Aouragh et al. [7] employed both SMOTE and ADASYN to enhance minority class representation, our approach relied solely on SMOTE, which may affect the balance and diversity of synthetic samples. Additionally, the use of fewer cross-validation folds (K=5 vs. K=10) could lead to increased variance in performance estimates. Despite these differences, both studies reinforce the importance of ensemble methods and class balancing in improving diabetes prediction. However, the nuanced methodological choices underscore the need for careful tuning and evaluation to ensure model generalizability.
The observations indicate that the Random Forest and AdaBoost ensemble models demonstrate the highest consistency when assessed using cross-validation and test datasets. Furthermore, XGBoost, ANN, SVM, and RL also show significant performance with both scoring methods in diabetes prediction when analyzed with different metrics, including AUC-ROC and AUPRC, and considering factors such as blood pressure, pregnancy, glucose level, age, and insulin, among others. This comparison highlights the necessity of applying various evaluation techniques to obtain a comprehensive understanding of how machine learning models perform in predicting diabetes. The detailed and comprehensive comparison allows the identification of the most effective and robust models, providing a solid foundation for future research and clinical applications in this field.
From a clinical perspective, deploying these models has the potential to significantly enhance decision-making processes. Integrating the predictive system with electronic health records (EHRs) could allow for real-time assessment of patient risk. This would allow clinicians to identify high-risk patients early and allocate resources more efficiently. Such integration can also facilitate seamless workflows, reduce diagnostic delays, and support personalized treatment strategies. However, for successful adoption, considerations such as model interpretability, data privacy, and regulatory compliance must be addressed to ensure safe and effective clinical implementation.
However, a significant limitation of this study is its reliance on the Pima Indian dataset, which only includes female patients from a single ethnic group. This homogeneity limits the applicability of the models to populations with diverse gender and ethnic backgrounds. To ensure robustness and applicability in real-world clinical settings, future work should consider training and validating the models on more heterogeneous datasets that incorporate demographic variables such as gender, ethnicity, and age.
This research was conducted with the objective of evaluating different machine learning models and algorithms using a range of performance metrics to predict diabetes. The results show that RF and AdaBoost models, along with others such as XGBoost, ANN, SVM, and RL, proved to be the most consistent when evaluated on test and cross-validation data using multiple metrics, including AUC-ROC and AUPRC. These evaluations were performed on a dataset that included variables like blood pressure, pregnancy status, glucose concentration, age, and insulin levels, among others. This comparison highlights the significance of employing multiple evaluation metrics to obtain a comprehensive view of the performance of ML models in predicting diabetes. The use of metrics such as AUC-ROC and AUPRC is crucial, especially in unbalanced datasets, as they provide a better understanding of the capacity of the model to differentiate between distinct class labels, thus identifying the most effective and robust approaches. However, the primary constraint of this study is the limited size of the dataset, which could restrict the generalizability of the findings. Future work should focus on expanding the datasets and exploring the integration of new clinical and sociodemographic variables to strengthen the external validity of the models. In addition, the use of advanced data balancing techniques, such as SMOTE and ADASYN, along with rigorous cross-validation assessments, should continue to be standard practice to improve the reliability and stability of predictive models in this area.
Appreciation is extended to those who offered guidance and recommendations, which assisted in the successful completion of the research.
[1] Guo, H., Wu, H., Li, Z. (2023). The pathogenesis of diabetes. International Journal of Molecular Sciences, 24(8): 6978. https://doi.org/10.3390/ijms24086978
[2] Alanazi, B.A., Alsefry, S.S., Alanazi, S.M.S., Alibrahim, H.A.J., Bonayan, R.Y., Alghamdi, L.K., Almodehash, N.A. (2024). Association between type II diabetes mellitus and cardiovascular disease in Saudi Arabia. International Journal of Medicine in Developing Countries, 8(1): 123-127. https://doi.org/10.24911/IJMDC.51-1699221406
[3] Paucar, I.R., Yactayo-Arias, C., Andrade-Arenas, L. (2025). Random Forest model based on machine learning for early detection of diabetes. International Journal of Advanced Computer Science & Applications, 16(6): 1051. https://doi.org/10.14569/ijacsa.2025.01606103
[4] Lagunzad, H.C., Impang, M.A.C., Gonzaga, M.V., Lawan, J.F., Pineda, F.C., Tanjente, R.A.A. (2022). Predicting the early sign of diabetes using ID3 as a data model. In 2022 14th International Conference on Computer and Automation Engineering (ICCAE), Brisbane, Australia, pp. 135-139. https://doi.org/10.1109/ICCAE55086.2022.9762442
[5] Kaur, S., Kaur, D., Mayank, M., Singh, N.T. (2023). Diabetes detection using random forest classifier and risk score calculation using random forest regressor. In Artificial Intelligence, Blockchain, Computing and Security Volume 2, London: CRC Press, pp. 426-431. https://doi.org/10.1201/9781032684994-68
[6] Ahmed, U., Issa, G.F., Khan, M.A., Aftab, S., Khan, M.F., Said, R.A.T., Ghazal, T.M., Ahmad, M. (2022). Prediction of diabetes empowered with fused machine learning. IEEE Access, 10: 8529-8538. https://doi.org/10.1109/ACCESS.2022.3142097
[7] Aouragh, A.A., Bahaj, M., Toufik, F. (2024). Diabetes prediction: Optimization of machine learning through feature selection and dimensionality reduction. International Journal of Online and Biomedical Engineering, 20(8): 100-114. https://doi.org/10.3991/ijoe.v20i08.47765
[8] Alzboon, M.S., Al-Batah, M.S., Alqaraleh, M., Abuashour, A., Bader, A.F.H. (2023). Early diagnosis of diabetes: A comparison of machine learning methods. International Journal of Online and Biomedical Engineering, 19(15): 144-165. https://doi.org/10.3991/ijoe.v19i15.42417
[9] Bandhu, K.C., Litoriya, R., Rathore, A., Safdari, A., Watt, A., Vaidya, S., Khan, M.A. (2023). Integrating machine learning for accurate prediction of early diabetes: A novel approach. International Journal of Cyber Behavior, Psychology and Learning, 13(1): 1-24. https://doi.org/10.4018/IJCBPL.333157
[10] Kumar, A., Gill, A.S., Singh, J.P., Ghosh, D. (2024). A comprehensive and comparative examination of machine learning techniques for diabetes mellitus prediction. In 2024 15th International Conference on Computing Communication and Networking Technologies (ICCCNT), Kamand, India, pp. 1-5. https://doi.org/10.1109/ICCCNT61001.2024.10725693
[11] Charan, K.S., Eduru, S., Devaru, J.R., Divyashree, H.B. (2025). Diabetes prediction with Random Forest-Logistic Regression algorithm using voting classifier. In 2025 International Conference on Knowledge Engineering and Communication Systems (ICKECS), Chickballapur, India, pp. 1-6. https://doi.org/10.1109/ICKECS65700.2025.11035945
[12] Imaduddin, H., Widayat, W., A’Ia, F.Y. (2025). Classification of diabetes using ensemble and individual machine learning algorithms. In 2025 2nd International Conference on Advanced Innovations in Smart Cities (ICAISC). Jeddah, Saudi Arabia, pp. 1-5. https://doi.org/10.1109/ICAISC64594.2025.10959526
[13] Abdalrada, A., Neamah, A.F., Murad, H. (2024). Predicting diabetes disease occurrence using logistic regression: An early detection approach. Iraqi Journal for Computer Science and Mathematics, 5(1): 160-167. https://doi.org/10.52866/ijcsm.2024.05.01.011
[14] UCI Machine Learning. (2016). Pima Indians Diabetes Database. Kaggle. https://www.kaggle.com/datasets/uciml/pima-indians-diabetes-database
[15] Elreedy, D., Atiya, A.F., Kamalov, F. (2024). A theoretical distribution analysis of synthetic minority oversampling technique (SMOTE) for imbalanced learning. Machine Learning, 113(7): 4903-4923. https://doi.org/10.1007/s10994-022-06296-4
[16] Thomas, T., Vijayaraghavan, A.P., Emmanuel, S. (2020). Applications of decision trees. In Machine Learning Approaches in Cyber Security Analytics, pp. 157-184. https://doi.org/10.1007/978-981-15-1706-8_9
[17] Soria, D., Garibaldi, J.M., Ambrogi, F., Biganzoli, E.M., Ellis, I.O. (2011). A ‘non-parametric’ version of the naive Bayes classifier. Knowledge-Based Systems, 24(6): 775-784. https://doi.org/10.1016/j.knosys.2011.02.014
[18] Yeruva, S., Harshitha, M.S., Kavya, M., Sree, M.S.D., Sahithi, T.S. (2023). Credit card fraud detection using machine learning. International Journal of Engineering and Advanced Technology (IJEAT), 12(4): 25-30. https://doi.org/10.35940/ijeat.D4048.0412423
[19] Zhang, J. (2023). Credit card fraud detection using predictive model. BCP Business & Management, 38: 2820-2826. https://doi.org/10.54691/bcpbm.v38i.4196
[20] Prajwala, T.R. (2015). A comparative study on decision tree and random forest using R tool. International Journal of Advanced Research in Computer and Communication Engineering, 4(1): 196-199. https://doi.org/10.17148/IJARCCE.2015.4142
[21] Soni, K.B., Chopade, M., Vaghela, R. (2021). Credit card fraud detection using machine learning approach. Applied Information Systems and Management, 4(2): 71-76. https://doi.org/10.15408/aism.v4i2.20570
[22] Rao, C., Liu, Y., Goh, M. (2023). Credit risk assessment mechanism of personal auto loan based on PSO-XGBoost model. Complex and Intelligent Systems, 9(2): 1391-1414. https://doi.org/10.1007/s40747-022-00854-y
[23] Shahraki, A., Abbasi, M., Haugen, Ø. (2020). Boosting algorithms for network intrusion detection: A comparative evaluation of Real AdaBoost, Gentle AdaBoost and Modest AdaBoost. Engineering Applications of Artificial Intelligence, 94: 103770. https://doi.org/10.1016/j.engappai.2020.103770
[24] El Massari, H., Gherabi, N., Mhammedi, S., Ghandi, H., Bahaj, M., Naqvi, M.R. (2022). The impact of ontology on the prediction of cardiovascular disease compared to machine learning algorithms. International Journal of Online and Biomedical Engineering, 18(11): 143-157. https://doi.org/10.3991/ijoe.v18i11.32647
[25] Patayon, U.B., Crisostomo, R.V. (2022). Peanut leaf spot disease identification using pre-trained deep convolutional neural network. International Journal of Electrical and Computer Engineering (IJECE), 12(3): 3005-3012. https://doi.org/10.11591/ijece.v12i3.pp3005-3012
[26] Baker, M.R., Mahmood, Z.N., Shaker, E.H. (2022). Ensemble learning with supervised machine learning models to predict credit card fraud transactions. Revue d’Intelligence Artificielle, 36(4): 509-518. https://doi.org/10.18280/ria.360401
[27] Afriyie, J.K., Tawiah, K., Pels, WA., Addai-Henne, S., Dwamena, H.A., Owiredu, E.O., Ayeh, S.A., Eshun, J. (2023). A supervised machine learning algorithm for detecting and predicting fraud in credit card transactions. Decision Analytics Journal, 6: 100163. https://doi.org/10.1016/j.dajour.2023.100163
[28] Janssens, A.C.J., Martens, F.K. (2020). Reflection on modern methods: Revisiting the area under the ROC curve. International Journal of Epidemiology, 49(4): 1397-1403. https://doi.org/10.1093/ije/dyz274
[29] Leevy, J.L., Khoshgoftaar, T.M., Hancock, J. (2022). Evaluating performance metrics for credit card fraud classification. In 2022 IEEE 34th International Conference on Tools with Artificial Intelligence (ICTAI), Macao, China, pp. 1336-1341. https://doi.org/10.1109/ICTAI56018.2022.00202
[30] Muntiari, N.R., Nisa, K., Sandi A., A. S., Ashari, I.A., Hanif, K.H., Dwinanto, R.W. (2023). Comparison of random forest algorithm, support vector machine, and k-nearest neighbor for diabetes disease classification. AIP Conference Proceedings, 2706: 020060. https://doi.org/10.1063/5.0120218