Abdul-Nasir Abdulla Mahdi Al-Tamimi*![]() | Nawras A. S. Al-Obeidi
| Nawras A. S. Al-Obeidi![]()
© 2025 The authors. This article is published by IIETA and is licensed under the CC BY 4.0 license (http://creativecommons.org/licenses/by/4.0/).
OPEN ACCESS
In recent years, Iraqi lands have been suffering from a severe water crisis due to extreme climate changes, including high temperatures and low rainfall, as well as poor water quality resulting from high concentrations of pollutants. Therefore, there is a need to preserve and sustain water resources, the current study aimed to influence the waters of Tharthar and Habbaniyah lakes on the quality of the Euphrates River water near the city of Al-Khalidiyah (Anbar Governorate) by employing a group of physical and chemical factors and heavy metals through mathematical indicators to determine the quality of water, namely the Horton's Water Quality Index (HWQI) and the heavy metal pollution index (HMPI). Four sites were selected in the study area: Site 1 was at the Euphrates River (before the mixing zone), Site 2 was selected at the Habbaniyah Canal, Site 3 was selected at the Tharthar Canal, and Site 4 was selected at the Euphrates River after the mixing zone, for the period from July 2023 to March 2024. 14 environmental factors were examined, including: pH, Alkalinity, EC, Turbidity, TDS, TSS, Hardness, Ca, Mg, DO, BOD5, NO3, PO4, SO4, most of which exceeded the Iraqi standard limits except for the following factors: pH, EC, TSS, DO, NO3, while four heavy elements were examined: Pb, Ni, Cd, Cu, all of whose concentrations were within the Iraqi standard limits. The results of the concentrations of physical and chemical factors and heavy metals were consistent with the results of the HWQI and the HMPI, where the lowest rate of the HWQI was recorded at 74.5 in the Tharthar Canal, where the water quality was described as good, while the highest rate was recorded at 142 in the Euphrates River (site 1), where the water quality was described as poor, compared to Site 4 (Mixing Area), which scored 73.5 (Good). The highest HMPI was recorded at 6.323 in Habbaniyah Canal, while the lowest was 0.921 in the Euphrates River (site 1), compared to Site 4 (Mixing Area) which scored 2.872. The results of the current study showed that the quality of the Tharthar Canal water, which is affected by the dilution of its water from the Al-Halwa Canal, which flows into it, has a positive effect on improving the quality of the Euphrates River water. Conversely, the Habbaniyah Canal water harms the quality of the Euphrates River water in the current study area. Due to the lack of application of HWQI and HMPI water quality indices in the current study area, these indices were applied, as water quality indices are the backbone of integrated water quality management, through which abstract concepts of quality are transformed into understandable data that can be measured and analyzed, which enables decision makers to identify problems and evaluate and protect aquatic ecosystems effectively and sustainable.
heavy metal pollution index, Horton's Water Quality Index, Tharthar and Habbaniyah lakes, Euphrates River
Water quality is one of the key indicators that determine its suitability for human use, whether for drinking, agriculture, industry, or even maintaining ecological balance [1]. With increasing environmental and human pressures on water resources due to climate change, increased consumption rates, and pollution, there is an urgent need to monitor water quality and identify indicators that reflect its condition. Water quality indices serve as assessment tools that provide accurate and measurable information about the physical, chemical, and biological properties of water, helping to determine its compliance with established health and environmental standards. These indicators play a pivotal role in developing integrated water resource management strategies and ensuring their sustainability for future generations [2]. Lake Habbaniyah suffers from many pollutants. Its water is characterized by being hard and sulfurous, with sufficient amounts of nutrients [3]. The Warar Canal is the most influential source of water on the lake, which is the main feeder of the lake's water. The water of the Warar Canal is affected by untreated sewage from homes and the maternity and children’s hospital, as well as water from agricultural and industrial and many studies have shown that its water contains a high percentage of sulfates [2, 3].
Tharthar waters suffer from salinity and hardness due to the geological formations that lie above it, and the dead storage area is 40 meters (storage that cannot be emptied naturally, which poses a challenge in the process of using lake water as a feeder to supplement the Euphrates River water during the dry season via the Tharthar-Euphrates Canal [4]. On the other hand, the waters of this canal are affected by the Tigris River waters via the Tigris Canal and agricultural, industrial, and human uses. Heavy metals are widely present in aquatic ecosystems, especially during the current century, as a result of the expansion and excessive exploitation of natural resources by human activities, as living organisms in general and humans in particular are exposed to them. Heavy metals are elements with a high molecular weight, and their density is approximately four to five times that of water at the same pressure and temperature [5]. Some heavy elements are involved in the vital processes of living organisms, plants, and animals, such as copper and zinc, as micronutrients for them, while some metals, such as cadmium and lead, have no known physiological role. Living organisms are biologically affected in the long term when exposed to heavy metals, as these metals accumulate in their tissues, leading to damage to their functions and destruction [6]. The areas surrounding the Habbaniyah Canal suffer from the indiscriminate dumping of industrial waste, which contributes to the contamination of the area's water with lead and cadmium from auto repair shops, engines, and electric generators, as well as lead emissions from the exhaust of these engines. In addition, the high temperature of the water increases the solubility of the lead element [7]. Pesticides play a role in increasing the concentrations of lead and cadmium in the water, as is the case in the agricultural areas adjacent to the Tharthar Canal [8]. The waters of the two canals may suffer from nickel pollution from sewage and agricultural wastewater, such as phosphate fertilizers. Also, the waters of the two canals may suffer from copper pollution from agricultural waste, such as fungicides [9]. The current study is one of the pioneering studies in the study area on the effect of the two lakes’ water channels on the quality of the Euphrates River water, as it came as a continuation of the study of Al-Tamimi and Al-Lahebi [4], which dealt with the study of two types of water quality indices, namely NSF-WQI and CCME-WQI. This research aims to highlight the most important indicators of water quality selected in the current study and explain the methods of measuring them and their importance in assessing the condition of the Euphrates River in the current study sites, in addition to showing the effects of environmental changes on the Tharthar and Habbaniyah lakes in the Euphrates River, within the framework of promoting public health and achieving sustainable development, especially related to clean water and sanitation, industrial and agricultural services.
2.1 Study area
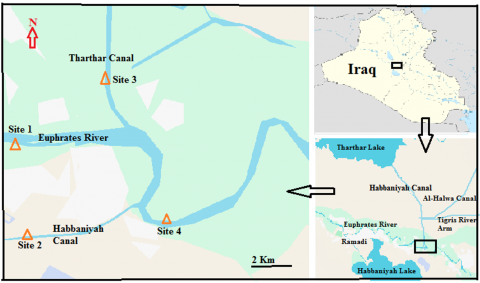
Lake Tharthar is located in Iraq, northwest of Tikrit Governorate and north of Anbar Governorate. It is one of the largest natural depressions in Iraq. It has been used since 1956 to store water from the Tigris River. Tharthar was later connected to the Tigris and Euphrates Rivers, allowing sufficient quantities of irrigation water to be returned to the Tigris and Euphrates Rivers. Its area is 2,710 km2, with the highest storage level reaching 65 m and the storage volume at this level reaching 85.59 billion m3. In 1976, the Tharthar-Euphrates canal was established south of Tharthar Lake and ends in the Euphrates River at the exit of Al-Dhaban (Habbaniyah Canal) to the north of the city of Fallujah. The canal is about 37.5 km long, and the Tharthar-Euphrates Canal is supplied by the Al-Helwa canal, linked to the waters of the Tigris River at the Samarra Dam and empties into the division canal, which is about 80 km long [4].
Lake Habbaniyah is located in western Iraq within Anbar Governorate. It was established in 1956 to store water from the Euphrates River. It was established in 1976. The lake has a strategic water reserve. The area of the lake is about 426 Km2, and the highest water storage level is 51 m. The total water capacity is about 3 billion m3. The Sin al-Dhaban Canal (Habbaniyiah Canal) is an important factor in draining the lake water in the summer season at the Euphrates River near Habbaniyah District, as it returns water from Lake Habbaniyah to the Euphrates River. The length of the canal is about 9 km (Figure 1) [3].
Figure 1. Map of selected sample collection sites (Google map)
2.2 Sampling collection
Four sites were selected during the current study period from July 2023 to March 2024 (Table 1). Site 1 was selected at the Euphrates River before the confluence of the two lakes' canal outlets in the Al-Kaldiah area. Site 2 was selected at the Sin al-Dhiban Canal to represent the waters of Lake Habbaniyah. Site 3 was selected at the Tharthar-Euphrates Canal near the al-Bushjel area to represent the waters of Lake Tharthar. Site 4 on the Euphrates River at Al-Siddiqah Bridge was chosen to represent the site of the combined effects of the waters of Lake Habbaniyah and Lake Tharthar canals (Figure 1). Water samples were collected at a rate of one sample per month for a period of nine months, and an average was taken for four seasons during the study period.
Table 1. Geographic coordinates of sample collection sites (GPS)
|
Site |
Latitude (North) |
Longitude (East) |
||||
|
Site 1 (Euphrates River before mixing) |
33° |
23' |
32" |
43° |
33’ |
56" |
|
Site 2 (Habbaniyah Canal) |
33° |
22' |
04" |
43° |
32’ |
42" |
|
Site 3 (Tharthar Canal) |
33° |
24' |
19" |
43° |
36’ |
19" |
|
Site 4 (Euphrates River after mixing) |
33° |
22' |
08" |
43° |
37’ |
19" |
2.3 Physicochemical parameters analysis
Water samples from the studied sites were collected from a depth of 30 cm using plastic containers and were transferred directly to the laboratory to conduct the necessary tests. Field tests were conducted directly in the field, where a digital portable multi-meter (Hach HQ40d-Germany) was used to measure the pH, electrical conductivity, and total dissolved solids, while the turbidity was measured using a turbidity meter (Lovibon-Germany). Another set of factors was tested in the laboratory less than 24 hours after they were collected from the field. Where the total alkalinity (TA), total hardness (TH), calcium (CA), magnesium (Mg), total dissolved solids (TDS), total suspended solids (TSS), dissolved oxygen (DO), biochemical oxygen demand (BOD), nitrates (NO3) and sulfates (SO4) were measured based on the methods shown in APHA [10]. As for phosphate (PO4), the method is shown in Eisenreich [11].
2.4 Water quality indices
2.4.1 Horton's Water Quality Index (HWOI)
According to the importance of the relevant factors, 14 factors were chosen to extract the values of this index according to the equations below [12]:
$W_i=\frac{w i}{\sum_{i-1}^n w i}$ (1)
where, Wi is the relative weight and wi is the weight of each of the measured factors, so that their sum equals 1, and it was extracted according to the equation described in study [13] as follows:
$w_i=\frac{K}{V s}$ (2)
And
$K=1 / \Sigma \frac{1}{V s}$ (3)
where, K is the constant of probability and Vs is the recommended standard value for n th parameters according to the Iraqi Standard for drinking water [14].
$q i=\left(\frac{V n-V i}{V s-V i}\right) * 100$ (4)
where, qi is the parameter quality rating, Vn is the value of the measured limiting n th parameter, and Vi is the parameter ideal value, which is zero except for pH = 7 and Do = 14.6.
$S l i=W i * q i$ (5)
The Sli sub-index for each n th parameter.
$W Q I=\sum_{i=1}^n S l i$ (6)
The Horton Water Quality Index scale is shown in Table 2.
Table 2. Water quality classifications according to Horton's Water Quality Index
|
Class |
Excellent |
Good |
Poor |
Very Poor |
Unsuitable |
|
WQI |
˂ 50 |
50 - 100 |
100 - 200 |
200 - 300 |
˃ 300 |
2.4.2 Heavy metal pollution index (HMPI)
It is one of the modified methods of Horton's guide method, except for neglecting the value of Vi, as shown in study [5].
$\mathrm{HMPI}=\frac{\sum_{i-1}^n Q i * w i}{\sum_{i-1}^n w i}$ (7)
where, wi is the relative weight of each of the measured i th parameter and can be deduced according to the aforementioned Eqs. (2) and (3), provided that the sum of all weights equals 1.
And Qi is the subindex of the i th parameter. It can be extracted according to Eq. (8) as below:
$Q i=\frac{V n}{S n} * 100$ (8)
where, Vn are the values of the n th parameter during the current study, and Sn is the standard values approved by the Iraqi standard specifications for drinking water. Heavy metal pollution index values range less than 100 [15].
2.5 Statistical analysis
The statistical program SAS [16] was used to analyze the effect of sites on the studied traits, and the significant differences between the averages were compared using the least significant difference test (LSD) at the probability level of 0.05. The statistical program SPSS ver.16 was used to design the Pearson matrix to extract the correlation coefficient between all physical and chemical parameters and water quality indices at the probability level of 0.05 and 0.01.
3.1 Physical and chemical parameters analysis
Table 3 shows the values of the physical and chemical parameters recorded at the sample collection sites during the current study period.
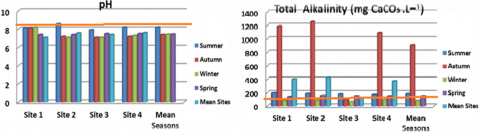
The effect of the pH rates of the two lake water sites on the quality of the Euphrates River water was not observed, as there were no significant differences between all sites, as their values were between 7 and 8, and this may be attributed to the fact that Iraqi water is described as having a high buffer capacity (Figure 2) [17]. The Euphrates and Habbaniyah River sites were characterized by high alkalinity exceeding the permissible limits [14], as significant differences were recorded between all sites. The highest rate was recorded in sites 1 and 2, exceeding 400 mg.L-1, while the lowest rates were recorded in site 3 (Tharthar Canal) at about 125 mg.L-1. This is due to the influence of this channel by the waters of the Al-Halwa Canal, which originates from the waters of the Tigris River, leading to its dilution [18]. Seasonally, the highest alkaline rates were recorded in the fall, with the exception of Site 3. This may be attributed to rainwater, which leads to soil erosion and washing, as the Euphrates River basin is known for its calcareous soil (Figure 2) [19].
Table 3. Range (above) and average (below) of values of physical and chemical parameters recorded at sampling sites
|
Parameters |
Iraqi Stand. |
Site 1 |
Site 2 |
Site 3 |
Site 4 |
L.S.D |
|
pH |
6.5 - 8.5 |
7.4 - 8.2 7.10 |
7.1 - 8.6 7.57 |
7.1 -7.9 7.4 |
7.2 -8.2 7.6 |
0.502 NS |
|
Alkalinity (mg CaCO3.L-1) |
100 |
83 - 1189 402.0a |
89 - 1259 423.8a |
70-181 125.2b |
96-1089 376.5a |
137.9* |
|
EC )µ.s.cm-1) |
2000 |
1350-1942 1808a |
1842 - 1987 1900s |
1319-1968 1504b |
1341- 1534 1482b |
217.5* |
|
Turbidity (NTU) |
5 |
3.2 - 7.3 5.2b |
2.2-6.8 4.4b |
3.6-13.0 7.8a |
2.7-7.1 4.7b |
2.08* |
|
TDS (mg.L-1) |
500 |
913 - 1238 1021.8a |
9.3 - 1142 999.5a |
574-1239 782.8b |
895-1415 1066.3a |
169.4* |
|
TSS (mg.L-1) |
1000 |
26 - 198 67.7 |
25 - 225 81.0 |
23.4- 210 76.8 |
25 – 218 87.0 |
37.66 NS |
|
Total Hardness (mg CaCO3.L-1) |
500 |
489 - 580 532.5a |
484-578 526.0a |
235-590 423.0b |
306-687 497.5ab |
78.91* |
|
Ca (mg. L-1) |
50 |
63.1 - 137 98.13a |
24.2-148 90.0a |
39.4-148 62.38b |
44.0-161 99.0a |
22.76* |
|
Mg (mg.L-1) |
50 |
47 - 89.7 64.2a |
43.7-83.2 51.0ab |
18.3-52 39.3b |
29.7-87.2 61.8a |
17.52* |
|
DO (mg.L-1) |
5 |
4.8 - 8.3 7.23 |
3.1-9.2 7.25 |
4.7-9.8 8.0 |
5.1-8.8 7.3 |
1.69 NS |
|
BOD5 (mg.L-1) |
3 |
4.3 - 11.2 6.62 |
4.0-13.2 6.35 |
2.0-11.4 6.90 |
1.0-15.6 6.0 |
1.45 NS |
|
NO3 (mg.L-1) |
50 |
0.04 - 6.20 4.19ab |
0.08-12.80 5.59a |
0.06-5.20 2.60b |
0.04-4.22 6.90a |
2.896 * |
|
PO4 (mg.L-1) |
0.1 |
0.82 -1.81 0.70a |
0.24-2.20 0.74a |
0.14-0.19 0.16b |
0.12-0.41 0.22b |
0.287 * |
|
SO4 (mg.L-1) |
250 |
301 -562 442 |
340-483 430 |
210-498 334 |
329-473 392 |
158.09 NS |
Means with different letters within the same row differ significantly from each other at the probability level * (P≤0.05) and NS (Non-significant)
Figure 2. Seasonal and spatial variations of pH and TA values during the study period (Iraqi standard)
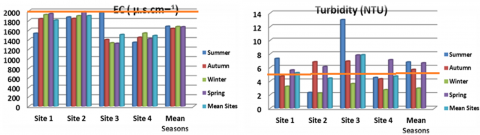
In general, the EC values did not exceed the permissible limits [14], as their values showed significant differences. The values of sites 1 and 2 (river water before mixing and Habbaniyah Canal water) were close, recording 1808 and 900 µ.s.cm-1, respectively, while the EC values recorded lower rates in sites 3 and 4 (Tharthar Canal and Euphrates River after mixing), 1504 and 1482 µ.s. cm-1, which gives the impression that Tharthar water has a positive effect in reducing the EC values of Euphrates River water [4]. No clear seasonal variation was recorded in EC values (Figure 3). Turbidity rates showed noticeable seasonal and site-specific variations with statistically significant differences. Tharthar Canal water (site 3) recorded the highest rates of 7.8 NTU, which exceeded the permissible limits [14], affecting the Euphrates River waters, where site 4 recorded a rate of 4.7 NTU. This may be attributed to the fact that the Tharthar Canal suffers from the effects of sewage and agricultural water that are discharged into it without treatment, in addition to the presence of fish farms that play a role in increasing the turbidity of the water [5], as in the Kaani and Kpean Rivers in Nigeria [20]. Seasonally, the lowest rates were recorded in winter due to the dilution resulting from rain [21] (Figure 3). A negative correlation was recorded between TA and DO (r=0.971, P≤0.05) because the increase of TA in the water may affect the biological activity of aquatic organisms by reducing the production of DO through the process of photosynthesis (Table 4) [10].
Figure 3. Seasonal and spatial variations of EC and Turbidity during the study period (Iraqi standard)
Figure 4. Seasonal and spatial variations of TDS and TSS during the study period (Iraqi standard)
Table 4. Pearson correlation values between physicochemical parameters, heavy metals, and water quality indices showed only significant correlations
|
|
pH |
EC |
Tur |
TH |
Alk |
Ca |
DO |
BOD |
PO4 |
|
AlK |
|
|
|
0.977* |
|
|
|
|
|
|
TSS |
0.962* |
|
|
|
|
|
|
|
|
|
DO |
|
|
|
-0.999** |
-0.971* |
|
|
|
|
|
NO3 |
|
|
|
|
|
|
|
-0.995** |
|
|
PO4 |
|
0.985* |
|
|
|
|
|
|
|
|
SO4 |
|
|
|
0.989* |
|
|
-0.993** |
|
|
|
Cd |
|
|
|
|
|
-0.980* |
-0.979* |
|
|
|
Co |
|
|
|
|
|
-0.985* |
|
|
|
|
HWQI |
|
0.990* |
|
|
|
|
|
|
0.996** |
|
HMPI |
|
|
0.951* |
|
|
|
|
|
|
*. Correlation is significant at the 0.05 level; **. Correlation is significant at the 0.01 level.
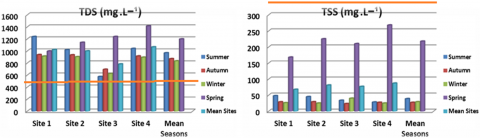
TDS levels exceeded the permissible limits in all sites [14]. The lowest rates were recorded in site 3 (Tharthar Canal), 782 mg.L-1 due to the influence of the Al-Hilwa Canal waters and the dilution of its water, where statistically significant differences were recorded between all sites. Seasonally, spring recorded the highest TDS values, which may be attributed to the effect of rain and the increase in sediments washed into the rivers (Figure 4) [21]. TSS values were low and did not exceed the permissible limits at all sites, and no statistically significant differences were recorded. Seasonally, the highest values were recorded in spring, which may be attributed to an increase in suspended matter due to sediments washed into waterways (Figure 4). A statistically significant positive correlation was observed between TSS and pH (r = 0.962, p ≤ 0.05) (Table 4), which may be attributed to pH-induced precipitation of dissolved constituents, consequently increasing TSS [22].
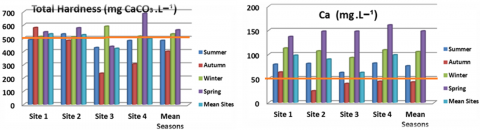
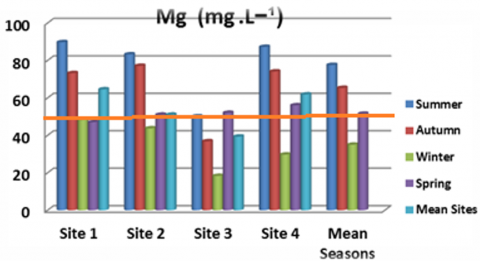
Figure 5. Seasonal and spatial variations of values TH, Ca, and Mg during the study period (Iraqi standard)
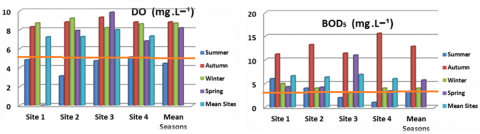
Figure 6. Seasonal and spatial variations of values DO and BOD5 during the study period (Iraqi standard)
TH values were close to the approved minimum value of 500 mg.L-1 in all sites. The lowest mean value was 423 mg.L-1 in Tharthar Canal (Site 3) due to dilution by Al-Halwa Canal [18], which in turn led to a decrease in TH values of 497 mg.L-1 compared to sites 1 and 2 (Euphrates and Habbaniyah), which was confirmed by the statistically significant differences between all sites. Values varied seasonally, with the highest values recorded in spring due to rain and soil leaching, as the Euphrates River basin is known to be calcareous in nature (Figure 5) [17]. Ca and Mg levels exceeded the permissible limits [14] in all sites except for site 3 (Tharthar Canal), where the lowest mean level of 39 mg.L-1 of Mg was recorded. In general, Ca values were higher than Mg values, which is the prevailing characteristic of Iraqi water due to the calcareous nature of the Euphrates Basin water [18]. The low Mg levels in the Tharthar Canal are due to the dilution of its water by the Al-Halwa Canal. Seasonally, Mg values rise in the summer due to drought, while the highest calcium levels are recorded in the spring due to rain, the speed of water flow, and the nature of the Euphrates Basin water (Figures 5 and 6). Record a positive correlation was recorded between TH and TA (r=0.977, p≤0.05) and TH with SO4 (r=0.969, p≤0.05) due to their association with Ca and Mg ions [23], and a negative correlation was recorded between TH and DO (r=-0.999, p≤0.01) because the increase of TH in the water may affect the biological activity of aquatic organisms by reducing the production of DO through the process of photosynthesis (Table 4) [10].
DO and BOD5 values did not show significant variation among all sites, as statistically confirmed by the lack of significant differences between sites. Site 3 (Tharthar Canal) recorded the highest mean of DO 8.0 mg.L-1, while the remaining sites recorded lower DO values. This may be attributed to the water flow velocity, with the canal being supplied with water from Al-Halwa Canal, which leads to increased surface aeration [23]. Despite the high DO levels in all sites, BOD5 values exceeded the permissible limits [14], with the highest mean level recorded at site 3 at 6.90 mg.L-1. This confirms that this increase may be due to organic pollution resulting from the exposure of all sites to multiple sources of organic pollution from sewage, industrial, and agricultural wastewater [3]. Seasonally, autumn recorded the highest DO and BOD5 values, confirming that aeration of the Euphrates River and other sites is unable to reduce BOD5 values due to the high organic load (Figure 6). A positive correlation was recorded between BOD5 and NO3 (r=0.995, p≤0.01) (Table 4), which may be attributed to the action of biological processes. When NO3 is available, it leads to the growth of aquatic organisms, which leads to a greater demand for DO through the respiration process [10].
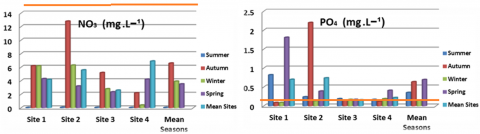
Figure 7. Seasonal and spatial variations of the values NO3 and PO4 during the study period (Iraqi standard)
NO3 rates varied in all sites, with significant differences recorded between them. The highest rate was recorded at site 4 (Euphrates River before mixing), 6.90 mg.L-1, due to the influence of agricultural land waste from the surrounding drainage water [4]. The lowest rate was recorded at site 3 (Tharthar Canal), which may be due to the dilution resulting from Al-Halwa Canal. Seasonally, the highest rate was recorded in the fall, which may be attributed to the rains, high water levels, and the speed of water flow, which leads to the rapid dissolution of DO and its availability to help in the oxidation of nitrogenous compounds to NO3 (Figure 7) [2]. The lowest recorded rate of PO4 was 0.16 mg.L-1 at site 3 (Tharthar Channel) due to dilution by Al-Halwa Canal, while the highest rate was recorded at Habbaniyah Canal (site 2), 0.74 mg.L-1 which suffers from human and industrial pollution [3], where all sites exceeded the permissible limits for PO4 concentrations [14]. Seasonally, the highest rate was recorded in spring and autumn, which may be attributed to pollution sources (Figure 7). A statistically positive relationship was recorded between PO4 and EC (r=0.985, p≤0.05) (Table 4), because PO4 may increase conductivity because it is a charged ion [24].
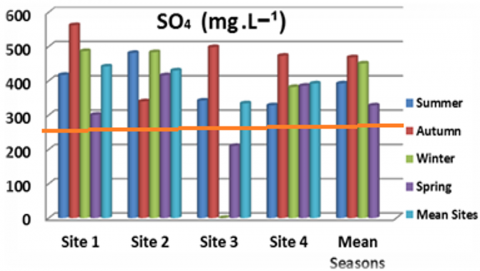
Figure 8. Seasonal and spatial variations of values SO4 during the study period (Iraqi standard )
The Euphrates River Basin waters are characterized by high concentrations of SO4 [19]. This case was also recorded in the Tigris River (Iraq) [14], as their values exceeded the permissible limits in all locations [14]. The lowest rates were recorded in site 3 (Tharthar Channel) at 334 mg.L-1 due to its influence by Al-Halwa Channel, while the other locations recorded slightly higher than site 3. There was no statistically significant difference recorded between all locations (Figure 8). A positive correlation between SO4 and DO (r=0.993, p≤0.01) (Table 4) may be attributed to the biological role of SO4, which in turn affects the production of DO by aquatic plants [23].
3.2 Water quality indices
3.2.1 Horton's Water Quality Index (HWQI)
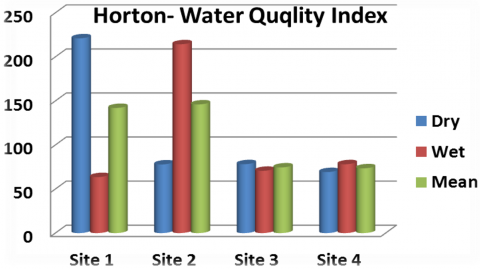
In this study, the Horton Water Quality Index was applied to determine the extent of the influence of the Habbaniyah and Tharthar Lakes channels on the water quality of the Euphrates River in the current study area. Tables 5, 6, 7, and 8 indicate the method of extracting the values of this index in all locations. Table 8 indicates the seasonal water quality and rates of each site.
The results of HWQI showed a similarity in the rates of Site 1 (Euphrates River before mixing) and Site 2 (Habbaniyah Canal), as Site 1 recorded values ranging between 221 – 63.5 (Table 5) and an average of 142 (poor) (Table 9), as this site was considered excellent in comparison with the rest of the sites. As for site 2, it recorded values close to site 1, as its values between 77.99 (Dry) to 214.3 (Wet) (Table 6) and averaged 146 (poor) (Table 9), as this site has a direct impact of pollution from human, agricultural, and industrial activities, which was reflected in the poor quality of its water [3]. Given that the HWQI results depend on values exceeding the standard limits [14], most of the factors were recorded to exceed the standard limits for both sites, namely TDS, Mg, Ca, BOD5, SO4, and PO4 (Tables 5 and 6), which negatively affected the poor quality of these sites and their high HWQI scores.
HWQI values at site 3 showed the lowest values compared to all sites, ranging between 78.2-70.6 (Table 7) with an average of 74.5 (Good) (Table 9). This result was consistent with recording low values for most of the physical and chemical factors at this site, with a smaller number of factors exceeding the permissible limits, namely TDS, Ca, BOD5, and SO4 (Table 7), which was positively reflected in the decrease in the index values and the improvement in the quality of the canal water. This improvement came as a result of the dilution of the Tharthar Canal water with the water of the Al-Halwa Canal [4].
The HWQI values at site 4 (Euphrates River after mixing) were close to those at site 3 (Tharthar Canal), ranging between 69.2 -78.1 (Table 8) with an average of 73.5 (good) (Table 9). When comparing the values of this site with those of site 1 (Euphrates River before mixing), which recorded poor water quality. The water quality of Site 4 (mixing area) is dominated by the good water quality of the Thartharo Canal inlet, which offsets the negative impact of the water quality of the Habbaniya Canal inlet and a portion of the Euphrates River water (Site 1) upstream.
Table 5. How to calculate and extract values of HWQI for site 1 (Euphrates River - before mixing)
|
Parameters |
Values |
Standard |
1/s |
W |
Vn / vn |
W*Q |
|||
|
Dry |
Wet |
Dry |
Wet |
Dry |
Wet |
||||
|
pH |
7.75 |
8.15 |
9 |
0.11 |
0.038 |
9.37 |
14.3 |
1.905 |
0.095 |
|
EC |
1737 |
1880 |
2000 |
0.0005 |
0.0001 |
86.85 |
94 |
0.0165 |
0.016 |
|
Turbidity |
6.45 |
3.95 |
5 |
0.2 |
0.068 |
129 |
79 |
5.761 |
6.1719 |
|
TH |
518 |
546 |
500 |
0.002 |
0.00007 |
103.6 |
109.2 |
0.0761 |
0.0681 |
|
TA |
168 |
636 |
500 |
0.002 |
0.00007 |
33.6 |
127.2 |
0.0237 |
0.0924 |
|
TDS |
1118 |
925 |
500 |
0.002 |
0.0007 |
223.6 |
185 |
0.1481 |
0.1259 |
|
TSS |
108 |
27 |
1000 |
0.001 |
0.0003 |
10.8 |
2.7 |
0.0046 |
0.00009 |
|
Mg |
68 |
60 |
50 |
0.02 |
0.007 |
136 |
120 |
1.0425 |
0.823 |
|
Ca |
108 |
88 |
50 |
0.02 |
0.007 |
216 |
176 |
1.563 |
0.905 |
|
DO |
6 |
8.5 |
5 |
0.2 |
0.007 |
120 |
170 |
7.572 |
12.34 |
|
BOD |
5.15 |
8.1 |
3 |
0.333 |
0.114 |
171.66 |
270 |
15.622 |
32.77 |
|
NO3 |
2.17 |
6.2 |
50 |
0.02 |
0.0068 |
4.34 |
12.4 |
0.0226 |
0.131 |
|
PO4 |
1.32 |
0.09 |
0.5 |
2 |
0.685 |
264 |
18 |
43..89 |
160.49 |
|
SO4 |
359 |
524 |
250 |
0.004 |
0.0013 |
143.6 |
209.6 |
0.245 |
0.2255 |
|
Sum |
|
|
|
2.915944 |
1.000 |
1652.43 |
1587.47 |
214.2695 |
77.90232 |
|
|
|
|
|
K=0.3429 |
|
|
|
HWQI= Ʃ W*Q |
|
Table 6. How to calculate and extract values of HWQI for site 2 (Al-Dhaban Canal - Habbaniyah Lake)
|
Parameters |
Values |
Standard |
1/s |
W |
Vn / vn |
W*Q |
|||
|
Dry |
Wet |
Dry |
Wet |
Dry |
Wet |
||||
|
pH |
8 |
7.05 |
9 |
0.11 |
0.038 |
50 |
2.5 |
1.905 |
0.095 |
|
EC |
1929 |
1870 |
2000 |
0.0005 |
0.0001 |
96.45 |
93.5 |
0.0165 |
0.016 |
|
Turbidity |
4.2 |
4.5 |
5 |
0.2 |
0.068 |
84 |
90 |
5.761 |
6.1719 |
|
TH |
555 |
497 |
500 |
0.002 |
0.00007 |
111 |
99.4 |
0.0761 |
0.0681 |
|
TA |
173 |
674 |
500 |
0.002 |
0.00007 |
34.6 |
134.8 |
0.0237 |
0.0924 |
|
TDS |
1080 |
918 |
500 |
0.002 |
0.0007 |
216 |
183.6 |
0.1481 |
0.1259 |
|
TSS |
135 |
27 |
1000 |
0.001 |
0.0003 |
13.5 |
2.7 |
0.0046 |
0.00009 |
|
Mg |
76 |
60 |
50 |
0.02 |
0.007 |
152 |
120 |
1.0425 |
0.823 |
|
Ca |
114 |
66 |
50 |
0.02 |
0.007 |
228 |
132 |
1.563 |
0.905 |
|
DO |
5.52 |
9 |
5 |
0.2 |
0.007 |
110.4 |
180 |
7.572 |
12.34 |
|
BOD |
4.1 |
8.6 |
3 |
0.333 |
0.114 |
136.6 |
286.66 |
15.622 |
32.77 |
|
NO3 |
1.65 |
9.55 |
50 |
0.02 |
0.0068 |
3.3 |
19.1 |
0.0226 |
0.131 |
|
PO4 |
0.32 |
1.17 |
0.5 |
2 |
0.685 |
64 |
234 |
43..89 |
160.49 |
|
SO4 |
448 |
411 |
250 |
0.004 |
0.0013 |
179.2 |
164.4 |
0.245 |
0.2255 |
|
Sum |
|
|
|
2.915944 |
1.000 |
1479.117 |
1742.667 |
77.90232 |
214.2695 |
|
|
|
|
|
K=0.3429 |
|
|
|
HWQI= Ʃ W*Q |
|
Table 7. How to calculate and extract values of HWQI for site 3 (Tharthar Lake Canal)
|
Parameters |
Values |
Standard |
1/s |
W |
Vn / vn |
W*Q |
|||
|
Dry |
Wet |
Dry |
Wet |
Dry |
Wet |
||||
|
pH |
8 |
7.1 |
9 |
0.11 |
0.038 |
50 |
5 |
1.902 |
0.1905 |
|
EC |
1643 |
1363 |
2000 |
0.0005 |
0.0001 |
82.15 |
68.15 |
0.014 |
0.011 |
|
Turbidity |
10.4 |
5.3 |
5 |
0.2 |
0.068 |
208 |
106 |
14.266 |
7.27 |
|
TH |
433 |
412 |
500 |
0.002 |
0.00007 |
86.6 |
82.4 |
0.0593 |
0.0565 |
|
TA |
166 |
84 |
500 |
0.002 |
0.00007 |
33.2 |
16.8 |
0.0227 |
0.01152 |
|
TDS |
906 |
659 |
500 |
0.002 |
0.0007 |
181.2 |
131.8 |
0.124 |
0.0904 |
|
TSS |
117 |
32 |
1000 |
0.001 |
0.0003 |
11.7 |
3.2 |
0.00401 |
0.001 |
|
Mg |
51.05 |
28 |
50 |
0.02 |
0.007 |
102.1 |
56 |
0.7002 |
0.384 |
|
Ca |
105 |
66 |
50 |
0.02 |
0.007 |
210 |
132 |
1.44.3 |
0.905 |
|
DO |
7.3 |
8.8 |
5 |
0.2 |
0.007 |
146 |
176 |
10.01 |
12.07 |
|
BOD |
6.5 |
7.2 |
3 |
0.333 |
0.114 |
216.66 |
240 |
24.768 |
27.43 |
|
NO3 |
1.21 |
4 |
50 |
0.02 |
0.0068 |
2.42 |
8 |
0.0165 |
0.0548 |
|
PO4 |
0.18 |
0.16 |
0.5 |
2 |
0.685 |
36 |
32 |
24.69 |
21.94 |
|
SO4 |
276 |
392 |
250 |
0.004 |
0.0013 |
110.4 |
156.8 |
0.1514 |
0.215 |
|
Sum |
|
|
|
2.915944 |
1.000 |
1476.437 |
1214.15 |
78.17863 |
70.64676 |
|
|
|
|
|
K=0.3429 |
|
|
|
HWQI= Ʃ W*Q |
|
Table 8. How to calculate and extract values of HWQI for site 4 (Euphrates River - after mixing)
|
Parameters |
Values |
Standard |
1/s |
W |
Vn / vn |
W*Q |
|||
|
Dry |
Wet |
Dry |
Wet |
Dry |
Wet |
||||
|
pH |
7.85 |
7.25 |
9 |
0.11 |
0.038 |
42.5 |
12.5 |
1.619 |
0.476 |
|
EC |
1378 |
1490 |
2000 |
0.0005 |
0.0001 |
68.9 |
74.5 |
0.0118 |
0.01277 |
|
Turbidity |
5.8 |
3.45 |
5 |
0.2 |
0.068 |
116 |
69 |
7.956 |
4.732 |
|
TH |
584 |
450 |
500 |
0.002 |
0.00007 |
116.8 |
90 |
0.0801 |
0.0617 |
|
TA |
161 |
592 |
500 |
0.002 |
0.00007 |
32.2 |
118.4 |
0.022 |
0.0812 |
|
TDS |
1228 |
905 |
500 |
0.002 |
0.0007 |
145.6 |
181 |
0.168 |
0.124 |
|
TSS |
27.5 |
26.1 |
1000 |
0.001 |
0.0003 |
2.75 |
2.61 |
0.00009 |
0.00008 |
|
Mg |
71.6 |
51.9 |
50 |
0.02 |
0.007 |
143.6 |
103.8 |
0.982 |
0.7119 |
|
Ca |
121 |
77 |
50 |
0.02 |
0.007 |
242 |
154 |
1.6598 |
1.056 |
|
DO |
5.95 |
8.7 |
5 |
0.2 |
0.007 |
119 |
174 |
8.162 |
11.934 |
|
BOD |
2.2 |
10 |
3 |
0.333 |
0.114 |
73.333 |
333.33 |
8.383 |
38.104 |
|
NO3 |
2.13 |
1.3 |
50 |
0.02 |
0.0068 |
4.26 |
2.6 |
0.0292 |
0.0178 |
|
PO4 |
0.29 |
0.15 |
0.5 |
2 |
0.685 |
58 |
30 |
39.781 |
20.57 |
|
SO4 |
306 |
427 |
250 |
0.004 |
0.0013 |
122.4 |
170.8 |
0.1679 |
0.234 |
|
Sum |
|
|
|
2.915944 |
1.000 |
1386.943 |
1516.543 |
69.02459 |
78.12558 |
|
|
|
|
|
K=0.3429 |
|
|
|
HWQI= Ʃ W*Q |
|
Table 9. Horton Water Quality Index values and rates for modeling sites, and determine their water quality
|
Sites |
Dry |
Categories |
Wet |
Categories |
Mean |
Categories |
|
1 (Euphrates River – Before mixing) |
221.04 |
Very poor |
63.546 |
Good |
142 |
Poor |
|
2 (Habbaniyah Canal) |
77.902 |
Good |
214.270 |
Very poor |
146 |
Poor |
|
3 (Therthar canal) |
78.177 |
Good |
70.647 |
Good |
74.5 |
Good |
|
4 (Euphrates River – After mixing) |
69.246 |
Good |
78.126 |
Good |
73.5 |
Good |
Seasonally, the sites varied in HWQI values and did not follow a consistent pattern between the dry and wet seasons, which confirms that there is an external factor that plays a role in causing this variation, which is the pollution factor that occurs in water sources (Figure 9) [6]. A statistically positive relationship was recorded between EC, PO4, and HWQI (Table 4), because the increase in PO4 and EC reduces the efficiency of water quality [22]. A statistically significant relationship was recorded between the HWQI and both EC and PO4 (r=0.990, p≤0.05) (Table 4) as their concentrations were consistent with the HWQI values in all sites [23].
Figure 9. Horton's Water Quality Index values at the sampling sites
3.2.2 Heavy metal pollution index (HMPI)
In the current study, the four heavy metals Pb, Ni, Cd, and Co were studied in the waters of the Euphrates River and the canals of the two lakes affected by them. Table 10 indicates the recorded values of these elements in all sites, with their values varying between locations by recording significant differences between all sites for each element. The table shows that all the studied heavy elements did not exceed the Iraqi standard limits [14].
Lead (Pb) is a very toxic metal if it exceeds the natural limits in aquatic systems, as it accumulates in the bodies of aquatic organisms and thus affects the primary production process of the food chain, such as algae, in addition to its harmful effects on human health. The highest rate, 0.55 µg.L-1 was recorded in site 1, and the lowest rate, 0.11 µg.L-1 in sites 2 and 3. The reason for the increase is due to waste from military operations near the site and from industrial sites for car repair, and from burning car fuel containing ethyl lead, which led to its increase. As for the decrease, it is due to the process of its consumption by aquatic organisms, especially algae, which carry out a process of bioremediation in the water to a large extent [24, 25] (Table 10).
Nickel (Ni) is found in two forms: first, naturally, as igneous and sedimentary rocks, and second, as a result of industrial waste that is discharged directly into the river. The highest rate, 0.26 µg.L-1 was recorded in site 2 (Habbaniya Canal), which suffers from pollution due to human activities, especially the sight of car and heavy equipment repair shop and their waste, in addition to the abundance of agricultural fertilizers containing nickel. The lowest rate, 0.012 µg.L-1 was in site 4, which may be attributed to the dilution of water caused by site 3 (Tharthar Canal) (Table 10) [26].
Cadmium (Cd) contamination of water poses a greater health risk because it accumulates in the tissues of all living organisms and enters the water through paint factory waste and car exhaust [27]. The lowest Cd level was recorded at 0.137 µg.L-1 in site 4, and the highest level was 0.27 µg.L-1 in site 2 (Al-Habbaniyah Canal) due to the presence of many car repair factories and its proximity to agricultural areas (Table 10). A positive correlation was recorded between Cd with Ca (r-=0.980, p=≤0.05) and with DO (r=-0.979, p≤0.05) (Table 4) due to the chemical similarity between them, as well as the relationship between their joint absorption by aquatic organisms and their joint accumulation within their tissues, Also, increasing the concentration of DO can increase the activity of aquatic organisms, which in turn leads to the availability of Cd [28]. Cobalt (Co), this element is characterized by its very strong hardness and is found in many ores, but you cannot obtain it on the surface of the Earth because the high levels of chlorine and oxygen in the atmosphere prevent its formation. The highest rate of 0.48 µg.L-1 was recorded in site 3, and the lowest rate of 0.23 µg.L-1 in site 1 (Table 10). A positive correlation between Ca and Co (r=-0.985, p≤0.05) (Table 4) may be attributed to the vital role of Ca in the aquatic environment that affects the availability of Co [23].
Table 10. Range (above) and average (below) of values of HMPI and LSD recorded at sampling sites
|
Heavy Metal |
Site 1 |
Site 2 |
Site 3 |
Site 4 |
LSD |
|
Pb (µg.L -1) |
0.55 a |
0.06-0.22 0.11 b |
0.11 b |
0.01-0.56 0.29 ab |
0.398 * |
|
Ni (µg.L-1 ) |
0.21 a |
0.10-0.52 0.26 a |
0.05-0.70 0.21 ab |
0.0-0.03 0.012 b |
0.167 * |
|
Cd (µg.L-1 ) |
0.032 |
0.27 |
b |
0.01-0.31 0.137 ab |
0.148 * |
|
Co (µg.L-1 ) |
0.05-0.24 0.23 b |
0.31-0.61 0.40 ab |
0.25-0.81 0.48 a |
0.0-0.094 0.24 b |
0.229 * |
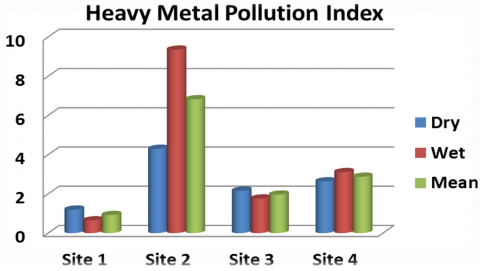
Tables 11, 12, 13, and 14 show the values of the HMPI index and the method of extracting them mathematically. Given that the concentrations of the four heavy elements measured in the current study did not exceed the permissible standard limits, low values were recorded for the HMPI [29].
Table 11. Evidence of HMPI values in the waters of Site 1 (Euphrates River - before the mixing process)
|
Heavy Metal |
Mean Con. (VI) |
Iraqi Standard (Si ) |
Wi |
Sub Index (Qi ) |
Qi × Wi |
Mean HMPI (Ʃ Qi × Wi) |
||||
|
Dry |
Wet |
Dry |
Wet |
Dry |
Wet |
Dry |
Wet |
|||
|
Pb(µg/L) |
0.045 |
0.065 |
10 |
0.216 |
0.45 |
0.65 |
0.097 |
0.140 |
1.194 |
0.648 |
|
Ni(µg/L) |
0.085 |
0.13 |
100 |
0.022 |
0.09 |
0.13 |
0.002 |
0.003 |
||
|
Cd (µg/L) |
0.045 |
0.02 |
3 |
0.720 |
1.50 |
0.66 |
1.079 |
0.479 |
|
|
|
Co (µg/L) |
0.186 |
0.29 |
50 |
0.043 |
0.37 |
0.58 |
0.016 |
0.025 |
||
|
Sum |
|
|
|
1.00 |
|
|
|
|
Mean= 0.921 |
|
Table 12. Evidence of HMPI in the waters of Site 2 (Al-Dhaban Canal-Habbaniyah Lake)
|
Heavy Metal |
Mean Con. (VI) |
Iraqi Standard (Si) |
Wi |
Sub Index (Qi) |
Qi × Wi |
Mean HMPI (Ʃ Qi × Wi) |
||||
|
Dry |
Wet |
Dry |
Wet |
Dry |
Wet |
Dry |
Wet |
|||
|
Pb(µg/L) |
0.14 |
0.09 |
10 |
0.216 |
1.40 |
0.90 |
0.302 |
0.194 |
4.295 |
9.351 |
|
Ni(µg/L) |
0.51 |
0.21 |
100 |
0.022 |
0.51 |
0.21 |
0.011 |
0.005 |
||
|
Cd (µg/L) |
0.165 |
0.38 |
3 |
0.720 |
5.50 |
12.66 |
3.956 |
9.112 |
||
|
Co (µg/L) |
0.285 |
0.460 |
50 |
0.043 |
0.57 |
0.92 |
0.025 |
0.040 |
||
|
Sum |
|
|
|
1.00 |
|
|
|
|
Mean= 6.823 |
|
Table 13. Evidence of HMPI in the waters of Site 3 (Tharthar Lake Canal)
|
Heavy Metal |
Mean Con. (VI) |
Iraqi Standard (Si) |
Wi |
Sub Index (Qi) |
Qi × Wi |
Mean HMPI (Ʃ Qi × Wi) |
||||
|
Dry |
Wet |
Dry |
Wet |
Dry |
Wet |
Dry |
Wet |
|||
|
Pb(µg/L) |
0.09 |
0.13 |
10 |
0.216 |
0.90 |
1.30 |
0.194 |
0.281 |
2.159 |
1.762 |
|
Ni(µg/L) |
0.05 |
0.41 |
100 |
0.022 |
0.05 |
0.41 |
0.001 |
0.009 |
||
|
Cd (µg/L) |
0.08 |
0.06 |
3 |
0.720 |
2.67 |
2.00 |
1.918 |
1.439 |
||
|
Co (µg/L) |
0.53 |
0.39 |
50 |
0.043 |
1.06 |
0.78 |
0.046 |
0.034 |
||
|
Sum |
|
|
|
1.00 |
|
|
|
|
Mean = 1.961 |
|
Table 14. Evidence of HMPI values in the waters of Site 4 (Euphrates River-Mixing Site)
|
Heavy Metal |
Mean Con. (VI) |
Iraqi Standard (Si) |
Wi |
Sub Index (Qi) |
Qi × Wi |
Mean HMPI (Ʃ Qi × Wi) |
||||
|
Dry |
Wet |
Dry |
Wet |
Dry |
Wet |
Dry |
Wet |
|||
|
Pb (µg/L) |
0.11 |
0.475 |
10 |
0.216 |
1.100 |
4.750 |
0.237 |
1.025 |
2.637 |
3.106 |
|
Ni (µg/L) |
0.015 |
0.01 |
100 |
0.022 |
0.015 |
0.010 |
0.0003 |
0.0002 |
||
|
Cd (µg/L) |
0.10 |
0.085 |
3 |
0.720 |
3.330 |
2.833 |
2.398 |
2.038 |
||
|
Co (µg/L) |
0.01 |
0.492 |
50 |
0.043 |
0.020 |
0.984 |
0.0008 |
0.0425 |
||
|
Sum |
|
|
|
1.00 |
|
|
|
|
Mean= 2.872 |
|
The highest rate of HMPI was recorded at site 2 (Habbaniyah Canal), about 6.823 µg.L-1 (Figure 10) due to industrial and agricultural pollution and war waste that falls along the path of this canal [5, 13]. Seasonal variations in HMPI values did not show a clear pattern across all sites, which may be attributed to the low concentrations recorded that prevented any variation from appearing. Based on the current results, the studied sites of the Euphrates River and the Tharthar and Habbaniyah lakes canals are considered safe sites with regard to their exposure to heavy metals. It was statistically recorded that there is a positive relationship between the HWPI with turbidity (r=0.951, p≤0.05) (Table 4). This may be due to the heavy elements being attached to the suspended particles in the water, which increases their concentration with an increase in the turbidity of the water [27].
Figure 10. HMPI values at the sampling sites
The HWQI and the HMPI demonstrated their effectiveness in such environmental studies, as their results were consistent with the results of physical and chemical tests and heavy metal concentrations. The Tharthar Canal plays an important role in improving and mitigating the water quality of the Euphrates River in the current study area, as recorded concentrations of most parameters were lower than those of river water, including TA, EC, TDS, Mg, NO3, PO4, and SO4. Although the water of Lake Tharthar is characterized by high salt concentrations and high hardness due to its geological nature and the fact that it is a closed body of water, the Al-Halwa Canal plays a significant role in improving the water quality of the Tharthar Canal. The water of the Euphrates River and the waters of the Tharthar and Habbaniyah canals have safe concentrations of heavy metals measured in the current study. We recommend the necessity of activating the Environmental Protection Law and periodic monitoring to detect and address pollution sources at the current study sites.
All thanks and appreciation to the Advanced Research Laboratory of the Education College for Women and the laboratories of the Center of Desert Studies - University of Anbar for providing all the facilities and capabilities to carry out all the research requirements.
[1] Al-Tamimi, A.N.A., Al-Obeidi, N.A. (2025). Biodiversity of phytoplankton (non-diatoms) as bio-indicators in assessing the water quality and trophic status of the Euphrates River between Al-Baghdadi and Al-Ramadi Cities, Western Iraq. Agronomy Research 23(S2): 723-737. https://doi.org/10.15159/AR.25.022
[2] Al-Dulaimi, H.M., Yassin, H.A., Al-Tamimi, A.A.M. (2024). The effect of biological and physicochemical factors on the water quality of the Al-Warar System in the City of Ramadi, Western Iraq. IOP Conference Series: Earth and Environmental Science, 1371: 022018. https://doi.org/10.1088/1755-1315/1371/2/022018
[3] Al-Anzy, D.A.H.S., Al-Tamimi, A.N.A.M., Sharqi, M.M. (2023). Biological and ecological monitoring using epiphytic diatoms on two aquatic plants to estimate the water quality of Habbaniyah Lake, Western Iraq. IOP Conference Series: Earth and Environmental Science, 1262(2): 022012. https://doi.org/10.1088/1755-1315/1262/2/022012
[4] Al-Tamimi, A.N.A.M., Al-Lehebi, R.D.S. (2025). Applications and tests of water quality indices to evaluate the impact of Tharthar and Habbaniyah lakes on the water quality of the Euphrates River, Al-Anbar Province, Iraq. IOP Conference Series: Earth and Environmental Science, 1487(1): 012001. https://doi.org/10.1088/1755-1315/1487/1/012001
[5] Appiah-Opong, R., Ofori, A., Ofosuhene, M., Ofori-Attah, E., et al. (2021). Heavy metals concentration and pollution index (HPI) in drinking water along the southwest coast of Ghana. Applied Water Science, 11(3): 57. https://doi.org/10.1007/s13201-021-01386-5
[6] Khlaif, B.M., AL-Hassany, J.S. (2024). Water quality assessment using a novel Iraqi water quality index for Euphrates River between Karbala and Babylon provinces as a case study. Baghdad Science Journal, 22(4). https://doi.org/10.21123/bsj.2024.10179
[7] Szarłowicz, K., Baran, A., Wójs, K., Wójcik, S. (2024). Estimation of the level of anthropogenic impact based on the determination of radionuclides and heavy metals in sediments taken from Rybnik reservoir, Poland. Environmental Science and Pollution Research, 31(25): 37356-37365. https://doi.org/10.1007/s11356-024-33709-9
[8] Singh, P.K., Kumar, U., Kumar, I., Dwivedi, A., Singh, P., Mishra, S., Seth, C.S., Sharma, R.K. (2024) Critical review on toxic contaminants in surface water ecosystem: Sources, monitoring, and its impact on human health. Environmental Science and Pollution Research, 31: 56428-56462. https://doi.org/10.1007/s11356-024-34932-0
[9] El-Sharkawy, M., Alotaibi, M.O., Li, J., Du, D., Mahmoud, E. (2025). Heavy metal pollution in coastal environments: Ecological implications and management strategies: A review. Sustainability, 17(2): 701. https://doi.org/10.3390/su17020701
[10] American Public Health Association (APHA). (2017). Standard Methods for the Examination of Water and Wastewater. American Public Health Association, American Water Works Association and Water Environment Federation. https://law.resource.org/pub/us/cfr/ibr/002/apha.method.2320.1992.html.
[11] Eisenreich, S.J., Bannerman, R.T., Armstrong, D.E. (1975). A simplified phosphorus analysis technique. Environmental Letters, 9(1): 43-53. https://doi.org/10.1080/00139307509437455
[12] Horton, R.K. (1965). An index number system for rating water quality. Journal of the Water Pollution Control Federation, 37: 300-306.
[13] Abou Zakhem, B., Hafez, R. (2015). Heavy metal pollution index for groundwater quality assessment in Damascus Oasis, Syria. Environmental Earth Sciences, 73(10): 6591-6600. https://doi.org/10.1007/s12665-014-3882-5
[14] Altemimi, Z., Al-Juhaishi, M. (2024). Water quality evaluation of Tigris River by using Canadian and Horton water quality index. Construction, 4(1): 37-44. https://doi.org/10.15282/construction.v4i1.9748
[15] Balakrishnan, A., Ramu, A. (2016). Evaluation of heavy metal pollution index (HPI) of ground water in and around the coastal area of Gulf of Mannar biosphere and Palk Strait. Journal of Advanced Chemical Sciences, 2(3): 331-333.
[16] SAS Institute Inc. (2004). SAS/STAT ® 9.1 User’s Guide. Cary, NC: SAS Institute Inc. https://support.sas.com/documentation/onlinedoc/91pdf/sasdoc_91/stat_ug_7313.pdf.
[17] Sharqi, M. M., Al-Tamimi, A.N.A., Hassan, O.M. (2024). Evaluation of Euphrates River water quality on phytoplankton biodiversity in Ramadi, Iraq. Borneo Journal of Resource Science and Technology, 14(2): 19-30. https:doi.org/10.33736/bjrst.6858.2024
[18] Majeed, O.S., Al-Azawi, A.J., Nashaat, M.R. (2022). The effect of Tharthar-Tigris canal on the environmental properties of the Tigris River Northern Baghdad, Iraq. Baghdad Science Journal, 19(6): 16. https://doi.org/10.21123/bsj.2022.6483
[19] Al Tamaki, A.N.A., Al Obeidi, N.A. (2023). Use of epiphytic diatoms in Cyperus papyrus L. as bioindicators in the assessment of the health of the upper Euphrates River between the Haditha Dam and Al-Baghdadi, Iraq. IOP Conference Series: Earth and Environmental Science, 1222(1): 012020. https://doi.org/10.1088/1755-1315/1222/1/012020
[20] Kalagbor, I.A., Johnny, V.I., Ogbolokot, I.E. (2019). Application of national sanitation foundation and weighted arithmetic water quality indices for the assessment of Kaani and Kpean Rivers in Nigeria. American Journal of Water Resources, 7(1): 11-15. https://doi.org/10.12691/ajwr-7-1-2
[21] Al-Obeidi, N.A., Al-Tamimi, A.N.A.M. (2023). Ecology and biodiversity of epiphytic algae (Non-diatoms) on Typha Domingensis Pers. In the upper Euphrates River between Haditha Dam and Al Baghdadi in Western Iraq. In Advanced Studies on Environmental Sustainability, pp. 41-58.
[22] Khamidun, M.H. (2022). Assessment of surface water quality using Malaysia Water Quality Index (MWQI) and National Sanitation Foundation Water Quality Index (NSFWQI) during road construction activities. Recent Trends in Civil Engineering and Built Environment, 3(1): 380-388.
[23] World Health Organization (WHO). (2008). Guidelines for Drinking Water Quality: Third Edition, Recommendations Incorporating the First and Second Addenda. World Health Organization, Geneva. https://www.who.int/publications/i/item/9789241547611.
[24] Hasham, G.J., Ramal, M.M. (2022). Water quality assessment of Euphrates River within Fallujah City using water quality indices technique. International Journal of Design & Nature and Ecodynamics, 17(4): 563-570. https://doi.org/10.18280/ijdne.170410
[25] FAO. (1994). Forest Resources Assessment 1990-non-tropical developing countries Mediterranean region. https://agris.fao.org/search/en/providers/122621/records/6471f7b677fd37171a720bee.
[26] Win, D.T., Than, M.M., Tun, S. (2003). Lead removal from industrial waters by water hyacinth. AU Journal of Technology, 6(4): 187-192.
[27] Al-Tamimi, A.N.A., Al-Jumaily, I.S. (2021). Planktonic diatoms as bio indicators of water quality of Euphrates River between Saqlawiah and Amiriat Al-Fallujah–Iraq. Annals of the Romanian Society for Cell Biology, 25(3): 6799-6813.
[28] Altahaan, Z.F., Dobslaw, D. (2024). Assessment of post-war groundwater quality in urban areas of Mosul city/Iraq and surrounding areas for drinking and irrigation purposes by using the Canadian Environment Water Quality Index CCME-WQI and heavy metal pollution index HPI. World Journal of Advanced Research and Reviews, 21: 2461-2481. https://doi.org/10.30574/wjarr.2024.21.3.1010
[29] Nastiti, K.D.M., Sayekti, R.W., Yuliani, E. (2023). Water quality and distribution of Selorejo Reservoir using the Pollution Index, Oregon-WQI, and NSF-WQI methods. Journal Teknik Pengairan: Journal of Water Resources Engineering, 14(1): 64-75. https://doi.org/10.21776/ub.pengairan.2023.014.01.6