Amit Kumar![]() | Sougata Chattopadhyay*
| Sougata Chattopadhyay*![]()
© 2025 The authors. This article is published by IIETA and is licensed under the CC BY 4.0 license (http://creativecommons.org/licenses/by/4.0/).
OPEN ACCESS
This study evaluates the performance of a Constructed Wetland (CW) system designed for wastewater treatment in the Yamuna Expressway Industrial Development Authority (YEIDA) area, a rapidly urbanizing industrial and residential hub in India's National Capital Region (NCR). Utilizing Phragmites and Typha as primary phytoremediation species, the system leveraged their biological uptake mechanisms and physical filtration capacity to achieve notable water quality improvements, including significant reductions in key parameters: TSS (98.78%), COD (93.33%), BOD₅ (97.83%), Ammonia-N (82.52%), Total Nitrogen (91.69%), Total Coliforms (98.64%), and turbidity (23.08%), while maintaining stable pH within acceptable reuse ranges. The treated water was reused for landscaping, irrigation, and industrial cooling, promoting resource recovery and sustainable water management. This research demonstrates the synergistic performance of Phragmites and Typha in a semi-arid Indian context—a novel contribution, as this combination has not been widely studied under such climatic conditions. The findings underscore CW systems as cost-effective, low-maintenance, and eco-friendly alternatives to conventional wastewater treatment, offering a replicable model for nature-based solutions in developing regions.
biochemical oxygen demand, chemical oxygen demand, Constructed Wetland (CW), Phragmites, Typha
India encounters a considerable challenge in sewage management, largely as a result of rapid urbanization, population increase, and insufficient infrastructure. The amount of sewage produced in urban areas is significant. For example, it is estimated that domestic sewage from major cities in northern India generates about 1,528 million cubic meters of waste each day along the banks of the Ganga River [1]. Approximately 25% of urban wastewater undergoes treatment, resulting in roughly 3,000 million liters of untreated sewage being discharged into the Ganga daily [2]. The situation is worsened by the insufficient sewage treatment works (STWs) and regulatory frameworks that have not adapted to urban growth [3].
Untreated sewage has major negative effects on water quality that leading to pathogen and heavy metal pollution [4]. The Central Pollution Control Board (CPCB) has underlined the urgent necessity of improved sewage management systems, as only a fraction of the wastewater generated in Indian cities is sufficiently cleaned before it is discharged into water bodies [4]. The inadequate infrastructure poses public health hazards as untreated sewage causes the dissemination of waterborne illnesses like cholera, particularly in rural regions with limited access to fresh water [5, 6].
Additionally, the effects of climate change, especially intense rainfall, make sewage management more challenging. Increased rainfall can exceed the capacity of current sanitation systems, resulting in flooding and the contamination of water sources with sewage [7]. This impacts water quality and raises the risk of diarrheal diseases, especially in vulnerable groups like children. The situation is worsened by cultural practices, including mass bathing in rivers, which add to pollution [8]. In conclusion, India's sewage situation is marked by a large amount of untreated sewage, insufficient treatment facilities, and considerable public health hazards. The relationship between urbanization, climate change, and cultural practices requires a thorough approach to sewage management that considers both infrastructure shortcomings and public health issues.
This study is grounded in ecological engineering principles that integrate natural systems into engineered infrastructure to manage environmental challenges sustainably. Constructed Wetlands (CWs) represent a practical application of these principles, combining nutrient cycling, microbial ecology, and rhizosphere dynamics. While the benefits of CWs are well documented, most existing studies focus on singular plant species or temperate climatic conditions. This study advances prior work by investigating the combined use of Phragmites and Typha in a single system and evaluating their synergistic effect under semi-arid conditions typical of India's National Capital Region (NCR). This provides a novel contribution to the literature by testing and contextualizing the co-plantation strategy within the design and operation of CWs.
CWs present a sustainable and cost-effective solution for rural wastewater management, particularly in regions where conventional treatment methods are impractical due to high costs and technical complexities. CWs are engineered systems that mimic natural wetlands, utilizing biological, chemical, and physical processes to treat various types of wastewater, including domestic, agricultural, and industrial effluents [9, 10]. Particularly fit for rural and scattered environments, their design enables the efficient elimination of contaminants, including nutrients (nitrogen and phosphorus), diseases, and organic materials [11]. CWs' operating efficiency is ascribed to their capacity to use natural processes, including wetland vegetation, soils, and microbial populations. Studies have revealed that for organic materials and nutrients, CWs may remove pollutants with rates ranging from 60% to 95%; for pathogens, they can reach up to 99% [11]. This high efficiency is particularly beneficial in rural areas where access to advanced wastewater treatment technologies is limited. For instance, in a case study of India, CWs demonstrated significant improvements in water quality and resource use efficiency, highlighting their potential for enhancing local water management practices [12]. Moreover, CWs are characterized by low capital and operational costs, making them an economically viable option for rural communities. They require minimal maintenance and can be constructed using locally available materials, which further reduces costs [11]. The simplicity of their design allows for easy integration into existing landscapes, promoting community involvement in wastewater management and fostering a sense of ownership among local populations [9, 13]. In addition to their economic advantages, CWs also contribute to environmental sustainability. They provide habitat for wildlife, enhance biodiversity, and can improve local aesthetics by integrating green spaces into rural areas [14, 15]. Furthermore, CWs can help mitigate the impacts of climate change by reducing the risk of flooding and improving water retention in landscapes [16]. In conclusion, CWs offer a multifaceted solution for rural wastewater management, combining cost-effectiveness, operational efficiency, and environmental benefits. This study specifically demonstrates their scalability and integration potential in semi-arid, rapidly urbanizing environments by utilizing a dual-species plantation strategy not commonly explored in previous literature. This case study underscores the scalability of CW-based wastewater management systems in water-scarce semi-arid regions and their potential to transform rural wastewater treatment and agricultural productivity.
Their ability to treat wastewater sustainably makes them an attractive alternative to conventional treatment systems, particularly in resource-limited settings.
This case study underscores the scalability of CW-based wastewater management systems in water-scarce semi-arid regions and their potential to transform rural wastewater treatment and agricultural productivity.
1.1 Materials and methods
1.1.1 Site selection
The research location was selected from the Yamuna Expressway Industrial Development Authority (YEIDA) area in India's National Capital Region, a rapidly urbanizing and industrialising corridor experiencing acute water stress and rising domestic and industrial wastewater output. Effective wastewater management in this region is critical to mitigate pollution and support sustainable growth.
CWs were identified as a feasible solution due to their low-cost, decentralized nature. The CW initiative was launched collaboratively with YEIDA, involving multi-stakeholder consultations, including local authorities, planners, and community members.
A systematic evaluation of the topography, drainage network, and wastewater load informed the site selection. The final location was selected at the end point of a primary drainage line, strategically positioned to intercept the largest volume of untreated effluent before it entered downstream water bodies.
The site exhibited chronic issues such as strong odors and health risks from vector-borne diseases, making it both environmentally sensitive and socially impactful for remediation.
The initial plan involved installing the CW adjacent to the sump that collected wastewater from residential and industrial sources through a combination of PVC pipelines and cemented drain canals. These were engineered to reduce infiltration and evaporation losses.
However, local stakeholders recommended shifting the CW slightly downstream to avoid nuisance impacts to nearby residents. Though this required additional pipeline length and cost, it enhanced community acceptance and reduced social resistance, critical for long-term sustainability.
1.1.2 Design and implementation
To ensure proper pre-treatment, bar screens were installed at the main pipeline inlet to remove coarse solids and plastic debris, preventing downstream clogging and promoting uninterrupted hydraulic flow.
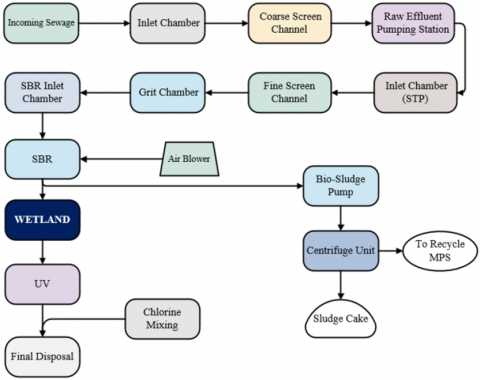
The CW system consisted of horizontal subsurface flow (HSSF) units, divided into five chambers (Figure 1). These chambers were planted with two phytoremediation macrophyte species, Phragmites and Typha, selected based on local climate resilience, nutrient uptake efficiency, and low maintenance needs.
Figure 1. Process flow diagram
The system was designed to treat wastewater generated from approximately 11,000 households and several industrial clusters, with an average influent flow rate of 3,000 m³/day.
Environmental variables such as seasonal rainfall and temperature were monitored throughout the implementation to assess their influence on flow variability and pollutant load. Overflow drains and protective berms were added to prevent stormwater intrusion and control flow regimes during the monsoon season.
The overall CW layout was optimized for minimal energy dependence and operational simplicity. Wastewater movement was gravity-driven, leveraging a 1% bed slope. The modular design allows for scalability and replicability in similar peri-urban industrial regions across India.
The design phase transitioned smoothly into construction and monitoring, which are elaborated in subsequent sections, including details on filter media configuration, vegetation layout, and sampling protocols. Design and Implementation of CW
The CW system in the YEIDA was designed to treat a flow of 5MLD, equivalent to the daily water supply from an overhead tank to community taps. Significant household activities such as bathing and washing contributed to the wastewater volume. Wastewater from individual households is drained through PVC pipes into the main underground pipeline, minimising percolation and evaporation losses.
The wetland consists of five sections, each measuring 17.5 meters in length and 6.85 meters in width. The area of one section is approximately 119.88 square meters. Since there are five sections, the total area of the wetland is about 599.38 square meters. This total area is designed to provide adequate capacity for wastewater treatment.
1.1.3 Filter media and layout
Three 30 cm thick horizontally stacked layers of aggregates made up the CW filter bed.
Two varieties of wetland vegetation, Typha and Phragmites, have been chosen for use in the CW system for this project. These plants help to reduce pollutants through their root systems and stimulate microbial activity by enhancing rhizospheric interactions, making them suitable for wastewater treatment.
By providing a large surface area for microbial colonization, Phragmites australis (reed grass) plays a crucial role in nutrient removal, especially for nitrogen and phosphorus through synergistic plant-microbe interactions. Furthermore, its robust root network stabilizes the substrate and improves physical filtration capacity.
Typha latifolia (cattails) also contribute significantly to water quality improvement by capturing suspended solids, enhancing nutrient uptake, and resisting seasonal stressors such as varying flow rates and temperature changes. These plants are known for their adaptability to wetland environments and their ability to thrive in varying conditions, particularly within semi-arid climates like that of NCR.
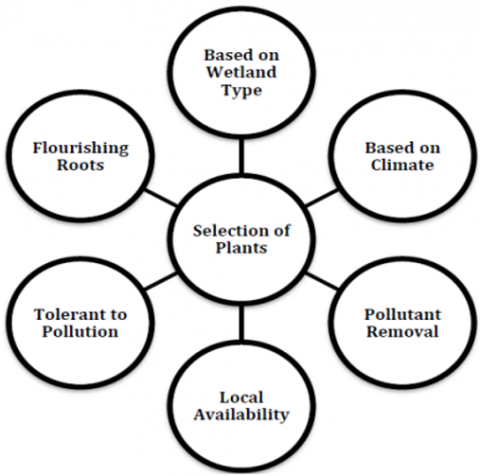
The combination of these two species is relatively underexplored in Indian CW systems, and their synergistic performance under semi-arid conditions forms a novel contribution of this study. Both species are indigenous and abundantly available in the NCR region and were selected based on their ecological suitability, resilience, and sustainable performance in the biological treatment of wastewater. The following factors (Figure 2) have been considered for the selection of plants.
Figure 2. Factors to be considered for the selection of plants for CWs
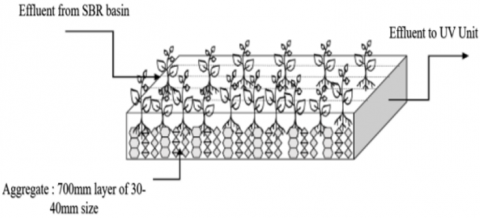
Designed for secondary treatment of wastewater from SBR (Sequencing Batch Reactor) basins, the schematic image shows a subsurface horizontal-flow constructed wetland. The system involves a 700 mm multilayer aggregate bed (30–40 mm) that acts as both filtration media and microbial substrate (Figure 3). Plants are spaced at 40 cm intervals to facilitate efficient root-zone interaction and pollutant breakdown. Microorganisms attached to the roots and aggregate surfaces enhance decomposition of organic matter and nutrient removal.
Figure 3. Basic design configuration of CWs
The effluent exits the wetland and is directed to a UV disinfection unit, ensuring it meets reuse water quality standards. This design leverages natural biological, physical, and chemical processes for purification, supporting both cost-effectiveness and environmental sustainability.
To prevent sand loss during high flow events, brick baffles were installed on both the inlet and outlet sides of the CW. The system operated on gravity flow, supported by a consistent 1% bed slope. Wastewater followed a bottom-up flow path, entering through the bottom coarse aggregate (40 mm) and exiting through the finer gravel layer (10 mm) at the top.
To prevent sand loss during high flow events, a brick baffle was placed on both the inlet and outlet sides of the CW. The system operated on gravity flow, maintained by a 1% bed slope. Following a bottom-up flow pattern, wastewater came from the bottom of the CW via the 40 mm aggregate layer and left from the top of the 10 mm gravel layer.
1.1.4 Vegetation and planting
The CW was planted in December 2023 with Phragmites and Typha saplings at 30 cm spacing. These plant species were selected based on their high growth rates, non-invasive characteristics, sustained phytoremediation potential, and resistance to local pests and pathogens.
Each species covered 40 m² of the wetland: Phragmites occupied the first 10 meters (from the inlet), and Typha was planted in the downstream 10 meters.
Plant material was locally sourced from a nearby farmhouse along the Yamuna Expressway, ensuring ecological compatibility and cost efficiency.
Table 1. Average plant tissue concentrations of Phragmites and Typha in (mg/kg)
|
Plant Species |
Zn |
Fe |
Sulfur |
Total P |
Mg |
Ca |
Total K |
Total N |
|
Phragmites |
50 |
300 |
2000 |
1500 |
2000 |
5000 |
20000 |
18000 |
|
Typha |
45 |
250 |
1800 |
1200 |
1500 |
4000 |
18000 |
16000 |
Table 2. Harvests of plant biomass from the built wetland
|
Month of Harvesting |
Phragmites (kg) |
Typha (kg) |
|
January |
155 |
160 |
|
February |
165 |
170 |
|
March |
175 |
180 |
|
April |
190 |
200 |
|
May |
205 |
215 |
|
June |
225 |
230 |
|
July |
240 |
245 |
|
August |
260 |
265 |
|
September |
275 |
270 |
|
October |
280 |
285 |
|
November |
290 |
295 |
|
December |
300 |
300 |
|
Total |
2860 |
2915 |
Table 1 shows the Fresh weight of the plant biomass harvested from the constructed wetland during the study period (from 30 m2 area for each of the two plant species).
Table 2 displays the fresh weight of the plant biomass gathered from the built wetland during the course of the research (from 30 m2 area for each of the two plant species).
1.1.5 Treated water storage
Stored in a pond downstream of the CW was treated effluent. To stop seepage, the pond's side walls were stone-pitched, and its bottom was a compacted clay liner. Overflow from the pond joined the current downstream flow. Routine maintenance like trash disposal and plant harvesting requires very little technical knowledge and could be handled by a qualified gardener. This low-maintenance strategy guaranteed long-term usage and sustainability of the system.
1.2 Wastewater sampling and analysis
Using high-density polyethylene (HDPE) bottles, wastewater samples one liter each were manually collected bi-weekly in triplicate at the CW intake and outflow points. The bi-weekly frequency was selected to balance logistical feasibility with sufficient resolution to capture treatment performance trends and occasional fluctuations due to rainfall or industrial activity. Samples were transported within 2–3 hours to the local laboratory in ice-packed cartons to preserve biological and chemical integrity. Physical, chemical, and microbiological parameters were analyzed, including pH, TSS, BOD, COD, ammonia-N, total nitrogen, turbidity, and Escherichia coli.
Escherichia coli levels were quantified using the Most Probable Number (MPN) method, which allowed estimation of pathogen removal efficiency across the system.
This manual sampling strategy addressed two practical constraints: (1) the high risk of theft or vandalism of electronic equipment in the roadside village setting, and (2) the limited reliability of continuous monitoring instruments for parameters such as TKN and coliforms in a low-resource context.
Potential biases due to human error or timing inconsistencies were minimized by assigning trained field staff to perform all sampling using a standard operating procedure (SOP). Additional information on specific analytical protocols is provided in the subsequent methodology section. high-density polyethylene (HDPE) bottles, wastewater samples one L each were manually collected bi-weekly in triplicate at the CW intake and outflow. Samples were carried two to three hours to the local lab campus in ice cartons for examination. Analyzed were physical, chemical, and environmental factors. Escherichia coli levels measured using the most likely number (MPN) approach evaluated pathogen clearance efficacy.
Two main issues were resolved by this manual sampling approach: the risk of theft of expensive instruments in a roadside village environment and the poor dependability of real-time monitoring tools for several metrics. Additional information contains further specifics of the analytical techniques.
1.2.1 Sand sampling
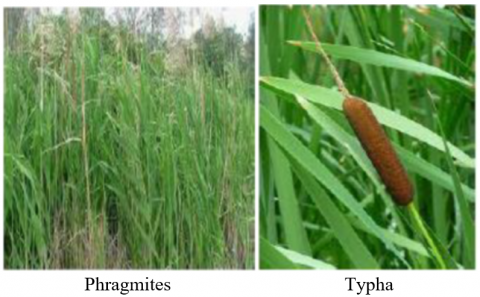
To track top-layer features, monthly sand sample was carried out during the research. Sand samples were gathered 2–5 cm deep using a sand auger. From regions planted with Phragmites and Typha as illustrated in Figure 4, samples of 100–500g each were triplicated. After that, composite samples (100g) were made for every vegetated region to guarantee a representative study.
Figure 4. Plant used in this study
1.2.2 Sample plant biomass
Using hedge shears, the above-ground portion of macrophytes was harvested manually at monthly intervals to monitor seasonal variation in biomass productivity.
A calibrated spring balance was used to directly quantify the fresh biomass weight immediately after cutting to reduce moisture loss error. Composite samples of 5 kg were collected separately for each species, Phragmites and Typha, and stored in labelled muslin bags for safe transport to the laboratory.
To determine the dry weight, the plant samples were oven-dried at 65℃ for 48 hours under controlled conditions. These dried samples were subsequently analyzed to assess biomass productivity and nutrient uptake capacity, particularly for nitrogen, phosphorus, and potassium.
1.2.3 Sand and plant sample analysis
Accurate measurement of nitrogen content in sand and plant tissues is essential to evaluate nutrient retention and cycling in the CW system.
For sand samples, total nitrogen was determined using the thiosulfate-modified Kjeldahl method, which accounts for both nitrate and nitrite fractions, offering a more comprehensive and reliable assessment of total nitrogen concentration in soil-like matrices [17]. This method is widely recognized for its reliability in estimating nitrogen concentrations, particularly in soil and sediment analyses [18].
Plant samples were pulverized into fine powder and oven-dried at 65℃ for 48 hours. Following digestion with nitric acid, the total nitrogen in these plant materials was investigated with an inductively coupled plasma atomic emission spectrophotometer. This method lets nitrogen be precisely quantified, which is necessary to assess the nutritional value of plant products [19]. The Kjeldahl method remains a standard for nitrogen determination, although it has limitations in quantifying nitrate nitrogen, which can be significant in certain samples [20]. Combining it with ICP-AES provides a robust and cross-validated analytical framework, ensuring accurate representation of nitrogen content in both solid substrate and plant biomass within the constructed wetland.
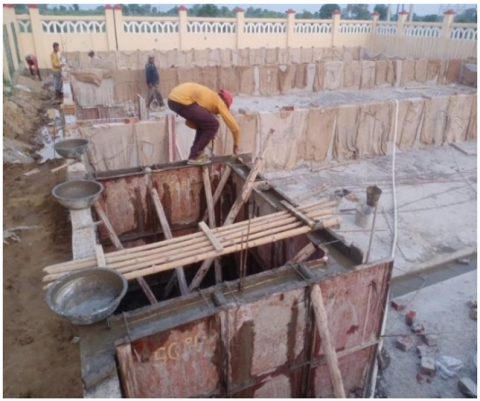
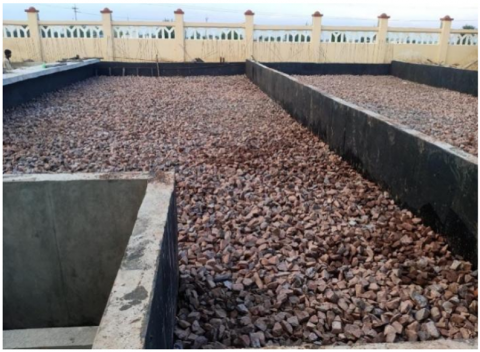
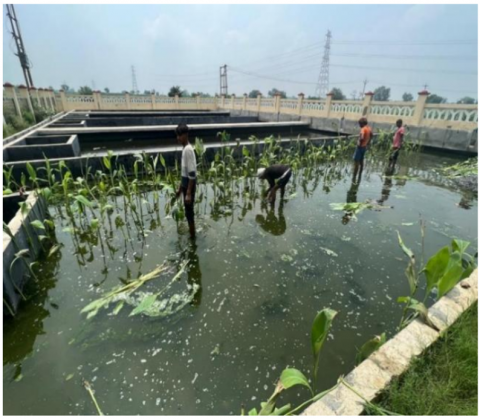
Designed to fit wastewater flow depending on water use and discharge projections in the research region, the CW. From an above tank, the village homes which linked to the intake drain got a daily water supply of 20 m³. With a hydraulic retention time (HRT) of 2.73 days, the design flow for the CW was calculated as 5MLD, assuming that 70% of this water was turned into wastewater. Different phases of created wetlands are shown in Figures 5-7. Figure 5 shows wetlands during development; Figure 6 shows CW bed material preparation; Figure 7 displays a CW plantation.
Figure 5. Wetlands in construction process
Figure 6. Preparation of bed materials in CW
Figure 7. Plantation in CW
2.1 Flow measurements
Direct wastewater flow measurements were taken using 1,000-litre plastic drums [21]. throughout the building phase 2022–2023. The findings showed that although peak flow times between 6:00 AM and 11:00 AM, 85% of wastewater flow happened between 6:00 AM and 6:00 PM. Determined to be between 5MLD, the average daily wastewater flow produced an actual HRT of almost three days. This computation included evapotranspiration losses inside the CW but omitted evaporation. The CW was built to allow various flow patterns while preserving ideal retention time to guarantee effective wastewater treatment.
3.1 Characteristics of wastewater
Table 3 lists fundamental water quality criteria and flow rates required for the planning of sewage treatment plants. The flow rates required for STP planning include a peak flow of 10,000 m³/day and an average flow of 5,000 m³/day. The influent BOD₅ is measured at 180 mg/L, with an effluent target of < 10 mg/L, indicating effective removal of biodegradable organics.
Table 3. Influent parameters after primary treatment for design of SBR & wetland
|
Parameters |
Unit |
Influent |
Effluent |
|
Average Flow |
m3/day |
5000 |
- |
|
Peak Flow |
m3/day |
10000 |
- |
|
BOD5 |
mg/l |
180 |
<10 |
|
COD |
mg/l |
500 |
<50 |
|
TSS |
mg/l |
400 |
<10 |
|
TKN |
mg/l |
50 |
<10 |
|
Total Phosphorus |
mg/l |
8-Jun |
<2 |
|
pH |
- |
6.5-7.6 |
6.5-8.5 |
The COD is 500 mg/L, with a treatment goal of < 50 mg/L, highlighting the reduction of total oxidizable pollutants. TSS is reduced from 400 mg/L to <10 mg/L, TKN from 50 mg/L to < 10 mg/L, and TP from 6–8 mg/L to < 2 mg/L, ensuring adequate nutrient and solids removal efficiency.
The pH is maintained within the influent range of 6.5–7.6, and stabilized post-treatment to 6.5–8.5, meeting CPCB norms for discharge into inland surface waters and enabling safe water reuse.
3.2 Seasonal variations in wastewater characteristics
Although wastewater properties were rather constant, notable fluctuations were seen throughout the monsoon season:
•Stormwater Incursion: Rainfall occurrences (> 5 mm) induced dilution of influent wastewater, therefore affecting other parameters such COD.
•Suspended Solids: Stormwater runoff caused a noticeable rise in overall suspended solids (TSS) during heavy rain.
•COD: Though lower values were noted during rainy events, the typical COD content in influent wastewater was about 250 mg/L.
•Sulfates: Seasonal agricultural activity affected the ranges of 50 to 70 mg/L that sulfate concentrations followed.
3.3 Stability of key parameters
•Salt Concentration and Physical Parameters: Stable wastewater characteristics were indicated by minimum fluctuations (5–7%) shown by pH and EC during the research period.
•Heavy Metals: Apart from a small quantity of arsenic (0.01 mg/L) found on one occasion, the wastewater was devoid of heavy metals across the research period. This lack emphasizes the irrigation possibility of rural wastewater.
3.4 Biodegradability and nutrient recycling
The wastewater's great biodegradability, shown by its high biological oxygen demand (BOD₅) to COD ratio, made it ideal for CW treatment. There was notable eutrophication potential evidenced by phosphorus, ammoniacal-nitrogen, and nitrate-nitrogen concentrations. By recycling nitrogen, phosphorus, and sulfur back into the soil, treated wastewater for fertigation increases nutrient usage efficiency; it also provides a perpetual source of water for agriculture and helps to prevent environmental damage related to raw wastewater release.
3.5 Characteristics of wastewater
3.5.1 Stabilization phase
The CW ran two operating phases: a steady-state period after a stabilization phase. Typha and Phragmites' planting set off the stabilizing phase. For important metrics including TSS, sulfate, COD, phosphate, ammoniacal nitrogen, and nitrate nitrogen, weekly wastewater monitoring throughout this period indicated notable changes in intake and output concentrations. These values turned out to be important performance benchmarks.
•CWs have demonstrated significant TSS removal efficiencies, particularly during the stabilization phase, where efficiencies can reach between 88.7% and 94% [21]. This performance is primarily attributed to the physical processes of screening and sedimentation that occur within these systems [12]. For instance, a study on CWs treating wastewater from a coffee processing plant reported an average TSS removal efficiency of 88.7%, which aligns with findings from other studies indicating similar or higher efficiencies in CWs [22].
•The establishment of rhizosphere microorganisms in CWs plays a pivotal role in enhancing the removal efficiencies of COD and inorganic nitrogen during the stabilization phase. As macrophytes become established, they facilitate the development of microbial biofilms in the rhizosphere, which significantly augments biodegradation processes [23, 24]. The aerenchyma tissue of these plants not only aids in oxygen transport but also creates an optimal environment for microbial activity, thereby enhancing nutrient cycling and pollutant degradation [25].
Research indicates that the interaction between plants and rhizosphere microorganisms is crucial for effective wastewater treatment. For instance, the microbial communities in the rhizosphere are influenced by root exudates, which can selectively promote beneficial microbial populations that enhance nutrient uptake and pollutant removal [26]. In CWs, the presence of diverse plant species contributes to a more robust microbial ecosystem, which is essential for the effective breakdown of organic matter and nitrogen compounds [27].
3.5.2 Post-stabilization phase
Consistent performance in wastewater treatment was observed during the post-stabilization phase (2022–2023). Key data on the efficiency of the (CW system are presented in Tables 4-6.
Table 4 presents the average influent concentrations and corresponding removal efficiencies for key water quality parameters prior to treatment. Table 5 shows the effluent concentrations and treatment efficiencies, and both tables compare the results with CPCB-prescribed discharge standards for inland surface waters.
Table 6 provides data on nutrient accumulation in the top sand layer of the CW bed, helping to explain internal nutrient retention and transformation mechanisms within the system.
Together, these tables highlight the effectiveness of the CW in reducing organic load, solids, nutrients, and pathogens, and illustrate the system’s performance across critical process variables such as removal efficiency (%), hydraulic retention time (HRT), and effluent quality compliance. Wastewater as well as the main process parameters.
Table 4. Average intake concentration and removal efficiency for various important wastewater parameters in the built wetland
|
Test Parameters |
Unit |
Test Method |
Results |
Limits as per CPCB (Inland Surface Water) |
|
pH (at 25Â℃) |
--- |
IS3025: (P-11) |
6.7± 1.5 |
6.0-9.0 |
|
TSS |
mg/l |
IS3025: (P-17) |
410± 20 |
100 Max |
|
COD |
mg/l |
IS3025: (P-58) |
450± 30 |
250 Max |
|
BOD (3 days @ 27Â℃) |
mg/l |
IS3025: (P-44) |
184 ± 25 |
30 Max |
|
Turbidity |
NTU |
IS3025: (P-10) |
1.3 ± 0.65 |
40 Max |
|
Ammonia-N |
mg/l |
IS3025:(P-34) |
28.6 ± 10 |
50 Max |
|
Total Nitrogen |
mg/l |
IS3025:(P-34) |
51.8 ± 5 |
90 Max |
|
Total Coliforms |
MPN/100ml |
IS1622 |
4250 ± 100 |
<1000 |
Table 5. For several important wastewater parameters in the built wetland, average outflow concentration and removal efficiency
|
Test Parameters |
Unit |
Result |
Test Method |
Limits as per CPCB (Inland Surface Water) |
|
pH (at 25℃) |
--- |
7.65 ± 3 |
IS3025: (P-11) |
6.0-9.0 |
|
Total Suspended Solids |
mg/l |
5 ± 2 |
IS3025: (P-17) |
100 Max |
|
COD |
mg/l |
30 ± 10 |
IS3025: (P-58) |
250 Max |
|
BOD (3 days @ 27℃) |
mg/l |
4 ± 2 |
IS3025: (P-44) |
30 Max |
|
Turbidity |
NTU |
<1 ± 0.5 |
IS3025: (P-10) |
40 Max |
|
Ammonia-N |
mg/l |
5 ± 2.5 |
IS3025: (P-34) |
50 Max |
|
Total Nitrogen |
mg/l |
4.3 ± 2.15 |
IS3025: (P-34) |
90 Max |
|
Total Coliforms |
MPN/100ml |
58 ± 5 |
IS1622 |
<1000 |
Table 6. The nutrient concentrations observed in the top layer sand in the CW
|
Test Parameters |
Unit |
Results |
|
Total-Nitrogen |
mg/l |
23± 10 |
|
Total-Phosphorous |
mg/l |
15± 8 |
|
Exchangeable-K |
mg/l |
8± 3 |
|
Exchangeable-Ca |
mg/l |
80 ± 20 |
|
Exchangeable-Mg |
mg/l |
20 ± 10 |
|
Available-Fe |
mg/l |
5 ± 2.5 |
|
Available-Zn |
mg/l |
3 ± 1.5 |
|
Available-B |
mg/l |
1 ± 0.5 |
|
Available-S |
mg/l |
15 ± 7.5 |
3.5.3 Seasonal and external influences
•Seasonal Stability: The system's robustness was shown by not appreciable seasonal change in the removal efficiencies for COD, inorganic nitrogen, or sulfur.
•Plant Growth and Harvesting: The main importance of rhizosphere microorganisms in pollution removal is shown by a modest effect of plant development stages on removal efficiency.
3.5.4 Comparative analysis
Incorporating wetland plants Phragmites and Typha, the built wetland system shows remarkable effectiveness in cleaning wastewater using natural biological, chemical, and physical processes. The following describes the changes in water quality metrics using thorough justification grounded on the contributions of the wetland design and the vegetation:
•pH (at 25℃): The inlet pH of 6.7 ± 1.5 is adjusted to 7.65 ± 3 at the outlet. The wetland system stabilizes pH due to microbial activities in the root zone of Phragmites and Typha, which facilitate natural buffering through the release and uptake of ions. Additionally, the substrate material in the wetland, such as gravel and soil, further helps regulate pH by neutralizing acidic or basic compounds. This stabilization ensures that the treated water remains suitable for reuse in applications like irrigation and construction.
Total Suspended Solids (TSS): TSS is reduced from 410 ± 20 mg/l to 5 ± 2 mg/l. This significant reduction occurs as suspended solids settle within the gravel layer of the wetland, aided by the roots of Phragmites and Typha, which create physical barriers that trap particles. The dense root mats and sedimentation processes enhance the filtration effect, resulting in high-quality, clear water at the outlet.
COD was reduced from 450 ± 30 mg/L to 30 ± 10 mg/L, reflecting a removal efficiency of approximately 93.33%. This substantial decrease is attributed to microbial degradation of organic pollutants, facilitated by the rhizosphere of Phragmites and Typha. These macrophytes enhance oxygen diffusion into the root zone, supporting aerobic bacteria that break down organic matter. Simultaneously, anaerobic microzones within the substrate allow for the degradation of more complex, non-biodegradable organics, enabling a dual-mode COD reduction mechanism.
BOD₅ dropped from 184 ± 25 mg/L to 4 ± 2 mg/L, with a corresponding removal efficiency of 97.83%. This indicates highly effective removal of biodegradable organic matter, largely driven by microbial decomposition supported by plant-assisted oxygenation. The extensive root systems of Phragmites and Typha create localized aerobic zones, where microbial communities convert complex organic compounds into simpler, non-toxic forms, ensuring consistently low BOD in the treated effluent.
Turbidity was reduced from 1.3 ± 0.65 NTU to <1 ± 0.5 NTU, signifying enhanced water clarity. This improvement results from the physical entrapment of suspended particles within the substrate layers and stabilization by plant root structures. The dense fibrous roots of Typha and Phragmites prevent resuspension of sediments, while promoting effective sedimentation, which contributes to sustained turbidity reduction.
•Ammonia-N: Ammonia-N is reduced from 28.6 ± 10 mg/l to 5 ± 2.5 mg/l through nitrification and denitrification processes. The root systems of Phragmites and Typha promote oxygen transfer to the rhizosphere, supporting nitrifying bacteria that convert ammonia to nitrite and nitrate. Subsequently, denitrifying bacteria in anaerobic zones of the substrate convert nitrate into nitrogen gas, completing the nitrogen removal cycle.
•Total Nitrogen (TKN): Total Nitrogen decreases from 51.8 ± 5 mg/l to 4.3 ± 2.15 mg/l, as Phragmites and Typha actively uptake nitrogen compounds for their growth. This biological uptake, combined with microbial activity in the root zone, contributes to effective nitrogen removal. Denitrification further reduces nitrogen levels, making the treated water environmentally safe.
•Total Coliforms: Total Coliforms are reduced from 4250 ± 100 MPN/100 ml to 58 ± 5 MPN/100 ml, reflecting a dramatic reduction in pathogens. The antimicrobial properties of the rhizosphere, created by root exudates from Phragmites and Typha, inhibit bacterial growth. Additionally, sedimentation and filtration processes physically remove bacteria, while microbial competition in the wetland further limits coliform populations.
3.6 Role of Phragmites and Typha
•Phragmites australis is particularly effective in enhancing oxygen transfer to the rhizosphere, which supports aerobic microbial communities essential for biodegradation. Its extensive and deep root system not only stabilizes the substrate but also creates favorable hydraulic flow paths, improving physical filtration. This species also plays a critical role in nutrient removal, especially nitrogen and phosphorus, through both direct uptake and facilitation of microbial nitrification-denitrification processes. Its ability to thrive in nutrient-rich wastewater conditions enhances the overall resilience of the constructed wetland.
•Typha latifolia, or cattail, is well adapted to fluctuating water levels and contributes significantly to sediment trapping and nutrient cycling. Its dense fibrous roots improve suspended solids retention and create bioactive zones that enhance microbial activity. Additionally, Typha’s root exudates exhibit antimicrobial properties, which aid in the suppression of pathogenic bacteria such as coliforms, contributing to overall water disinfection. Its high biomass productivity and nutrient uptake efficiency make it particularly valuable in multi-functional treatment systems. The complementary roles of Phragmites and Typha oxygenation vs. sediment stabilization, pathogen suppression vs. nutrient uptake demonstrate the synergistic advantage of dual-species integration, which is a key innovation of this study.
3.7 Wetland design
The wetland's multi-layered substrate, composed of graded gravel and coarse sand, combined with dense root networks of macrophytes, ensures effective physical filtration, sedimentation, and biological treatment. The interplay of aerobic zones (near plant roots) and anaerobic zones (within deeper substrate layers) enables the complete treatment spectrum from the breakdown of organic matter to nutrient transformation.
The integration of Phragmites and Typha enhances system performance through oxygenation, microbial stimulation, nutrient uptake, and sediment stabilization. Their complementary functional traits, oxygen transport by Phragmites and pathogen suppression by Typha, demonstrate the synergistic benefit of dual-species planting, which is a novel design element in this study.
The CW system demonstrated high removal efficiencies for TSS, BOD, COD, TKN, and total coliforms, meeting CPCB standards for effluent discharge and suitability for reuse in landscaping, irrigation, and industrial cooling. This nature-based solution offers a low-cost, energy-efficient, and ecologically sustainable model for decentralized wastewater management in urban-industrial and semi-arid settings.
In the context of the YEIDA region, the results of the CW system demonstrate its exceptional performance in decentralized wastewater treatment. Supported by the dual action of Phragmites and Typha, the system achieved substantial pollutant reductions across multiple water quality parameters.
TSS was reduced by 98.78%, indicating excellent physical filtration by the layered substrate and plant root networks.
COD and BOD were lowered by 93.33% and 97.83%, respectively, reflecting efficient microbial degradation and aerobic stabilization driven by root-zone oxygenation.
Ammonia-N and Total Nitrogen decreased by 82.52% and 91.69%, respectively, due to the combined effects of nitrification, denitrification, and plant uptake.
Total coliforms were reduced by 98.64%, confirming the system’s capability in pathogen removal and effluent disinfection.
While pH remained stable, reflecting the system’s natural buffering capacity, turbidity dropped by 23.08%, indicating improved clarity and sediment control.
These results confirm that the CW system offers a cost-effective, eco-friendly, and scalable solution for wastewater treatment. The treated water meets reuse standards for landscaping, irrigation, and industrial cooling, promoting water conservation and circular resource use in a water-stressed, urban-industrial region.
This study underscores the innovative integration of dual macrophytes under Indian semi-arid conditions, advancing the field of nature-based wastewater solutions. It provides a replicable and adaptable model for sustainable wastewater management in fast-growing urban and peri-urban areas across India.
[1] Agarwal, A., Kaur, A., Saxena, S., Arora, S. (2023). Achieving sustainable development goal related to water and sanitation through proper sewage management. In Sewage Management. Intech Open. https://doi.org/10.5772/intechopen.109970
[2] Bowes, M.J., Read, D.S., Joshi, H., Sinha, R., Ansari, A., Hazazra, M., Simon, M., Vishwakarma, R., Armstrong, L.K., Nicjolls, D.J.E., Wickham, H.D., Ward, J., Carvalho, L.R., Rees, H.G. (2020). Nutrient and microbial water quality of the Upper Ganga River, India: Identification of pollution sources. Environmental Monitoring and Assessment, 192: 533. https://doi.org/10.1007/s10661-020-08456-2
[3] Bassi, N., Kumar, S., Kumar, M.D., Ermen, S.V., Campling, P. (2022). Promoting wastewater treatment in India: Critical questions of economic viability. Water and Environment Journal, 36(4): 723-736. https://doi.org/10.1111/wej.12810
[4] Ngwane, M. (2024). Impact of deforestation on water quality in Cameroon. International Journal of Natural Sciences, 4(1): 46-57. https://doi.org/10.47604/ijns.2661
[5] Muzembo, B.A., Kitahara, K., Debnath, A.K., Ohno, A., Okamoto, K., Miyoshi, S. (2022). Cholera outbreaks in India, 2011–2020: A systematic review. International Journal of Environmental Research and Public Health, 19(9): 5738. https://doi.org/10.3390/ijerph19095738
[6] Shah, H.D., Shah, V., Desai, A.N. (2012). An epidemic outbreak of Vibrio Cholerae El Tor 01 serotype Ogawa biotype in a Lalpur town, Jamnagar, India. Journal of Postgraduate Medicine, 58(1): 14-18. https://doi.org/10.4103/0022-3859.93247
[7] Hossain, N., Madaniyazi, L., Ng, C.F.S., Nasrin, D., Seposo, X.T., Chua, P.L.C., Pan, R., Faruque, A.S.G., Hashizume, M. (2023). Short-term associations of diarrhoeal diseases in children with temperature and precipitation in seven low- and middle-income countries from Sub-Saharan Africa and South Asia in the Global Enteric Multicenter Study. PLoS Neglected Tropical Diseases, 18(10): e0011834. https://doi.org/10.1371/journal.pntd.0011834
[8] Sheikh, A., Hassan, O.I. (2021). Investigating the relationship between export diversification and river water pollution: A time series analysis of the Indian experience. Arthaniti – Journal of Economic Theory and Practice, 23(1): 56-74. https://doi.org/10.1177/09767479211040135
[9] Kaushal, M., Patil, M.D., Wani, S.P. (2017). Potency of constructed wetlands for deportation of pathogens index from rural, urban and industrial wastewater. International Journal of Environmental Science and Technology, 15: 637-648. https://doi.org/10.1007/s13762-017-1423-y
[10] Temel, F.A., Özyaz, G., Uslu, V.R., Ardal, Y. (2018). Full scale subsurface flow constructed wetlands for domestic wastewater treatment: 3 years’ experience. Environmental Progress & Sustainable Energy, 37(4): 1348-1360. https://doi.org/10.1002/ep.12908
[11] Vishwakarma, S., Dharmendra. (2022). A critical review on economical and sustainable solutions for wastewater treatment using constructed wetland. Civil and Environmental Engineering Reports, 32(3): 260-284. https://doi.org/10.2478/ceer-2022-0040
[12] Datta, A., Singh, H., Raja, S.K., Dixit, S. (2021). Constructed wetland for improved wastewater management and increased water use efficiency in resource scarce SAT villages: A case study from Kothapally village, in India. International Journal of Phytoremediation, 23(10): 1067-1076. https://doi.org/10.1080/15226514.2021.1876627
[13] Wu, H.M., Zhang, J., Ngo, H.H., Guo, W.S., Hu, Z., Liang, S., Fan, J.L., Liu, H. (2015). A review on the sustainability of constructed wetlands for wastewater treatment: Design and operation. Bioresource Technology, 175: 594-601. https://doi.org/10.1016/j.biortech.2014.10.068
[14] Jia, L., Gou, E., Liu, H., Lu, S., Wu, S., Wu, H. (2019). Exploring utilization of recycled agricultural biomass in constructed wetlands: Characterization of the driving force for high-rate nitrogen removal. Environmental Science & Technology, 53(3): 125801268. https://doi.org/10.1021/acs.est.8b04871
[15] Midhun, G., Divya, L., George, J., Jayakumar, P., Suriyanarayanan, S. (2016). Wastewater treatment studies on free water surface constructed wetland system. In Integrated Waste Management in India: Status and Future Prospects for Environmental Sustainability, pp. 97-109. https://doi.org/10.1007/978-3-319-27228-3_9
[16] Boukalová, Z., Tišitel, J., Gurung, B.D. (2020). Nature-based water treatment solutions and their successful implementation in Kathmandu Valley, Nepal. WIT Transactions on Ecology and the Environment, 242: 121-132. https://doi.org/10.2495/wp200111
[17] Gautam, V.P., Mishra, S., Ahmand, H. (2023). Comparison of total nitrogen estimation by Kjeldahl method and CHNS analyzer in dry tropical grassland. International Journal of Plant and Environment, 9(2): 180-182. https://doi.org/10.18811/ijpen.v9i02.13
[18] Urbat, F., Müller, P., Hildebrand, A.A., Wefers, D., Bunzel, M. (2019). Comparison and optimization of different protein nitrogen quantitation and residual protein characterization methods in dietary fiber preparations. Frontiers in Nutrition, 6: 127. https://doi.org/10.3389/fnut.2019.00127
[19] Islam, M.K., Ishida, M., Ando, S., Nishida, T., Yamada, T. (2003). A method for determination of nitrogen in ruminant feedstuffs and products. Asian-Australasian Journal of Animal Sciences, 16(10): 1438-1442. https://doi.org/10.5713/ajas.2003.1438
[20] Sader, A.P.O., Oliveira, S.G., Berchielli, T.T. (2004). Application of Kjeldahl and Dumas combustion methods for nitrogen analysis. Archives of Veterinary Science, 9(2): 73-79. https://doi.org/10.5380/avs.v9i2.4068
[21] Berego, Y.S., Sota, S.S., Ulsido, M.D., Beyene, E.M. (2022). Treatment performance assessment of natural and constructed wetlands on wastewater from Kege wet coffee processing plant in Dale Woreda, Sidama Regional State, Ethiopia. Environmental Health Insights, 16. https://doi.org/10.1177/11786302221142749
[22] Soundaranayaki, K. (2017). Treatment of grey water using horizontal flow constructed wetland. Journal of Energy, Environment & Sustainability, 4: 6-9. https://doi.org/10.47469/jees.2017.v04.100039
[23] Deng, N., Liu, C.X., Tian, Y.X., Song, Q.G., Niu, Y.D., Ma, F.F. (2024). Assembly processes of rhizosphere and phyllosphere bacterial communities in constructed wetlands created via transformation of rice paddies. Frontiers in Microbiology, 15: 1337435. https://doi.org/10.3389/fmicb.2024.1337435
[24] Bai, Y., Liang, J., Liu, R., Hu, C., Qu, J. (2014). Metagenomic analysis reveals microbial diversity and function in the rhizosphere soil of a constructed wetland. Environmental Technology, 35(20): 2521-2527. https://doi.org/10.1080/09593330.2014.911361
[25] Mulidzi, A.R. (2010). Winery and distillery wastewater treatment by constructed wetland with shorter retention time. Water Science and Technology, 61(10): 2611-2615. https://doi.org/10.2166/wst.2010.206
[26] Sánchez-Cañizares, C., Jorrín, B., Poole, P.S., Tkacz, A. (2017). Understanding the holobiont: The interdependence of plants and their microbiome. Current Opinion in Microbiology, 38: 188-196. https://doi.org/10.1016/j.mib.2017.07.001
[27] Khan, S., Ahmad, I., Shah, M.T., Rehman, S., Khaliq, A. (2009). Use of constructed wetland for the removal of heavy metals from industrial wastewater. Journal of Environmental Management, 90(11): 3451-3457. https://doi.org/10.1016/j.jenvman.2009.05.026