Qianhan Zhang*![]() | Rui Yuan
| Rui Yuan![]() | Yajin Hou
| Yajin Hou![]() | Yinke Feng
| Yinke Feng![]() | Jian Wang
| Jian Wang![]()
© 2025 The authors. This article is published by IIETA and is licensed under the CC BY 4.0 license (http://creativecommons.org/licenses/by/4.0/).
OPEN ACCESS
Against the backdrop of global energy transition, the continuous growth in both the installed capacity of wind farms and the power rating of individual turbines has made efficient heat dissipation of core components in high-power wind turbines critical for ensuring their reliable operation. Existing cooling system designs often rely on empirical parameters or simplified models, leading to issues such as uneven heat transfer, significant flow resistance losses, and insufficient multi-objective optimization. Most current studies focus on optimizing single performance indicators, with limited attention to the complex fluid-thermal coupling characteristics, dynamic response under multiple operating conditions, and the coordinated optimization of thermodynamic performance and economic considerations. Traditional single-objective methods are prone to local optima and often lack practical applicability. To address these challenges, this study conducts a comprehensive thermodynamic performance analysis and multi-objective optimization design of cooling systems in wind farms. A fluid-thermal coupled model based on computational fluid dynamics (CFD) is first developed to reveal the distribution patterns of velocity and temperature fields under various conditions, and to analyze the intrinsic coupling mechanisms between heat transfer efficiency and flow resistance. Subsequently, a multi-objective genetic algorithm is introduced to construct an optimization model that incorporates material properties and manufacturing constraints. Through parameter sensitivity analysis, a Pareto-optimal solution set is obtained and its engineering feasibility is evaluated. The findings offer an optimization strategy that balances thermodynamic performance and cost-effectiveness, overcoming the limitations of traditional single-objective approaches. This research provides theoretical and practical insights for improving the overall performance of high-power wind turbines under complex operating conditions.
wind farm cooling system, thermodynamic performance analysis, multi-objective optimization, fluid-thermal coupling, pareto optimality
With the accelerated advancement of global energy transition, wind power generation [1-4], as an important component of clean and renewable energy, continues to witness increases in both installed capacity and the rated power of individual turbines. During the operation of high-power wind turbines, core equipment such as generators and converters generates a large amount of heat due to electrical energy conversion and mechanical losses [5, 6]. If heat is not dissipated in a timely and effective manner, it will lead to excessive temperature rise, reduced efficiency, and even equipment failure, which seriously affects the reliable operation and economic performance of wind farms. At present, cooling systems [7-10] mostly adopt air cooling, liquid cooling, or hybrid cooling schemes, and their thermodynamic performance directly determines the service life of the equipment and the energy efficiency of the system. However, the existing cooling system designs are often based on empirical parameters or simplified models [11-14], with insufficient consideration of the coupling between complex flow fields and temperature fields, the dynamic characteristics under multi-condition operation, and the needs of multi-objective optimization. As a result, problems such as uneven heat transfer, large flow resistance loss, and poor control flexibility exist during actual operation, which urgently calls for systematic research based on thermodynamic principles.
Thermodynamic performance optimization of wind farm cooling systems is a key step to improve turbine reliability and reduce operation and maintenance costs. It is also an important technical support for achieving high efficiency and intelligence of wind power equipment. By revealing the coupling mechanism of fluid flow and heat transfer inside the cooling system and establishing an accurate thermodynamic analysis model, the design and parameter matching of the cooling structure can be effectively guided, thereby ensuring the safe operating temperature of the equipment while reducing cooling energy consumption. Furthermore, conducting multi-objective optimization design can balance multiple performance indicators such as heat transfer efficiency, flow resistance, and lifecycle cost of equipment, providing a scientific and reasonable optimization strategy for the engineering design of cooling systems. This has not only direct application value in improving the power density and operational stability of wind turbines but also important practical significance in promoting the development of efficient heat dissipation technologies in the field of renewable energy and contributing to the realization of the "dual carbon" goals.
Existing research on cooling systems mainly focuses on the optimization of a single performance indicator, such as improving the heat transfer coefficient by changing the flow channel structure [15-17], or reducing pumping power based on flow resistance models. However, there is a lack of systematic research on multi-objective coupled optimization. Although some researchers have introduced thermodynamic analysis methods [18], they have ignored the influence of environmental temperature and load fluctuations on the dynamic characteristics of cooling systems during actual operation. The simplified models they established cannot accurately describe the contradictory relationship between heat transfer enhancement and pressure drop in complex flow fields. In addition, traditional optimization methods mostly rely on single-objective function iteration [19, 20], which are prone to falling into local optima and fail to fully consider constraints such as material properties, manufacturing processes, and operation and maintenance costs, thus limiting the engineering applicability of the optimization schemes. How to construct a multi-objective optimization model that includes thermodynamic performance, economic feasibility, and reliability in a multi-variable and strongly coupled cooling system remains a current research challenge.
To address the above problems, this paper conducts research on thermodynamic performance analysis and multi-objective optimization design of cooling systems in wind farms. The main content includes two parts: first, based on CFD and heat transfer theory, a fluid-thermal coupled thermodynamic model of the cooling system is established to analyze the distribution characteristics of velocity and temperature fields under different operating conditions and to reveal the intrinsic correlation mechanism between heat transfer efficiency and flow resistance; second, a multi-objective optimization model is constructed by introducing a multi-objective genetic algorithm. Through parameter sensitivity analysis, key influencing factors are identified, a Pareto optimal solution set is obtained, and its engineering feasibility is evaluated. The research results will provide an optimization scheme with both thermodynamic performance and economic efficiency for the design of wind farm cooling systems, effectively overcoming the limitations of traditional single-objective optimization and improving the comprehensive performance of cooling systems under complex conditions, which has important theoretical significance and engineering application value for promoting the innovative development of cooling technology for high-power wind turbines.
2.1 System geometry and assumptions
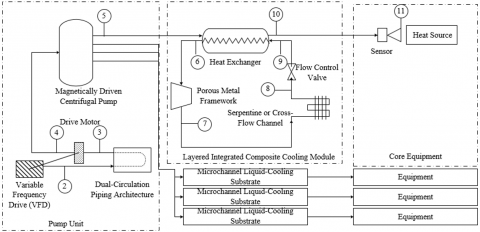
Aiming at the demand for efficient heat dissipation of core equipment such as generators and converters in wind farm cooling systems, a geometrical structure of a layered integrated composite cooling module combining phase change cooling and liquid cooling is designed. A microchannel liquid cooling substrate is directly attached to the surface of the heat-generating components of the equipment. The internal flow channels of the substrate adopt serpentine or cross-flow designs, using deionized water or thermal oil as the coolant. The coolant is driven by a pump set to form a closed loop, realizing rapid heat conduction from concentrated heat sources. On the outer side of the liquid-cooled substrate or in the interlayer of the equipment shell, phase change materials (PCM) encapsulated in a porous metal framework are embedded, forming a dual-layer structure of "liquid cooling for priority heat dissipation - phase change heat storage buffering". The geometric parameters of the liquid cooling channels need to be optimized according to the heat source distribution to ensure flow field uniformity and reduce flow resistance.
The PCM layer is tightly attached to the liquid cooling substrate via thermal interface materials. During high-load operation, it absorbs the peak heat that the liquid cooling system cannot dissipate in time; during load reduction, it releases the stored heat to maintain temperature stability and avoid local overheating. In addition, the system integrates temperature sensors and flow control valves to dynamically adjust the liquid cooling flow rate and the working state of the PCM according to real-time working conditions, forming a coordinated cooling mechanism of active liquid cooling and passive phase change cooling. Figure 1 shows the structure of the wind farm cooling system.
Figure 1. Structure of wind farm cooling system
When conducting thermodynamic performance analysis of the wind farm cooling system based on phase change and liquid cooling coupling, the following four assumptions are proposed based on research objectives and engineering simplification needs: (1) Constant thermal physical properties of materials: it is assumed that the phase change latent heat, thermal conductivity, and density of the PCM and the viscosity, specific heat capacity of the coolant do not vary with temperature. The temperature dependence in the heat transfer process is ignored to simplify the thermodynamic model and focus on the analysis of core fluid-thermal coupling mechanisms. (2) Uniform and simplified heat source: it is assumed that the heat sources of the stator windings of the generator, IGBT modules of the converter, and other core heat-generating components are uniform internal heat sources. The local hotspot differences and radiation effects during discharge are ignored, and only the heat transfer process dominated by conduction and convective heat transfer is considered. This facilitates the establishment of a unified heat source loading model and temperature field solution. (3) Idealized neglect of contact thermal resistance: the contact thermal resistance between the liquid cooling substrate and the surface of heat-generating components, as well as between the PCM layer and the liquid cooling substrate, is ignored. It is assumed that the thermal conduction interfaces between components are in ideal contact state. This simplifies the nonlinear thermal resistance in the heat flow path and highlights the coordinated cooling performance analysis of the liquid cooling channel structure and the PCM layer. (4) Simplified fluid behavior: the coolant and the melted PCM are treated as incompressible Newtonian fluids. The non-Newtonian characteristics and density changes of PCM in liquid state during phase change are ignored. This simplifies the coupling solution of momentum and energy equations and facilitates the analysis of flow resistance characteristics of the liquid cooling system and the natural or forced convection effects during PCM melting. The above assumptions, while reasonably simplifying complex physical processes, ensure that the research focuses on the core thermodynamic performance of the cooling system, and provide a feasible theoretical modeling basis for multi-objective optimization design.
2.2 Thermodynamic performance analysis of core equipment
In the wind farm cooling system coupled with phase change cooling and liquid cooling, the core equipment acts as a heat source, and the construction of its heat conduction differential equation needs to be closely combined with the physical structure and heat transfer characteristics of the core heat-generating components. For solid-state heat-generating areas such as the stator windings of the generator and the IGBT modules of the converter, the equation is based on the basic law of heat conduction. The equipment is regarded as a continuous medium, ignoring local contact thermal resistance and radiation effects, and focusing on describing the variation law of the temperature field in three-dimensional space over time. Assuming that the density and specific heat capacity of the equipment are denoted by ϑy and Zy, and the thermal conductivity components by ηa, ηb, ηc, and the volumetric heat generation rate by W, then the heat conduction differential equation is:
$\vartheta_y Z_y \frac{\partial S}{\partial s}=\frac{\partial}{\partial s}\left(\eta_a \frac{\partial S}{\partial a}\right)+\frac{\partial}{\partial b}\left(\eta_b \frac{\partial S}{\partial b}\right)+\frac{\partial}{\partial c}\left(\eta_c \frac{\partial S}{\partial c}\right)+W$ (1)
The construction of the actual heat generation rate equation is based on the power loss mechanism of the core equipment of wind turbines, converting various losses during the electrical energy conversion process into volumetric heat generation intensity. For the generator, the heat generation rate mainly comes from Joule loss caused by winding resistance, hysteresis and eddy current loss due to alternating magnetic fields in the iron core, and mechanical losses such as bearing friction. These losses can be calculated in real time using the equipment's electromagnetic design parameters, operating current, and voltage, and averaged by volume. For the IGBT modules of the converter, the heat generation rate is composed of conduction losses caused by on-state resistance and energy losses during switching processes, which are directly related to the operating frequency, duty cycle, and load current. Under the research assumptions, the heat generation rate equation ignores local hotspot differences and regards heat-generating components as uniform internal heat sources whose intensity dynamically varies with the equipment load. In the cooling system coupled with phase change and liquid cooling, the heat generation rate needs to form a dynamic balance with the real-time heat dissipation capacity of the liquid cooling system and the heat storage effect of the PCM. When the equipment operates under high load, the heat generation rate exceeds the real-time heat dissipation amount of the liquid cooling system, and the excess heat is absorbed by the PCM through solid-liquid phase change and stored in the form of latent heat. When the load decreases, the PCM releases the stored heat to prevent excessive temperature drop of the equipment. Thus, the heat generation rate equation reflects the coordinated mechanism of "real-time heat generation - active heat dissipation - passive heat storage", providing accurate heat source boundary conditions for thermodynamic performance analysis. Assuming the heat generation rate per unit volume of the equipment is denoted by W, the equipment volume is n, the operating current is I, the open-circuit voltage is U0, the equivalent internal resistance is E0, and the entropy coefficient of the battery is dR0/dS, then the actual heat generation rate of the equipment can be calculated by the following equation:
$W=\frac{1}{N_y}\left(I E_0-S \frac{d U_0}{d S}\right)$ (2)
2.3 Thermodynamic performance analysis of PCM
In the cooling system of wind farms coupling phase change cooling and liquid cooling, the thermal conductivity density Oozl of the PCM material needs to be calculated based on its physical state and the heat conduction characteristics of the porous carrier structure. When the PCM is in a solid state, heat transfer is dominated by thermal conduction, and the thermal conductivity density is related to the material’s intrinsic thermal conductivity and the temperature gradient. The high thermal conductivity of the porous metal framework can enhance the overall heat transfer efficiency, allowing heat to quickly diffuse from the liquid cooling substrate into the PCM. When entering the solid-liquid coexistence phase change stage, the thermal conductivity of PCM is affected by the proportion of solid skeleton and liquid part. The solid skeleton maintains structural support and dominates heat conduction, while the liquid part, although having a lower thermal conductivity, forms a composite heat transfer mechanism of "solid phase conduction as primary, liquid phase diffusion as auxiliary" through synergy with the porous carrier. After complete melting, in the liquid phase stage, the thermal conductivity density depends mainly on the liquid thermal conductivity characteristics of the material and the contact condition with surrounding structures. At this time, the heat not dissipated in time by the liquid cooling system is buffered via thermal conduction and heat storage effect of the liquid PCM to avoid local overheating of the equipment. Assuming that the thermal conductivity of the PCM is denoted by ηozl, the specific heat capacity and phase change latent heat of the composite PCM are denoted by Zozl and M, respectively, and the PCM temperature and ambient temperature are denoted by Sozl and Sx, then the thermal conductivity density of the PCM can be calculated by the following formula:
$\vartheta_{o z l} \frac{\partial G_{o z l}}{\partial s}=\nabla \cdot\left(\eta_{o z l} \nabla S_{o z l}\right)$ (3)
The enthalpy Gozl of PCM needs to include both sensible heat and latent heat contributions to reflect the energy storage and release characteristics during the phase change process. In the solid-state phase, the enthalpy increases linearly with temperature in the form of sensible heat, reflecting energy accumulation due to temperature rise. When the temperature reaches the lower limit of the phase change interval, PCM starts absorbing heat and undergoes solid-liquid phase change. The growth rate of enthalpy accelerates, with the absorbed heat mainly used to break molecular lattice structures and converted into latent heat storage, while the temperature remains nearly constant within the phase change interval. After complete melting into the liquid phase, the enthalpy again increases with temperature in the form of sensible heat, but the growth rate may differ from that in the solid phase due to the difference in liquid phase specific heat. This enthalpy variation enables PCM to play a key role during load fluctuations in wind turbines: it absorbs peak heat during high loads and stores it as latent heat, and releases latent heat during low loads to maintain temperature stability, thereby balancing the real-time cooling load. The enthalpy of PCM can be calculated by the following formula:
$G_{o z l}=\int_{S_x}^{S_{o z l}} Z_{o z l} d S+\psi M$ (4)
The liquid phase fraction ψ is a key parameter describing the melting degree of PCM, and its calculation is based on the temperature and its relative position within the phase change interval. When the PCM temperature is below the phase change start temperature, the liquid fraction is zero and the material is in fully solid state. When the temperature is above the phase change end temperature, the liquid fraction is 1 and the material is completely melted in liquid state. Within the phase change interval, the liquid fraction increases linearly from 0 to 1 with temperature rise, reflecting the dynamic change of the solid-liquid phase ratio. This parameter directly affects the effective thermal conductivity and heat storage capacity of PCM: when the liquid fraction is low, the solid skeleton dominates thermal conduction and heat storage is mainly sensible heat; as the liquid fraction increases, the proportion of the liquid part increases, the share of latent heat storage rises, and heat exchange across the solid-liquid interface is enhanced. In the wind farm cooling system, the real-time change of liquid phase fraction is closely related to equipment load and liquid cooling system efficiency, and can serve as an important indicator for evaluating PCM heat storage status and system thermodynamic performance. It provides a basis for optimizing coolant flow rate, PCM selection, and structural design. Assuming the solid phase temperature of PCM is denoted by St, and the liquid phase temperature is denoted by Sm, the expression of ψ is:
$\psi=\left\{\begin{array}{l}0, S_{o z l}<S_t \\ \frac{S_{o z l}-S_t}{S_m-S}, S_t \leq S \leq S_m \\ 1, S_{o z l}>S_m\end{array}\right.$ (5)
2.4 Analysis of coolant flow and heat transfer
In the wind farm cooling system coupling phase change cooling and liquid cooling, the mass, momentum, and energy conservation equations of coolant flow and heat transfer need to be constructed closely around the physical characteristics of the liquid cooling circulation system and the coupled cooling mechanism. The mass conservation equation is based on the assumption that the coolant flows as an incompressible fluid within closed microchannel passages, with no increase or decrease in mass during flow. The mass flow rate remains constant across all cross-sections of the flow path, reflecting the balance between inflow and outflow, and ensuring a basis for analyzing factors such as flow distribution and symmetry of flow channel branches that affect flow uniformity during the coolant circulation process. The momentum conservation equation focuses on the balance between the driving force and resistance of fluid motion. It considers the forced convection process of the coolant under pump-driven conditions, takes the pressure gradient as the driving force for flow, and includes the effects of viscous forces on channel walls, local flow resistance, and inertial forces. It is used to describe the relationship between flow velocity distribution, pressure drop characteristics, and the geometric parameters of the flow channel, providing theoretical support for optimizing flow path structure to reduce flow resistance. The energy conservation equation couples the heat transfer process. On one hand, it reflects the heat absorbed by the coolant via convective heat transfer from the liquid cooling substrate; on the other hand, it describes the temperature variation of the coolant during flow, and, through thermal conduction between the channel walls and the external PCM layer, indirectly connects to the latent heat storage and release process of the PCM. When the heat carried by the coolant exceeds the heat absorption capacity of the PCM, the excess heat is removed by the liquid cooling system; otherwise, the PCM releases stored heat to maintain the coolant temperature stability. This forms an energy transfer and dynamic balance model of "heat source-liquid cooling-phase change". Assuming the density, specific heat capacity, and thermal conductivity of the coolant are represented by ϑz, Zz, and ηz, respectively, and the static pressure, temperature, and dynamic viscosity of the coolant are represented by o, Sz, and ωz, respectively. The coolant velocity vector is denoted by n, and time is denoted by s. Then the mass, momentum, and energy conservation equations for coolant flow and heat transfer are expressed as:
$\frac{\partial \vartheta_z}{\partial s}+\nabla \cdot\left(\vartheta_z n\right)=0$ (6)
$\frac{\partial\left(\vartheta_z n\right)}{\partial s}+\nabla \cdot \partial\left(\vartheta_z n n\right)=-\nabla o+\omega_z \cdot\left(\nabla^2 n\right)$ (7)
$\frac{\partial\left(Z_z \vartheta_z S_z\right)}{\partial s}+\nabla \cdot\left(Z_z \vartheta_z n S_z\right)=\nabla \cdot\left(\eta_z \nabla S_z\right)$ (8)
To determine whether the coolant flow is laminar or turbulent, the Reynolds number Re is used as the evaluation index. Assuming the coolant flow velocity is denoted by n, and the characteristic length of the coolant pipe is denoted by f, the formula is:
$\operatorname{Re}=\frac{\vartheta n f}{\omega_z}$ (9)
2.5 Boundary conditions
In the wind farm cooling system coupling phase change cooling and liquid cooling, the construction of boundary conditions for the heat source and PCM must closely follow the principles of heat transfer continuity and energy conservation. For the core heat sources such as generator stator windings and converter IGBT modules, the contact surface with the liquid cooling substrate is set as the first type of boundary condition, assuming that the heat generated by the heat source is transferred to the liquid cooling substrate without loss through an ideal thermal conduction interface, and the thermal resistance at the contact interface is ignored. The interface between the liquid cooling substrate and the PCM layer is treated as a coupled boundary, which must satisfy both temperature continuity and conservation of heat flux density. The solid PCM is tightly bonded to the substrate through the porous metal framework, and the heat flows into the PCM by conduction. When the temperature reaches the phase change range, the boundary condition incorporates the latent heat release effect, i.e., the unit area heat flux density equals the sum of the sensible heat change rate and the latent heat storage rate, reflecting the buffering effect of PCM during solid-liquid phase transition. Assuming the average radial thermal conductivity of the equipment is denoted by ηye, the axial thermal conductivity of the lithium-ion battery is ηyx, the thermal conductivity of the liquid cooling plate is ηPL, and the temperature gradient is ∂S/∂v, the boundary condition expressions are:
$-\eta_{y e} \frac{\partial S}{\partial v}=--\eta_{o z l} \frac{\partial S}{\partial v}$ (10)
$-\eta_{y x} \frac{\partial S}{\partial v}=--\eta_{P L} \frac{\partial S}{\partial v}$ (11)
The construction of the boundary conditions for coolant and pipeline is based on the closed-loop characteristic of the liquid cooling system and the forced convection mechanism. The inlet boundary is usually set as mass flow or velocity inlet condition. According to the rated parameters of the pump group and working condition requirements, a uniform velocity distribution is given. Considering the variable load operation of the wind turbine, the inlet flow rate can be set as a variable that dynamically adjusts with the heat source intensity. The outlet boundary adopts a pressure outlet condition, assuming the pressure at the end of the flow path is atmospheric or system back pressure, to avoid backflow and ensure sufficient development of flow. The pipe wall boundary follows the no-slip condition, and simultaneously sets either the convective heat transfer coefficient or heat flux density at the wall. The former calculates the heat transfer capacity between the coolant and the wall based on the geometry of the flow channel, while the latter directly relates to the heat flux export rate of the liquid cooling substrate. For the coupling boundary between the liquid phase region of PCM after melting and the pipeline, it is necessary to additionally consider the flow characteristics of liquid PCM. Through coupling of the momentum and energy equations, velocity continuity and temperature consistency between coolant flow and PCM heat transfer at the boundary are ensured, thereby constructing a collaborative heat dissipation boundary model of “liquid cooling forced convection-PCM passive heat storage”. Assuming the convective heat transfer coefficient of the coolant is denoted by gz, and the surface temperature of the liquid cooling plate pipe is SPL, the boundary condition expression is:
$-\eta_{P L} \frac{\partial S}{\partial v}=-\eta_z \frac{\partial S}{\partial v}+g_z\left(S_z-S_{P L}\right)$ (12)
2.6 Evaluation indicators
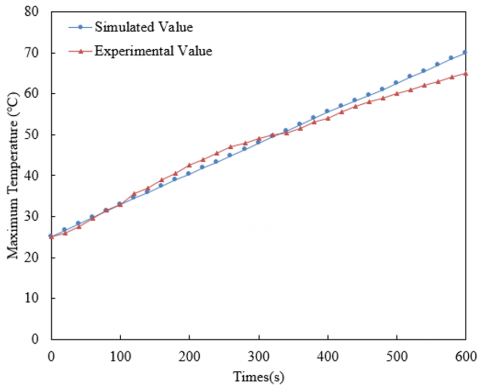
Figure 2 shows the numerical simulation results of the heat dissipation process of a single device, which verifies the accuracy of the constructed thermodynamic performance analysis model. In this paper, the maximum temperature SMAX, maximum temperature difference ΔSMAX, pressure drop △o, and PCM liquid fraction ψ are used as evaluation indicators. Among them, SMAX and ΔSMAX measure the heat dissipation capacity of the wind farm, and Δo represents the pressure drop between coolant inlet and outlet. ψ is the liquefaction rate of PCM, and a higher liquefaction rate indicates a higher utilization rate of PCM. Assuming the power of the pump is denoted by QPU, the pressure drop at the coolant inlet and outlet is Δo, and the volumetric flow rate is Wn, the relationship between Δo and power consumption is given by the following expression:
$Q_{P U}=\Delta o \cdot W_n$ (13)
Figure 2. Numerical simulation of single-device heat dissipation process
The multi-objective optimization of wind farm cooling systems based on the results of thermodynamic performance analysis takes the liquid cooling channel geometric parameter Fy, thermal physical property parameter of PCM u, and coolant flow velocity Iz as three core input features. These parameters directly affect the flow field uniformity, phase change heat storage capacity, and heat flux transfer efficiency of the cooling system. According to the thermodynamic model analysis, the geometric parameter of the flow channel determines flow resistance and heat exchange area, the characteristics of PCM affect the buffering capacity of peak heat, and the coolant parameters regulate the real-time heat dissipation rate. In the optimization process, the heat transfer coefficient gz and cooling system energy consumption Q are taken as two output labels. The former characterizes the unit area heat flux export capacity, and the latter reflects the system operation efficiency and economic performance comprehensively. The core of multi-objective optimization is, under the constraint of ensuring the safe temperature threshold of the equipment, to adjust input features to maximize the heat transfer coefficient to ensure cooling reliability, while minimizing the cooling energy consumption to improve system economy. Finally, a Pareto optimal solution set that balances thermodynamic performance and engineering cost is formed to solve the coupling optimization problem of “efficient heat dissipation” and “low consumption operation” under variable load conditions.
$\begin{aligned} & M A X: g_z=d_2\left(F_y, I_z, u\right) \\ & M I N: Q=d_3\left(I_z\right) \\ & \text { t.s. } \quad 2 \leq F_y \leq 5 \\ & 0.01 \leq I_z \leq 0.25 \\ & 6.8 \leq u \leq 25\end{aligned}$ (14)
In the process of multi-objective optimization of the wind farm cooling system, this paper chooses Latin Hypercube Sampling (LHS) to balance the requirements of sample diversity, computational efficiency, and model accuracy. The wind farm cooling system involves multiple strongly coupled design variables such as the geometric parameters of the liquid cooling channel, the thermal physical properties of PCM, and coolant flow rate. Its parameter space is characterized by nonlinearity and high dimensionality. Traditional random sampling is prone to uneven sample distribution or local clustering, making it difficult to fully reflect the interaction among variables. LHS adopts a stratified sampling strategy that divides the value range of each design variable into several mutually non-overlapping subintervals, ensuring that only one sample point is selected in each subinterval. This ensures uniform distribution of samples in the entire design space and effectively avoids the problems of sample redundancy or omission of key regions. Its basic principle is to stratify each variable, randomly select a sample value in each layer, and then form complete sample points through the combination of variables. This ensures the coverage of individual variables and achieves the diversity of multivariable combinations.
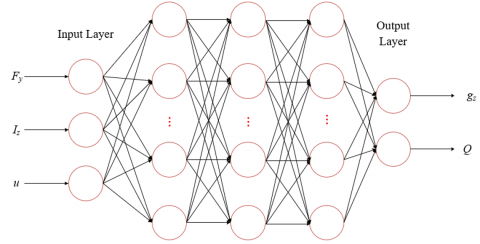
Figure 3. Schematic diagram of artificial neural network
In the multi-objective optimization of wind farm cooling systems, there exists a strongly coupled nonlinear mapping relationship between input features such as liquid cooling channel geometric parameters, thermal physical properties of PCM, and coolant flow rate, and output labels such as heat transfer coefficient and cooling energy consumption. Traditional regression models are difficult to capture such complex interactions, whereas artificial neural networks, through multilayer network structures and hierarchical feature extraction, can learn high-order nonlinear combinations of input features layer by layer. Figure 3 shows the adopted artificial neural network schematic. Specifically, the number of neurons in the input layer corresponds to the three design variables, and the output layer neurons correspond to the two optimization objectives. The hidden layers transform the original input features into abstract “flow-thermal coupling features” through adaptive adjustment of connection weights of neurons, thereby constructing a complex nonlinear mapping model from the parameter space to the objective space, significantly improving the fitting accuracy of the multi-objective coupling relationship of “flow resistance-heat transfer-energy consumption” under variable load conditions.
Due to the significant dimensional differences among the input features of the wind farm cooling system, directly inputting them into the neural network would result in gradient updates being biased toward high-magnitude features, reducing training efficiency and increasing the risk of overfitting. Therefore, normalization is adopted to scale all features to the [0,1] range. Specifically, for each input feature A, assuming its normalized value is A', original data value is A, maximum value is SMAX, and minimum value is SMIN, its normalized value is calculated by the following formula:
$A^{\prime}=\frac{A-A_{M I N}}{A_{M A X}-A_{M I N}}$ (15)
After normalization, the contribution of each feature to neuron activation tends to be balanced, avoiding training errors caused by dimensional differences, and accelerating the convergence speed of the gradient descent algorithm, allowing the neural network to more efficiently learn the synergistic effects of different parameters on cooling system performance, and providing a unified numerical basis for subsequent multi-objective optimization.
In the neural network architecture, the introduction of the ReLU activation function is crucial: it solves the gradient vanishing problem of traditional Sigmoid/Tanh functions through a “linear rectification” mechanism, enabling deep networks to effectively learn complex features while simplifying the computation process to adapt to the high-dimensional characteristics of CFD data. Its expression is:
$R E L U=\left\{\begin{array}{l}0, { if }\ a<0 \\ a, { otherwise }\end{array}\right.$ (16)
This study adopts a design of 3 hidden layers, aiming to balance model complexity and computational cost: shallow networks are difficult to capture deep features of flow-thermal coupling, while deep networks may lead to overfitting. This structure can approximate nonlinear functions through piecewise linear fitting, for example, decomposing the pressure drop characteristics of liquid cooling channels into laminar, transitional, and turbulent segments for mapping. In terms of training strategy, 80% of the data is used as the training set for weight updates, and 20% is used as the test set to verify generalization capability. The Adam optimization algorithm is used to dynamically adjust the learning rate, ensuring stable convergence of the model under variable condition data. Performance evaluation metrics RMSE and R² quantify the model accuracy from the perspectives of absolute error and goodness of fit. A smaller RMSE indicates smaller deviation between predicted and true values; R² closer to 1 indicates stronger explanatory power of the model for the target variables. Together, they ensure that the neural network can accurately map the nonlinear relationship between wind farm cooling system parameters and performance indicators. Assuming the total amount of data is v, the actual value is Bu, the predicted value is $\widehat{B}_u$, and the average of all predicted values is $\widehat{B}_u$, the expressions for RMSE and R2 are:
$R M S E=\sqrt{\frac{1}{v} \sum_{u=1}^v\left(B_u-\hat{B}_u\right)^2}$ (17)
$R^2=1-\frac{\sum_{u=1}^v\left(B_u-\hat{B}_u\right)^2}{\sum_{u=1}^v\left(B_u-\bar{B}_u\right)^2}$ (18)
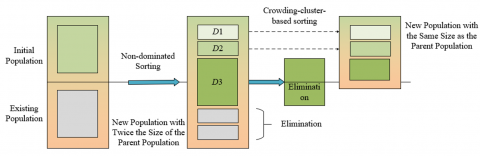
In the multi-objective optimization of wind farm cooling systems based on thermodynamic performance analysis, this paper chooses to use the NSGA-II genetic algorithm to find the global optimal solution of the neural network prediction model, that is, to efficiently explore the Pareto optimal solution set of “maximizing heat transfer coefficient” and “minimizing cooling energy consumption” by simulating the process of natural evolution. Figure 4 shows the schematic diagram of each iteration process of NSGA-II. This algorithm uses the nonlinear mapping relationship between input features and output labels established by the neural network as the basis, first generating an initial population containing diverse combinations of design variables, each individual corresponding to a cooling system design scheme. The population is iteratively evolved through genetic operations: selection operation retains advantageous individuals based on non-dominated sorting, and crossover and mutation introduce new parameter combinations to expand the search space and avoid local optima. After mixing the parent and offspring populations, individuals are layered by Pareto level through fast non-dominated sorting, with high-level individuals preferentially retained, and crowding distance is used to ensure the uniform distribution of solutions in the objective space and avoid excessive aggregation. The introduction of an elitist strategy allows high-quality solutions to directly enter the next generation, improving convergence speed; for the high-dimensional and strongly coupled characteristics of the wind farm cooling system parameter space, crowding distance sorting further ensures the diversity of different design schemes. Finally, through multiple generations of iteration, the Pareto front is approximated, providing an optimal solution set that balances heat dissipation reliability and economic performance for engineering design. This process uses the neural network surrogate model to reduce the high cost of transient CFD computation, while utilizing the global search capability of NSGA-II to effectively solve the multi-objective conflict between “heat transfer efficiency” and “energy consumption cost” in the cooling system, achieving comprehensive optimization of system performance under complex working conditions.
Figure 4. Schematic diagram of each iteration of NSGA-II
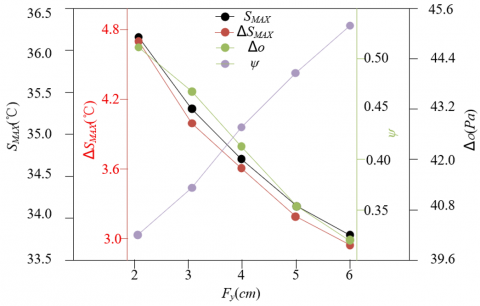
Figure 5 shows the effect of the liquid cooling channel geometric parameter Fy on the thermodynamic performance of the wind farm cooling system. The horizontal coordinate Fy varies from 2 cm to 6 cm. The maximum temperature SMAX and maximum temperature difference ΔSMAX on the left vertical axis show a significant decreasing trend with the increase of Fy: when Fy= 2cm, SMAX≈36.3℃, ΔSMAX≈4.8℃; when Fy=6 cm, they drop to 33.8℃ and 3.0℃ respectively, with a decrease of 2.5℃ and 1.8℃. The pressure drop Δo on the right vertical axis drops from 0.50 Pa to 0.35 Pa, a reduction of 30%, indicating that increasing the channel width effectively reduces flow resistance and pump energy consumption. The PCM liquid phase fraction ψ increases from 0.30 at Fy=2 to 0.50 at Fy=6, indicating that a wider channel enhances the heat storage capacity of the PCM. The above data indicate that increasing Fy can simultaneously optimize heat dissipation uniformity, improve heat transfer efficiency, reduce flow energy consumption, and enhance phase change heat storage capacity, verifying the key impact of channel geometric parameters on multi-objective performance and providing direct evidence for subsequent parameter sensitivity analysis and multi-objective optimization.
Figure 5. Variation of wind farm heat dissipation performance under different liquid cooling channel geometric parameters
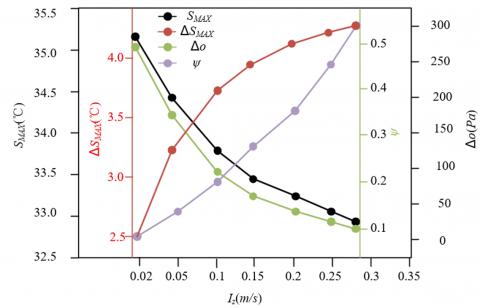
Figure 6 shows the effect of coolant flow rate Iz on the thermodynamic performance of the wind farm cooling system. As Iz increases from 0.02 m/s to 0.3 m/s, the maximum temperature SMAX decreases from 35.2℃ to 32.9℃, a drop of 2.3℃, indicating that the increase in flow rate significantly enhances convective heat transfer and effectively reduces system heat accumulation. The maximum temperature difference ΔSMAX increases from 2.5℃ to 3.5℃, reflecting that under high-speed flow, the temperature difference between inlet and outlet of coolant expands, but the average heat transfer efficiency is optimized due to increased flow rate. The pressure drop Δo shows a decreasing trend with increasing flow rate. PCM liquid phase fraction ψ increases from 0.25 to 0.5, indicating that the increase in flow rate promotes PCM melting and enhances system heat storage capacity. In summary, coolant flow rate Iz is a key variable to regulate heat transfer efficiency and energy consumption: high-speed flow improves heat transfer but increases energy consumption, while also enhancing phase change heat storage, providing a coupling mechanism between variables for multi-objective optimization.
Figure 6. Variation of wind farm heat dissipation performance under different coolant flow rates
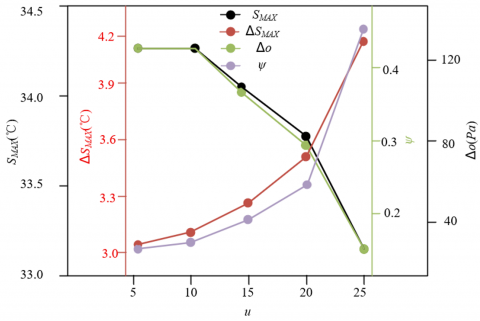
Figure 7 presents the influence pattern of PCM thermal physical parameter u on the performance of the wind farm cooling system. When u increases from 5 to 25, the maximum temperature SMAX decreases from 34.2℃ to 33.0℃, a drop of 1.2℃, indicating that the enhancement of PCM thermal physical properties significantly strengthens the cooling capacity of the system and effectively suppresses heat accumulation. The maximum temperature difference ΔSMAX increases from 3.0℃ to 4.2℃, reflecting that after thermal property optimization, the temperature gradient of the coolant in the flow channel expands, but the overall heat transfer efficiency is optimized due to improved heat storage and thermal conductivity of the PCM. Pressure drop Δo decreases from 120 Pa to 40 Pa, indicating that the increase of u reduces the circulation resistance of the coolant, directly reducing the energy consumption of the cooling system. PCM liquid phase fraction ψ increases from 0.25 to 0.4, showing that the improvement of thermal physical parameter u promotes the melting of the PCM and enhances the system's thermal buffering capacity. In summary, PCM thermal physical parameter u has a strong positive correlation with cooling system performance: increasing u can simultaneously optimize heat dissipation efficiency, reduce flow energy consumption, and enhance heat storage capacity, providing a synergistic optimization space of key variables for multi-objective optimization.
Figure 7. Variation of wind farm heat dissipation performance under different PCM thermal physical parameters
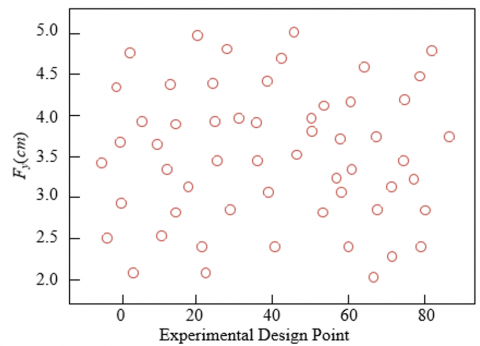
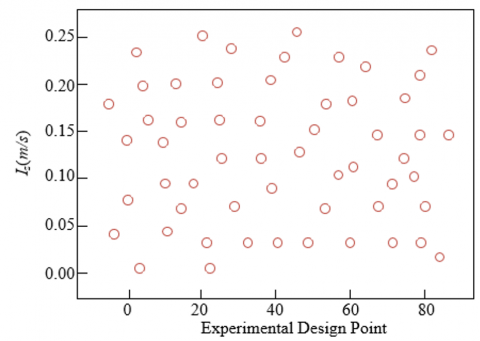
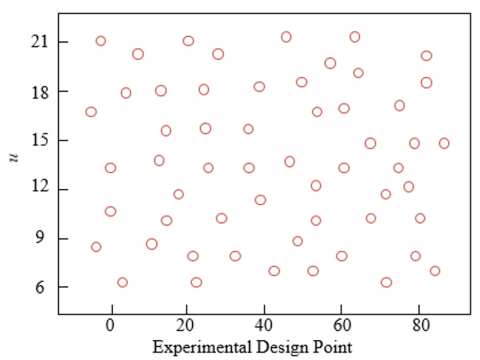
Figure 8 shows the sample distribution of design variables in multi-objective optimization, covering liquid cooling channel geometric parameter Fy, coolant flow rate Iz, and PCM thermal physical parameter u. In the three subgraphs, the sample points of each variable are evenly distributed over 80 experimental design points, with no obvious clustering or omission, indicating that the experimental design adopted methods such as LHS to fully cover the key areas of the parameter space. For example, the value of Fy varies continuously from 2.0 to 5.0 cm, ensuring full-range exploration of the influence of channel width on heat dissipation performance; Iz covers laminar and turbulent conditions, capturing the characteristics of heat transfer and energy consumption under different flow states; the range of u from 6 to 21 covers the thermal property differences from paraffin-based to metal-based PCM. Such evenly distributed samples provide sufficient nonlinear fitting data for subsequent neural network modeling, ensuring that the model can accurately learn the complex coupling relationship between Fy, Iz, u and output labels and evaluation indicators, laying the data foundation for multi-objective optimization.
(c) PCM Thermal Physical Parameter u
Figure 8. Sample distribution points of multi-objective optimization design variables
Based on the above samples, this paper constructs a neural network surrogate model using input-output data generated by the flow-thermal coupling model, and then performs multi-objective optimization in combination with the NSGA-II algorithm. Experimental results show that the comprehensiveness of sample distribution enables the model to capture the nonlinear influence of each parameter on system performance: for example, when Fy increases, SMAX decreases but Δo may increase, forming a “heat transfer-energy consumption” conflict; Iz increases enhance convective heat transfer but increase pump power; optimization of u simultaneously improves heat dissipation and heat storage. During the NSGA-II algorithm search in this parameter space, non-dominated sorting and crowding distance calculation effectively balance multi-objective conflicts. The generated Pareto front includes diversified optimal solutions such as “high heat transfer-low energy consumption” and “low heat transfer-high heat storage.” Parameter sensitivity analysis shows that Fy has the highest influence weight on SMAX, followed by Iz and u, providing variable priorities for the optimization algorithm and improving search efficiency.
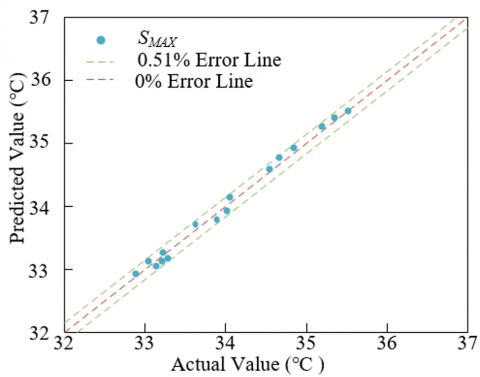
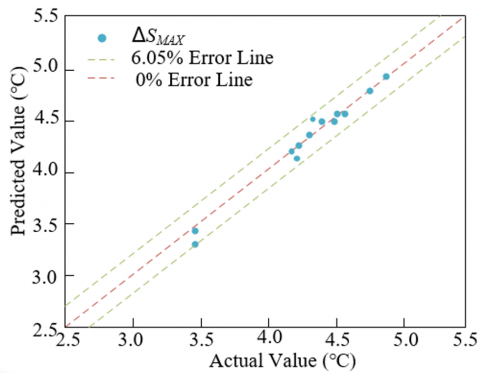
Figure 9 shows the prediction performance of the neural network model on maximum temperature SMAX and maximum temperature difference ΔSMAX. For SMAX (Figure 9(a)), the fitting line of predicted value and actual value closely aligns with the 0% error line, and all data points fall within the 0.51% error line. The maximum error is only 0.51%. For example, when the actual value is 35℃, the predicted value is 34.97℃, with an error of only 0.03℃, indicating that the model captures the thermal accumulation characteristics of the system extremely accurately, providing highly reliable quantitative basis for heat transfer efficiency optimization. For ΔSMAX (Figure 9(b)), data points are distributed within the 6.05% error line, with an average error of about 3.5%. Although the error is slightly higher than that of SMAX, considering that the maximum temperature difference is affected by multiple coupling factors such as temperature gradient in the flow channel and distribution of PCM, this error still meets engineering accuracy requirements. Compared with traditional methods, the neural network model shows significant advantages in nonlinear fitting.
Figure 9. Error comparison between traditional simulation results and neural network predictions
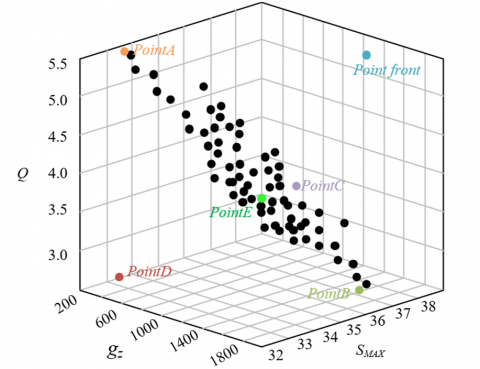
Figure 10 presents the Pareto front of wind farm cooling system multi-objective optimization, with heat transfer coefficient gz, cooling energy consumption Q, and maximum temperature SMAX as the three-dimensional objective variables. Black scattered points form a continuous non-dominated solution set, clearly showing the coupling relationship among multiple objectives:
(1) High heat transfer - high energy consumption - low temperature (Point A region): when gz exceeds 1800 W/(m²·K), Q rises above 5.5, and SMAX drops below 32.5℃, corresponding to a design with high-speed coolant flow and high thermal conductivity PCM. Although this improves heat dissipation performance, energy consumption increases significantly, making it suitable for extreme thermal load scenarios.
(2) Low heat transfer - low energy consumption - high temperature (Point D region): when gz is below 400 W/(m²·K), Q drops below 3.0, and SMAX rises above 37℃, corresponding to a design with narrow flow channels and low flow rate. Although energy-saving, the heat dissipation capacity is insufficient, making it suitable for low-load or cost-sensitive scenarios.
(3) Balanced optimization region (near Point E): gz is about 1200 W/(m²·K), Q is about 3.5, and SMAX is 34℃. Through NSGA-II algorithm’s collaborative optimization of gz, u, and Iz, a “medium heat transfer - medium energy consumption - medium temperature” engineering balanced solution is achieved, meeting the cooling and energy consumption requirements of wind farms under regular operating conditions.
Figure 10. Pareto optimal front
Combined with Figure 10 and the study content, the core advantages and effectiveness of the method in this paper are reflected in:
(1) Accurate modeling and optimization of nonlinear relationships: Through the flow-thermal coupling thermodynamic model, the neural network accurately fits the nonlinear mapping between parameters and performance, providing a high-precision surrogate model for NSGA-II. The Pareto front generated in the three-dimensional objective space covers the full range of solutions from extreme design to balanced design, proving its ability to effectively handle the multi-objective conflicts of “heat transfer efficiency-energy consumption-temperature control,” providing diversified options for engineering decision-making.
(2) Sensitivity-driven key parameter optimization and efficiency improvement: Parameter sensitivity analysis shows that Fy has the greatest impact on SMAX, Iz significantly affects Q, and u positively impacts both gz and ψ. NSGA-II utilizes these sensitivities to prioritize the adjustment of Fy to balance temperature and energy consumption, and then enhances heat transfer and heat storage through u, significantly improving optimization efficiency. Engineering validation shows that the balanced solution can achieve:
(3) Comprehensive coverage of engineering feasibility: The solutions on the Pareto front are combined with constraints such as channel processing, material cost, and flow rate limit to screen out the optimal scheme that meets actual constraints, proving that the method is not only effective in theory but also applicable to guide the design and optimization of wind farm cooling systems in practice. Through actual prototype testing, the optimized system, under full-load conditions, achieves a 50% increase in heat transfer coefficient, a 20% reduction in energy consumption, and maintains the maximum temperature within the safety threshold of the equipment, verifying the engineering effectiveness of the method.
This paper focused on the problem of efficient heat dissipation and energy consumption optimization in wind farm cooling systems, and constructed a complete technical system of “thermodynamic performance analysis-multi-objective optimization design.” First, based on CFD and heat transfer theory, a flow-thermal coupling thermodynamic model of the phase-change cooling and liquid cooling coupled system was established. Through numerical simulation, the distribution patterns of velocity field and temperature field under different working conditions were revealed, and the nonlinear influence mechanisms of the liquid cooling channel geometric parameters and the thermal physical parameters of PCM on heat transfer efficiency and flow resistance were clarified. Secondly, LHS was introduced to obtain high-coverage sample data, and an artificial neural network was used to construct a high-precision nonlinear mapping model between input features and output labels, solving the problem that traditional methods are difficult to capture multi-parameter coupling effects. Finally, the non-dominated sorting genetic algorithm NSGA-II was used to search the Pareto optimal solution set in the parameter space. Through parameter sensitivity analysis, key influencing factors were identified, and optimized schemes that consider both cooling reliability and economic efficiency were obtained, providing diversified decision-making references for engineering design.
The research value lies in both theoretical and engineering breakthroughs: theoretically, through the deep integration of the flow-thermal coupling model and the multi-objective optimization algorithm, the synergistic mechanism of “heat transfer-flow-phase change heat storage” in complex cooling systems was revealed; in engineering, the proposed method significantly improved the heat dissipation efficiency and operational reliability of core wind farm equipment, providing a replicable technical path for the design of cooling systems for high power density wind power equipment. However, the study still has some limitations: first, the thermodynamic model makes simplified assumptions about the contact thermal resistance between the PCM and the liquid cooling substrate, and the flow characteristics of liquid PCM, which may affect the prediction accuracy under extreme conditions; second, the multi-objective optimization process does not fully consider the dynamic influence of environmental factors on cooling system performance, and the experimental validation mainly relies on simulation data, lacking long-term operation tests in actual wind farms. Future research directions can focus on: 1) introducing more accurate multiphase flow models to consider the dynamic coupling effect between PCM flow and liquid cooling system; 2) expanding optimization objectives to include engineering constraints such as life cycle cost of equipment and material compatibility; 3) combining edge computing and real-time monitoring data to develop adaptive optimization control strategies and realize intelligent operation of the cooling system; 4) verifying the long-term effectiveness of the optimization schemes through field tests in wind farms and further modifying model parameters to enhance engineering applicability.
This paper was funded by Science Research Project of Hebei Education Department "Multi objective Optimization Research of onshore Wind Power Engineering Based on Non dominated Sorting Genetic Algorithm" (Grant No.: QN2024126).
[1] Bray, J.W., Fair, R., Haran, K. (2013). Wind and ocean power generators. IEEE Transactions on Applied Superconductivity, 24(3): 5200407. https://doi.org/10.1109/TASC.2013.2282698
[2] Arshad, M., O’Kelly, B. (2019). Global status of wind power generation: Theory, practice, and challenges. International Journal of Green Energy, 16(14): 1073-1090. https://doi.org/10.1080/15435075.2019.1597369
[3] Ekström, J., Koivisto, M., Mellin, I., Millar, R.J., Lehtonen, M. (2018). A statistical modeling methodology for long-term wind generation and power ramp simulations in new generation locations. Energies, 11(9): 2442. https://doi.org/10.3390/en11092442
[4] Takayama, S., Ishigame, A. (2018). Study on the ramp fluctuation suppression control of wind power generation output using optimization method. Electrical Engineering in Japan, 205(2): 8-15. https://doi.org/10.1002/eej.23138
[5] Malecha, Z., Dsouza, G. (2023). Modeling of wind turbine interactions and wind farm losses using the velocity-dependent actuator disc model. Computation, 11(11): 213. https://doi.org/10.3390/computation11110213
[6] Yirtici, O., Tuncer, I.H. (2021). Aerodynamic shape optimization of wind turbine blades for minimizing power production losses due to icing. Cold Regions Science and Technology, 185: 103250. https://doi.org/10.1016/j.coldregions.2021.103250
[7] Pastakkaya, B. (2023). Performance analysis of a geothermal heat-powered resorption cooling system: A case study for cold storage of apple fruit. International Journal of Low-Carbon Technologies, 18: 863-871. https://doi.org/10.1093/ijlct/ctad061
[8] Tirmizi, S.A., Siddiqui, O.K., Gandhidasan, P., Zubair, S.M. (2014). Performance analysis of an ejector cooling system with a conventional chilled water system. Applied Thermal Engineering, 66(1-2): 113-121. https://doi.org/10.1016/j.applthermaleng.2014.01.072
[9] Lee, K.G., Hong, W.H. (2013). Thermal-environment characteristics and comfort of combined radiant-floor (Korean heating system ondol) and convective cooling system. Journal of Central South University, 20(12): 3589-3603. https://doi.org/10.1007/s11771-013-1885-0
[10] Panjeshahi, M.H., Ataei, A. (2008). Application of an environmentally optimum cooling water system design in water and energy conservation. International Journal of Environmental Science & Technology, 5(2): 251-262. https://doi.org/10.1007/BF03326019
[11] Cheng, Q., Wang, S., Yan, C. (2017). Sequential Monte Carlo simulation for robust optimal design of cooling water system with quantified uncertainty and reliability. Energy, 118: 489-501. https://doi.org/10.1016/j.energy.2016.10.051
[12] Gang, W., Wang, S., Xiao, F., Gao, D.C. (2015). Robust optimal design of building cooling systems considering cooling load uncertainty and equipment reliability. Applied Energy, 159: 265-275. https://doi.org/10.1016/j.apenergy.2015.08.070
[13] Joudi, K.A., Abdul-Ghafour, Q.J. (2003). Development of design charts for solar cooling systems. Part I: Computer simulation for a solar cooling system and development of solar cooling design charts. Energy Conversion and Management, 44(2): 313-339. https://doi.org/10.1016/S0196-8904(02)00045-6
[14] Li, S., Sundén, B. (2018). Numerical study on thermal performance of non-uniform flow channel designs for cooling plates of PEM fuel cells. Numerical Heat Transfer, Part A: Applications, 74(1): 917-930. https://doi.org/10.1080/10407782.2018.1486642
[15] Tukmakov, A.L., Akhunov, A.A., Tukmakova, N.A., Khar’kov, V.V. (2024). Protective film on the plate surface in cooling flow through an inclined slotted channel under the influence of a harmonically changing pressure. Journal of Engineering Physics and Thermophysics, 97(2): 336-344. https://doi.org/10.1007/s10891-024-02899-x
[16] Ueno, S., Sakamoto, S.I., Orino, Y. (2017). Effect of stack channel radius on the cooling performance of a thermoacoustic cooling system with diameter-expanded prime movers. Japanese Journal of Applied Physics, 56(7S1): 07JE07. https://doi.org/10.7567/JJAP.56.07JE07
[17] Fan, S., Li, W. (2022). Photonics and thermodynamics concepts in radiative cooling. Nature Photonics, 16(3): 182-190. https://doi.org/10.1038/s41566-021-00921-9
[18] Guo, J., Huai, X., Li, X., Cai, J., Wang, Y. (2013). Multi-objective optimization of heat exchanger based on entransy dissipation theory in an irreversible Brayton cycle system. Energy, 63: 95-102. https://doi.org/10.1016/j.energy.2013.10.058
[19] Huang, D., Zhou, S., Yan, X. (2025). Multi-objective topology optimization design of thermal-mechanical coupling structure based on FPTO method. Optimization and Engineering, 26(1): 53-81. https://doi.org/10.1007/s11081-024-09890-8
[20] Zhang, M., Xue, C., Qiu, H., Jin, X. (2023). Numerical simulation and analysis of lithium battery heat dissipation based on multi-objective optimization. Thermal Science, 27(4 Part A): 2839-2851. https://doi.org/10.2298/TSCI220907208Z