Sarvar Isroil ugli Ashurmakhmatov![]() | Ergash Egamberdiyevich Kobilov
| Ergash Egamberdiyevich Kobilov![]() | Tanzila Raximovna Madjidova
| Tanzila Raximovna Madjidova![]() | Mustafo Kurbonovich Tuxtayev
| Mustafo Kurbonovich Tuxtayev![]() | Leylya Enverovna Belyalova
| Leylya Enverovna Belyalova![]() | Dilbar Sa’dinovna Yarmatova
| Dilbar Sa’dinovna Yarmatova![]() | Mansiya Yessenamanova*
| Mansiya Yessenamanova*![]()
© 2025 The authors. This article is published by IIETA and is licensed under the CC BY 4.0 license (http://creativecommons.org/licenses/by/4.0/).
OPEN ACCESS
In this study, the environmental impact of car noise in the two largest cities of Uzbekistan - Samarkand and Tashkent-was compared in depth. The main objective is to determine how factors such as the level of urbanization of different cities, traffic density, road infrastructure and industrial location affect the level of traffic noise. The study used a modern Assistant SIU 30 v3rt type noise meter at a total of 12 points (8 in Samarkand, 4 in Tashkent) with measurements of car number and noise level at 2-minute intervals of 10-15 minutes per location. During the measurements, the number of cars, maximum and average equivalent noise levels (Leq) were determined. The results showed that noise levels in Tashkent were higher, as well as a very strong correlation (R=0.97) between the number of vehicles and noise. In contrast, in Samarkand, this association is moderately strong (R=0.635), and other environmental and infrastructural factors have also been found to affect noise. The study was also carried out on the basis of international standards, while the results serve as an important basis for ensuring environmental safety, urban planning and the development of anti-noise strategies. The results showed significant differences in noise levels and their relationship to traffic between cities. The analysis confirmed an increase in the permissible noise level in residential areas, public buildings and recreation areas, especially in large cities, taking into account their specific characteristics and factors affecting the noise level. The cited correlation indicators will serve as a statistical basis for the development of noise forecasting and monitoring systems in the future by year. The facts of the article are necessary for the scientific justification of the policy of combating noise in the cities of Uzbekistan.
noise, transport, Samarkand, Tashkent, decibel, urban planning, environmental impact, traffic density
Noise pollution is one of the most significant challenges facing the world in modern times, as noise sources continue to increase due to industrial development and modern lifestyles [1]. There is an increase in noise pollution in cities, which is directly related to the increase in vehicles. The increase in traffic and the resulting traffic jams in the morning and evening, horns, as well as the movement of vehicles themselves significantly affect the health of the population. Technical and industrial enterprises are major contributors to this pollution, causing discomfort to people and negatively impacting their mental and physical health [2]. This issue also extends to the environment, affecting animals and plants. Furthermore, noise pollution is regarded as a critical environmental problem that necessitates preventive measures and solutions to control noise sources, strengthen environmental protection laws, and mitigate its consequences. Over the past few years, noise in urbanized areas has increasingly impacted human health, becoming a leading source of environmental pollution [3]. Along with a sharp increase in the pace of urbanization in the current period, the growing number of vehicles has made the problems of acoustic ecology relevant. Noise pollution is one of the most important environmental problems facing the world in modern times, as noise sources continue to increase due to industrial development and modern lifestyle. Technical and industrial enterprises contribute significantly to this pollution, causing discomfort to people and negatively affecting their mental and physical health [4]. Noise is recognized as an environmental risk that can cause serious harm to human health. Statistical monitoring in this regard is conducted regularly in developed countries such as the European Union, the United States and Japan. But in Uzbekistan, the field has not yet been sufficiently studied, there is no systematic database. As in many developing countries, the problem of noise pollution is relevant in two cities of Uzbekistan, such as Tashkent and Samarkand.
As an environmental factor, noise pollution has serious effects on people working in noisy conditions [5]. It can lead to hearing loss, headaches, reduced mental activity, various nervous system disorders (e.g., neurasthenia, neurosis, sensory impairments), peripheral nervous system diseases, exacerbation of cardiovascular issues, high blood pressure, noise-induced stress, fatigue, sleep disorders, impaired attention, and decreased labor productivity [6]. Physiological changes in the body often accompany these conditions. Therefore, it is crucial to implement preventive measures to address this issue and reduce noise pollution sources.
Noise significantly degrades the living environment in large cities [7]. A substantial portion of environmental acoustic pollution (70-90%) is attributed to road transport [8]. A distinctive feature of this type of noise is its non-periodic nature–its levels rise and fall abruptly, varying greatly in duration. The intensity of these noises often exceeds the threshold of human sensitivity, posing serious risks to health and well-being [9, 10].
The problem of noise pollution in Uzbekistan, as in many developing countries, is urgent. The main sources of noise are motor transport, industry, construction and household sources. An increase in the number of cars, an outdated fleet (many vehicles do not meet modern noise standards), poor roads and non-compliance with traffic regulations contribute to high noise levels. Businesses, especially those located near residential areas, can be a significant source of noise. Construction works, especially in densely populated areas, create a significant background noise. As well as noise from neighbors, loud music, and household appliances contribute to noise pollution.
The city of Samarkand is one of the ten most densely populated districts and cities of the Republic of Uzbekistan. As of 02/05/2025, the population of the city of Samarkand is 595.8 thousand people. The population of Tashkent city was 3,112.8 thousand people as of 01.01.2025. Among the regions, the largest number of vehicles was registered in the city of Tashkent (624,022 units), as well as in Samarkand (448,702 units). According to the statistical agency, as of January 1, 2024, according to the results of the technical inspection. These regions account for 37.6% of the total number of cars owned by the population in the Republic of Uzbekistan. Of these, the number of passenger cars amounted to 3,759 thousand units, trucks-240.9 thousand units, buses-6.3 thousand units, minibuses-9.1 thousand units, special vehicles-5.4 thousand units. The increased content of vehicles in two cities of Uzbekistan, Tashkent and Samarkand, prompted us to study possible noise pollution in these two cities and calculate the correlation between noise pollution and the number of vehicles.
Tashkent has the largest number of industrial enterprises in the country. According to the Agency for Statistics, as of February 1, 2024, a total of 68,691 industrial enterprises are operating in Uzbekistan. Most of them are concentrated in Tashkent–11,930. Ferghana region is in second place with 7,635. The Tashkent region closes the top three with 7,273, and the Samarkand region is in fourth place, with 6,065 operating industrial enterprises [11]. Since the main noise pollutants in the form of vehicles and industrial enterprises are concentrated in these two cities, we were tasked to study the noise data in these two cities and compare them to understand how much noise pollution is observed in these most densely populated cities of Uzbekistan. For the first time in Uzbekistan, traffic noise pollution of two large cities with different urbanistic conditions was compared on a scientific basis. Tashkent is the capital of Uzbekistan and the most densely populated megapolis (3.1 million people), with centralized industrial and transport systems. Samarkand is a historical and tourist center with an average level of urbanization (595 thousand people), but in recent years the number of cars has increased sharply (448 thousand cars). Tashkent has a high volume of daily car traffic; there are many industrial districts and tracks. In Samarkand, however, the roads are narrower, with a different distribution of traffic flow due to historical architecture. This directly affects the propagation and reflection of noise. If there are wide streets, high-rise buildings and modern transport routes in Tashkent; And in Samarkand, most of the urban part is represented by ancient, narrow streets and low-rise houses. Such infrastructure increases the reverberation of noise. Samarkand and Tashkent were selected for comparison due to their contrasting urban characteristics. Tashkent, as a highly urbanized capital, exhibits dense road networks, industrial zones, and intense vehicle circulation. In contrast, Samarkand features narrower streets, historical infrastructure, and moderate urban sprawl. Comparing these two cities allows a deeper understanding of how different urban environments influence traffic-related noise pollution.
According to the State Statistical Agency of the Republic of Uzbekistan on January 1, 2024: there are 3,759 million cars, 240,900 trucks, 6,300 buses, 9,100 minibuses, 5,400 special equipment, 37.6% of which belongs only to Tashkent and Samarkand. In Uzbekistan, vehicular traffic has increased dramatically in recent years, with over 4 million vehicles currently registered and over a third concentrated in just two urban centers-Tashkent and Samarkand. Despite this, there is no national-level noise monitoring network, no centralized public noise database, and no comprehensive urban acoustic mapping strategy. This results in fragmented data, limited public awareness, and a lack of evidence-based policy development. Unfortunately, there is insufficient systematic data on noise pollution in Uzbekistan. In Uzbekistan, official noise monitoring is still underdeveloped. There is no single continuous acoustic monitoring system. According to regional environmental services, in Tashkent and other large cities, noise levels often exceed 60-70 dB near busy roads, while according to regulations, levels up to 55 dB during the day and 45 dB at night are considered acceptable for residential areas. In some areas, the noise level reaches 80 dB or higher, which is comparable to the noise of a motorcycle or heavy street traffic and can cause harm to health if exposed for a long time. This study aims to fill that gap by providing structured comparative measurements of traffic noise in the country’s two most impacted cities. There are no extensive, regularly updated databases comparable to those of developed countries. This makes it difficult to accurately assess the problem and develop effective measures to address it. To solve these problems, noise measurements were carried out in this study in correlation with the number of vehicles. There are no systematic and complex noise studies in Uzbekistan. Existing research on noise pollution in Uzbek cities is limited to local, narrow-range facilities (e.g.: one street or one school suburb). No study has calculated a statistical correlation between traffic density and noise Leq levels based on inter-city comparison (inter-city comparison). This study directly addresses the current lack of comparative, statistically grounded noise pollution data across major Uzbek cities. By measuring real-time noise levels at systematically selected sites in Samarkand and Tashkent and correlating them with traffic intensity, the study fills a gap in urban environmental monitoring and provides a foundational dataset for future acoustic planning in Central Asia.
Recent studies have emphasized the growing challenges of traffic-related noise in transitional urban contexts. For example, Fallah-Shorshani et al. [12] investigated how Tehran’s dense road networks affect Leq values during peak hours, while Danilevičius et al. [13] correlated heavy vehicle density with noise levels in Lithuanian cities. These methodologies, particularly the use of Pearson correlation and short-term measurement intervals, align with our approach. However, Central Asian urban contexts-such as Samarkand and Tashkent-remain underrepresented in this field. This study aims to bridge that gap.
2.1 Study area
The measurements were conducted at 8 locations in the city of Samarkand and on 4 main roadways in the capital of the Republic of Uzbekistan, Tashkent, to perform a comparative analysis (Figure 1). Contour (place marks) of the studied area were laid out (Table 1). The vehicles passing through the city streets are all sources of noise, differing from each other in intensity. In Samarkand, measurements were taken at the following locations: University Avenue, Registan Square, Boaston Saroy Street, Registan Street, Rudakiy Street near Siyab Bazar, the Rudakiy Street tram pass, Mirzo Ulugbek Street (Gum), and University Avenue near Namazgoh Street, as well as Ja’mi Street. For the comparative analysis, streets in the capital were selected, and noise measurements were conducted on the following streets: Farobiy Street (near Beruniy station), Beruniy Street (Chorsu hotel), Sharof Rashidov Street (Independence Square), and Samarkand Gate.
(a) Samarkand
(b) Tashkent
Figure 1. Map of the Republic of Uzbekistan
Table 1. Coordinates of Samarkand and Tashkent
|
City |
Name of the Place of Study |
Coordinates of the Study |
|
Samarkand |
University alley (SamDU, Faculty of Chemistry) |
39.648608, 66.962584 |
|
Registon took the field |
39.653569, 66.975930 |
|
|
Boustonsaroy Street |
39.651386, 66.963356 |
|
|
Registon Street |
39.653509, 66.974592 |
|
|
Rudaki Street Siyab Bazar |
39.664132, 66.981316 |
|
|
Rudaki Street tram pass |
39.667536, 66.973574 |
|
|
Mirzo Ulugbek Street Gum |
39.655981, 66.957214 |
|
|
University Avenue (Prayer Street) |
39.642124, 66.957721 |
|
|
Tashkent |
Farobiy Street (next to Beruniy station |
41.345481, 69.205708 |
|
Beruni Street (Chorsu hotel) |
41.323654, 69.234967 |
|
|
Sharaf Rashidov Street (Independence Square) |
41.313685, 69.269318 |
|
|
Samarkand Gate Street |
41.320260, 69.233586 |
2.2 Methods
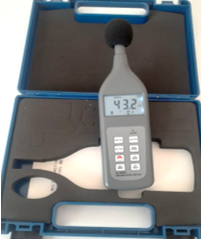
To conduct the research and determine the data, the level of urban noise sources in decibels (dB) was measured using the Alarm Sound Level Meter SL-5868P (noise meter). Noise measurements were carried out on roads with varying traffic intensity and vehicle density. The noise generated by vehicles is non-constant, with the sound level fluctuating at a given time, but the change is said to be continuous and no more than 5 dBA [14].
The Sound Level Meter instrument is calibrated after being humidified before each test. The microphone of the noise meter should be aligned in the direction from which the sound is coming. During noise measurement, it is important to determine whether the noise is constant or temporary. Measurements are taken at a distance of 7.5 meters from the traffic corridor, 1.5 meters above the ground, and 50 meters before or after traffic lights, intersections, or traffic deflections. When measuring noise, the wind speed should not exceed 1 meter per second. The noise meter should be positioned 1.2 meters away from any wall, and the person conducting the measurement should stand at a designated distance.
According to ISO 1996-2:2007 and GOST 20444-2014: In environments where noise pollution varies dynamically, 1–5-minute intervals are sufficient to obtain an average picture of the observation point (Figure 2), especially for punctual measurements. At each point, at least 3 repetitions of 2-minute measurements were performed, increasing reliability in determining statistical Leqs and Maxima. Although long-duration continuous monitoring is ideal, it is often impractical in developing urban contexts without centralized acoustic monitoring infrastructure. Therefore, this study employed multiple short-term (2-minute) measurements at peak traffic times in each location, in accordance with ISO 1996-2:2007 and GOST 20444-2014 standards. These intervals provide statistically representative snapshots of noise levels sufficient for inter-city comparison and correlation analysis.
The measurement time was selected during periods of maximum traffic intensity, both during the day and at night. The locations for measuring the noise characteristics of traffic flows were selected on straight sections of streets and highways with a steady speed of vehicles and at a distance of at least 50 m from intersections, transport areas and stops of passenger public transport. Before measuring the noise characteristics of traffic flows, meteorological conditions (wind speed, air temperature, humidity, atmospheric pressure) were determined according to official data from the meteorological service. Measurements were conducted on weekdays (Monday to Friday) during three peak periods-morning (08:00-10:00), midday (12:00-14:00), and evening (17:00-19:00). These intervals were selected to reflect high traffic activity and were consistent across all locations. Weather conditions were controlled: measurements were not conducted during rainfall or when wind speeds exceeded 1 m/s. A windscreen was used to reduce acoustic distortion caused by minor breezes.
|
|
|
|
|
Alarm Sound Level Meter SL-5868P |
Assistant SIU 30 V3RT |
Obtaining results in the research object |
Figure 2. Measurement and comparative analysis of noise sources by contours on the streets of Samarkand and Tashkent City with noise measuring instruments
During the study, noise levels were measured according to include sound pressure octave (dB) levels, sound equivalent (dBA) levels, and maximum sound (dBA) levels, as outlined in No. 23337-14 “Noise Measurement Methods in Residential, Public Buildings, and Residential Areas” (Interstate Standard). In addition, the Interstate Council for Standardization, Metrology, and Certification (MGS) used the Interstate Standard document GOST 20444-2014 “Noise: Methods for Determining Traffic Flows and Noise Characteristics” (ISO 1996-1:2003, NEQ), (ISO 1996-2:2007, NEQ), and Moscow City Standard (2015). These standards define methods for measuring noise characteristics of vehicles, as stated in GOST 17187-2010 “Volume Timers.” The methods adopted by the Interstate Council for Standardization, Metrology, and Certification (protocol No. 37 of June 10, 2010) were also applied.
In order to understand the relationship between the increase in the number of cars and noise pollution, a statistical analysis of the correlation between these indicators was carried out [15]. Correlation analysis is a statistical method that is used to estimate the strength and direction of a linear relationship between two or more variables. It shows how much variables change together and in which direction. Pearson's correlation coefficient (Pearson's r) is used to measure the linear relationship between two quantitative (continuous) variables measured on an interval or rational scale (Eq. (1)):
$r=\frac{\Sigma((x i-\bar{x})(y i-\bar{y}))}{\sqrt{\Sigma(x i-\bar{x})^2 * \Sigma(y i-\bar{y})^2}}$ (1)
where,
r is the Pearson correlation coefficient.
xi is the value of the variable X for the ith observation.
yi is the value of the variable Y for the ith observation.
$\bar{x}$ is the average value of the variable X.
$\bar{y}$ is the average value of the variable Y.
Σ is the summation symbol.
The value of the correlation coefficient:
- Correlation coefficients range from -1 to +1.
- +1: Full positive correlation. As one variable increases, the other variable also increases.
- -1: Total negative correlation. As one variable increases, the other variable decreases.
- 0: No linear correlation.
Pearson's r is the most suitable method for determining the linear relationship between two variables (car number and leq noise level) in urban cross-section. This method assesses the direct, strong or weak, positive or negative correlation between quantitative (numerical) variables of interval scale. The Pearson correlation was used in a previous international study [16] and has also been successfully applied in analyzing the relationship between noise and transport variables. Other statistical methods, such as Spearman's rank correlation and Kendall's tau, have been considered, but they are preferred in ordinal data or small selection volumes. Because our dataset has a continuous number and distribution close to normality, Pearson's r was considered the most suitable and scientifically based choice. Regression analysis has also been considered, but the goal at this stage is to determine the level of direct dependence, not to predict. Pearson's correlation coefficient was applied to assess the linear relationship between the number of vehicles and the equivalent noise level (Leq) across multiple sites. This method was chosen over alternatives (such as Spearman’s or regression analysis) due to the continuous and approximately normally distributed nature of the variables. Calculations were performed using SPSS v26.0 with raw Leq values and traffic counts recorded simultaneously at each location.
Pearson’s correlation coefficient was calculated using SPSS 26.0, based on the paired observations of vehicle count and Leq values at each measurement site. The resulting coefficients (Tashkent: r = 0.97; Samarkand: r = 0.635) indicate varying strengths of linear relationships. While this study focused primarily on linear noise-traffic relationships, future research will incorporate multivariate statistical models to assess the impact of additional variables such as vehicle speed, road surface condition, and vehicle type.
The measurements were conducted at 8 locations in the city of Samarkand and on 4 main roadways in the capital, Tashkent, to perform a comparative analysis. In Samarkand, measurements were taken at the following locations: University Avenue, Registan Square, Boaston Saroy Street, Registan Street, Rudakiy Street near Siyab Bazar, the Rudakiy Street tram pass, Mirzo Ulugbek Street (Gum), and University Avenue near Namazgoh Street, as well as Ja’mi Street.
The noise levels measured on these streets were found to exceed the standard levels. Other factors influencing the intensity of traffic noise, such as vehicle speed, the nature of the noise source (e.g., acceleration or braking), road conditions, traffic composition, and the presence of intersections, also need to be considered when assessing traffic noise in the urban area.
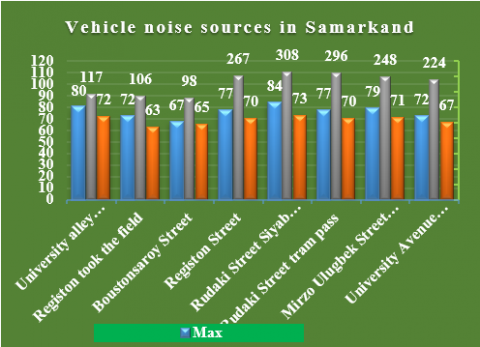
During a 2-minute noise measurement on the selected streets, it was observed that, compared to other streets, Rudakiy Street (South Market) had 308 vehicles, with a maximum noise level of 84 dB and an average equivalent sound level (Leq) of 73 dB. On Mirzo Ulugbek Street (Gum), 248 vehicles were recorded, with a maximum noise level of 79 dB and an average (Leq) of 71 dB.
In residential areas, public buildings, and recreational areas, the permissible noise level was measured based on the equivalent sound pressure level by octaves, considering day and night time. It was found that the noise level exceeded the permissible limits specified in paragraph 9 of the sanitary rules (Figure 3).
Figure 3. Noise sources and their levels on road transport at 8 points in the city of Samarkand
The noise level from vehicles is greatly influenced by factors such as road condition, the volume of traffic (i.e., how many vehicles pass in one direction within an hour), the width of the road, and the presence of greenery along the road. The unevenness of the road and the construction of multi-story buildings along narrow streets also contribute to increased noise intensity. Noise measurements in residential areas cannot be conducted during rain or when strong winds are present. If the wind speed exceeds 1 meter per second, the microphone is shielded with a screen to protect it from the wind.
The result of the correlation between the number of cars and noise in Samarkand is 0.635. This suggests that there is a moderately positive relationship between the number of cars and the noise level in Samarkand. This means that as the number of cars in Samarkand increases, the noise level also increases. Conversely, reducing the number of cars is likely to lead to lower noise levels. However, it is not absolutely strict or linear. In other words, changing the number of cars does not explain all the changes in noise levels, and other factors also affect noise levels.
Additional factors affecting noise (besides the number of cars) [17]:
Type of car: Trucks and buses usually produce more noise than passenger cars.
Technical condition of vehicles: Faulty vehicles (for example, with a faulty exhaust system) may produce more noise.
Driving style: Aggressive driving (sudden acceleration, braking, using a sound signal) increases the noise level.
Road conditions: Poor roads (with potholes and cracks) increase the noise level.
Driving speed: Higher driving speed increases the noise level.
Building density: Narrow streets with dense buildings can increase noise.
Time of day: The noise level is usually higher during peak hours.
Other sources of noise include industry, construction, public transport, and musical events.
For the comparative analysis, streets in the capital were selected, and noise measurements were conducted on the following streets: Farobiy Street (near Beruniy station), Beruniy Street (Chorsu hotel), Sharof Rashidov Street (Independence Square), and Samarkand Gate. During the 2-minute measurement period on each selected street, the number of vehicles and noise levels were recorded. On Beruniy Street (Chorsu hotel), there were 252 vehicles, with a maximum noise level of 99 dB (due to traffic) and an average (Leq) of 85 dB. On Farobiy Street (near Beruniy station), 290 vehicles were recorded, with a maximum noise level of 94.8 dB and an average (Leq) of 86 dB. The results were calculated and are shown in Figure 4.
The correlation result of 0.97 between the number of cars and the noise level in Tashkent indicates a very strong positive relationship. This means that as the number of cars in Tashkent increases, the noise level also increases significantly. Conversely, reducing the number of cars is likely to lead to a significant reduction in noise levels. The value of 0.97 is close to +1, which indicates a very strong linear relationship between the variables. This means that the number of cars is a very good predictor of the noise level in Tashkent. Most of the changes in noise levels can be explained by changes in the number of cars. Knowing the number of cars, it is possible to predict the noise level with high accuracy, and vice versa. This strong relationship highlights the need to take measures to regulate automobile traffic in Tashkent to reduce noise pollution. Urban density high: in Tashkent, the traffic flow is high, multi-storey buildings are located close to the road-this leads to the accumulation and reflection of noise. Width of tracks and junction of tracks: Here the traffic flow is stagnant and dense, and there is less variability, i.e., Leq levels are more smoothly linearly related to the number of cars. Industry and Freight Transport play a role: The abundance of trucks and heavy machinery dramatically increases the Leq value. Traffic alarm and traffic lights Range Less, which creates a more stable movement with a stable noise profile.
Figure 4. A comparative analysis of the study was carried out measuring noise on the roadways of the city of Tashkent, comparing its levels
In conclusion, the 0.635 correlation confirms that the number of cars is a significant factor influencing the noise level in Samarkand. However, when developing measures to reduce noise pollution, it is necessary to take into account other factors such as the type of car, road condition, driving style and other noise sources. A more comprehensive analysis, taking into account all these factors, will make it possible to develop more effective strategies to improve the acoustic environment in the city. Roads are narrow, there are a lot of pedestrians, markets are close-traffic flow is more stop-return noise level changing. Historical constructions reinforce the sound reflection, but it is not permanent (e.g., around Registan). Other factors also affect traffic: activities on the street, standing cars, called services. High noise does not always depend only on the number of cars, that is, there are other sources of noise.
The 0.97 correlation is a very strong argument in favor of the fact that the number of cars is a critical determinant of noise levels in Tashkent and requires priority attention when developing strategies to reduce noise pollution. Anomaly analysis based on examples: 252 cars at Beruniy Street (Tashkent) 99 dB Leq. This is higher than in other places. Reason: a large number of buses and trucks move here, standing cars play a signal, near the road there is an enterprise for the production of betonautomat. 248 cars on Mirzo Ulugbek Street (Samarkand) Leq 71 dB - less noise. Reason: here the road is wide, cars walk slowly, there is a green area nearby. The exceptionally high correlation in Tashkent (r = 0.97) can be attributed to the stable and high-volume vehicular traffic patterns typical of dense urban areas with less interruption and more homogeneous flow. In contrast, the moderate correlation in Samarkand (r = 0.635) reflects more variable traffic dynamics influenced by narrower streets, irregular movement, historical architecture, and mixed noise sources. These findings demonstrate that noise levels in urban settings are not solely dependent on traffic volume but are significantly shaped by the physical and functional characteristics of the urban environment.
The differences observed between Samarkand and Tashkent in noise levels and their correlation with traffic volume can be attributed to a complex interplay of urban design, infrastructure, and vehicle fleet characteristics. Tashkent’s wide arterial roads, high proportion of heavy vehicles, and modern traffic flow infrastructure result in more stable and continuous noise profiles, hence a stronger linear correlation. In contrast, Samarkand’s older, narrower streets, mixed land-use patterns, and pedestrian density introduce variability and discontinuity into the noise landscape, weakening the correlation with vehicular counts. These findings underscore the importance of tailoring noise mitigation strategies to the unique structural and functional features of each urban environment.
The findings from Tashkent, where Leq values showed a near-perfect linear relationship with traffic volume (r = 0.97), are consistent with previous studies such as Bazaras et al. [18] in Lithuania and Danciulescu et al. [15] in Romania [19], which reported similarly high correlations in dense urban environments. Conversely, the lower correlation in Samarkand mirrors findings from Tehran, where historical infrastructure and irregular traffic patterns reduced statistical coherence. This comparative approach adds a new regional perspective from Central Asia to the global discourse on urban acoustic ecology.
The high noise levels are primarily due to the large number of vehicles, traffic jams, car alarms, noise from car engines and tires, the tight suspension of traffic lights, and the movement of heavy trucks and diesel-engine vehicles. Noise generated on highways spreads in all directions. The traffic-related noise characteristics largely depend on the road type [20]. The noise level on a street is determined by the intensity, speed, and nature of traffic flow. In industrialized cities, heavy freight traffic contributes significantly to high noise levels. Therefore, it is crucial to identify noise sources within cities through comparative analysis and assess them using established methods [21, 22].
Recommendations: To mitigate the effects of noise on the human body, a combination of organizational, technical, and medical measures should be taken. These include:
In recent years, many cities are being rebuilt, and new cities are emerging [23]. This requires the development of modern urban planning projects and their practical implementation [24]. Proper territorial zoning, particularly in residential areas, ensures that noise from nearby sources is minimized. The creation of noise maps is essential for planning quieter, healthier environments [25].
Noise protection also includes using personal protective devices (such as earplugs) for workers exposed to high noise levels. Workers involved in noisy occupations must undergo regular medical examinations-initially every 3, 6, and 12 months after starting work, and then every 3 years. These workers should be examined by specialists such as therapists, otolaryngologists, and neuropathologists [26].
Our findings align closely with those of Bazaras et al. [18] in Lithuania, where heavy traffic corridors exhibited the strongest noise-volume correlations. Conversely, the weaker correlation found in Samarkand resembles patterns in Tehran’s historical districts [27], where narrow street geometry and pedestrian density disrupt the linearity of noise propagation. Building on these insights, we recommend city-specific interventions such as acoustic zoning in Tashkent and pedestrian-centered planning in Samarkand
Political recommendations specific to the city of Tashkent:
1. To determine the zone of the “Noisy Corridor” and direct the flow of traffic on the basis of the planned acoustic map. Specific “Red Sound Zones” are defined and temporary access restrictions to freight traffic (e.g. in the 08:00-20:00 range).
2. Discharge of heavy traffic into the Outer Ring Roads. This is done through the Tashkent Ring Road (TTZ) - a government decision is required.
3. Forcing noise-absorbing facades and roadside green fences. Introduction of acoustic insulation standards for new buildings under construction (based on existing GOST 23499).
4. Automate the traffic light range and increase the continuity of movement. This reduces noise by storing it from stop-light cycles.
Political recommendations specific to the city of Samarkand:
1. The introduction of “Quiet Zone” areas around historic centers. Registan Square, Siyab market suburb, Mirzo Ulugbek Street–temporary restriction of car traffic (on weekends).
2. Pedestrian priority area expansion is the “Pedestrian first” concept. This reduces noise by 25-30%, increases the quality of Tourism.
3. Installation of continuous acoustic monitoring stations on an urban scale to introduce noise control. In cooperation with the Ecology Committee of Uzbekistan and the SSV.
4. Inclusion of noise standards in road maintenance and leveling programs. Old asphalts and irregularities increase Leq through car vibration.
Currently, the intensity of global environmental problems is increasing by the time. We have compared the main streets of Samarkand and Tashkent alone, the impact of noise on the human organism and the environmental environment is increasing significantly, and the optimization of this issue is relevant.
In this study, the results of a comparative analysis of the environmental impact of road traffic noise sources in Samarkand and Tashkent City show that the traffic flow density in Tashkent is higher, as a result of which the noise level is significantly higher than in Samarkand. In Tashkent, industrial areas, highways and traffic jams are the main factors of noise pollution. The city of Samarkand, however, has fewer vehicles and relatively lower noise levels.
Of the selected streets in Samarkand for the study, the number of vehicles in Rudakiy Street (South Market) was 308, the noise indicator was max 84 dB, the average (Leq) was 73 dB, and for a comparative comparison of the study, the number of vehicles in Beruniy Street (Chorsu hotel) in Tashkent was 252, and the noise indicator was max 99 dB (traffic cause), and the average (Leq) was 85 dB.
Therefore, it is important to expand the green areas and regulate the flow of traffic by taking sound insulation measures in both cities. To reduce the noise in the cities of Tashkent and Samarkand, it is necessary to use more public transport and optimize car traffic.
Noise pollution is one of the most serious environmental problems of modern cities. This study is considered an important scientific work for in-depth study of the problems of acoustic ecology in urbanized areas and scientific-based planning of urban infrastructure. In order to reduce their negative consequences, it is important to take complex environmental and urbanistic measures.
Active practical recommendations-in the cross section of cities:
For Tashkent:
It is necessary to limit the movement of trucks in the central regions and transfer the route to peripheral bypass roads (through transport policy). Sound-absorbing road covers (porous asphalt) and anti-noise screens must be installed (in particular, on the streets of Beruniy and Farobiy). It is recommended to introduce lower noise public transport types (electric bus, trolleybus) in stages.
For Samarkand:
On the streets near the Historical Center, car traffic should be limited, and the pedestrian zone should be expanded.
To reduce urban noise pollution in Uzbekistan’s major cities, this study suggests targeted, city-specific strategies. For Tashkent, urban planning should focus on restricting heavy vehicle movement in residential zones, expanding the use of low-noise road materials, and promoting electric public transportation. In contrast, Samarkand would benefit from traffic calming measures in historical districts, pedestrianizing core areas, and expanding green infrastructure. These recommendations are grounded in empirical noise and traffic correlation data and can inform municipal environmental and transport policies moving forward.
To be effective, noise mitigation in Uzbekistan’s cities must be context-sensitive. In Tashkent, strategies such as heavy vehicle re-routing, mandatory soundproofing for new developments, and acoustic zoning near major arteries are critical. In contrast, Samarkand requires protection of its historic core through quiet zones, expansion of pedestrian areas, and surface smoothing projects. These targeted policy recommendations are designed to align with the specific urban and acoustic profiles of each city.
This study provides empirical evidence of traffic-related noise pollution in Uzbekistan’s two major cities, revealing a significant correlation between vehicle volume and noise intensity in Tashkent and a moderate one in Samarkand. These findings highlight the urgent need for tailored mitigation strategies, such as acoustic zoning, vehicle flow regulation, and pedestrian-friendly planning. Urban noise pollution must be recognized as a critical public health and environmental issue, especially in rapidly growing cities. Future research should incorporate seasonal and temporal variations, vehicle types, and GIS-based mapping to support integrated noise management policies. Limitations include the short measurement duration and absence of vehicle-type analysis, which should be addressed in future studies.
Further research should address seasonal and daily variations in noise levels, particularly across different climate periods in Uzbekistan. In addition, studying the acoustic impact of ongoing public transportation reforms-such as the introduction of electric buses and tramway expansions-may provide evidence-based guidance for urban transport planning. Long-term monitoring and noise mapping are also essential to develop a comprehensive, real-time understanding of noise pollution across diverse urban settings.
|
Leq |
Equivalent Level |
|
dB |
Decibel |
[1] Chepesiuk, R. (2005). Decibel hell: The effects of living in a noisy world. Environmental Health Perspectives, 113(1): A34-A41. https://doi.org/10.1289/ehp.113-a34
[2] Khan, D., Burdzik, R. (2023). Measurement and analysis of transport noise and vibration: A review of techniques, case studies, and future directions. Measurement, 220: 113354. https://doi.org/10.1016/j.measurement.2023.113354
[3] Espadaler-Clapés, J., Barmpounakis, E., Geroliminis, N. (2023). Traffic congestion and noise emissions with detailed vehicle trajectories from UAVs. Transportation Research Part D: Transport and Environment, 121: 103822. https://doi.org/10.1016/j.trd.2023.103822
[4] Ryskalieva, D., Yessenamanova, M., Syrlybekkyzy, S., Koroleva, E.G., Yessenamanova, Z., Tlepbergenova, A., Izbassarov. A., Turekeldiyeva, R. (2023). Environmental assessment of the impact of atmospheric air pollution with hydrogen sulfide on the health of the population of Atyrau, Republic of Kazakhstan. International Journal of Sustainable Development and Planning, 18(7): 2199-2206. https://doi.org/10.18280/ijsdp.180724
[5] Hahad, O., Prochaska, J.H., Daiber, A., Münzel, T. (2019). Environmental noise-induced effects on stress hormones, oxidative stress, and vascular dysfunction: Key factors in the relationship between cerebrocardiovascular and psychological disorders. Oxidative Medicine and Cellular Longevity, 11: 4623109. https://doi.org/10.1155/2019/4623109
[6] Zaneri, T., Geltner, G. (2022). The dynamics of healthscaping: Mapping communal hygiene in Bologna, 1287–1383. Urban History, 49(1): 2-27. https://doi.org/10.1017/S0963926820000541
[7] Silva, L.T., Mendes, J.F.G. (2012). City noise-air: An environmental quality index for cities. Sustainable Cities and Society, 4: 1-11. https://doi.org/10.1016/j.scs.2012.03.001
[8] Aminzadegan, S. Shahriari, M., Mehranfar, F., Abramović, B. (2022). Factors affecting the emission of pollutants in different types of transportation: A literature review. Energy Reports, 8: 2508-2529. https://doi.org/10.1016/j.egyr.2022.01.161
[9] Persinger, M.A. (2014). Infrasound, human health, and adaptation: An integrative overview of recondite hazards in a complex environment. Natural Hazards, 70: 501-525. https://doi.org/10.1007/s11069-013-0827-3
[10] Prashanth, K.V.M., Venugopalachar, S. (2011). The possible influence of noise frequency components on the health of exposed industrial workers–A review. Noise and Health, 13(50): 16-25. https://doi.org/10.4103/1463-1741.73996
[11] Radkevich, M., Mukhammadaliyeva, F., Shipilova, K., Umarova, N., Gapirov, A. (2022). Land pollution by illegal dumps in the Tashkent region. IOP Conference Series: Earth and Environmental Science, 1068(1): 012036. https://doi.org/10.1088/1755-1315/1068/1/012036
[12] Fallah-Shorshani, M., Yin, X., McConnell, R., Fruin, S., Franklin, M. (2022). Estimating traffic noise over a large urban area: An evaluation of methods. Environment International, 170: 107583. https://doi.org/10.1016/j.envint.2022.107583
[13] Danilevičius, A., Karpenko, M., Křivánek, V. (2023). Research on the noise pollution from different vehicle categories in the urban area. Transport, 38(1): 1-11.https://doi.org/10.3846/transport.2023.18666
[14] Rybakowskia, M., Dudarskia, G., Kowala, E. (2014). Research and analysis of noise emitted by vehicles according to the type of surface roads and driving speed. European Journal of Environmental and Safety Sciences, 2(2): 71-78.
[15] Danciulescu, V., Bucur, E., Pascu, L.F., Vasile, A., Bratu, M. (2015). Correlations between noise level and pollutants concentration in order to assess the level of air pollution induced by heavy traffic. Journal of Environmental Protection and Ecology, 16(3): 815-823.
[16] Leipus, L., Butkus, D., Januševičius, T. (2010). Research on motor transport produced noise on gravel and asphalt roads. The Baltic Journal of Road and Bridge Engineering, 5(3): 125-131. https://doi.org/10.3846/bjrbe.2010.18
[17] Farooqi, Z.U.R., Sabir, M., Zeeshan, N., Murtaza, G., Hussain, M.M., Ghani, M.U. (2020). Vehicular noise pollution: Its environmental implications and strategic control. In Autonomous Vehicle and Smart Traffic. IntechOpen. https://doi.org/10.5772/intechopen.85707
[18] Bazaras, J., Jablonskyte, J., Jotautiene, E. (2008). Interdependence of noise and traffic flow. Transport, 23(1): 67-72. https://doi.org/10.3846/1648-4142.2008.23.67-72
[19] Blondel, V.D., Guillaume, J.L., Lambiotte, R., Lefebvre, E. (2008). Fast unfolding of communities in large networks. Journal of Statistical Mechanics: Theory and Experiment, 2018(10): P10008. https://doi.org/10.1088/1742-5468/2008/10/P10008
[20] Wrótny, M., Bohatkiewicz, J. (2021). Traffic noise and inhabitant health—A comparison of road and rail noise. Sustainability, 13(13): 7340. https://doi.org/10.3390/su13137340
[21] Kobilov, E.E., Batirov, K.F., Ozdamirova, E.M. (2023). Urban ecosystems of Uzbekistan and ways of their ecologization. BIO Web of Conferences, 63: 03002. https://doi.org/10.1051/bioconf/20236303002
[22] Suyunov, A., Tukhtamishev, S., Suyunov, S., Manoev, S., Samankulov, S. (2023). Innovative solutions in creating noise maps in cities. In E3S Web of Conferences, 463: 02007. https://doi.org/10.1051/e3sconf/202346302007
[23] Nassiri, P., Karimi, E., Monazzam, M.R., Abbaspour, M., Taghavi, L. (2016). Analytical comparison of traffic noise indices—A case study in District 14 of Tehran City. Journal of Low Frequency Noise, Vibration and Active Control, 35(3): 221-229. https://doi.org/10.1177/0263092316660917
[24] Clark, C., Martin, R., Van Kempen, E., Alfred, T., et al. (2006). Exposure-effect relations between aircraft and road traffic noise exposure at school and reading comprehension: The RANCH project. American Journal of Epidemiology, 163(1): 27-37. https://doi.org/10.1093/aje/kwj001
[25] Khan, J., Ketzel, M., Jensen, S.S., Gulliver, J., Thysell, E., Hertel, O. (2021). Comparison of road traffic noise prediction models: CNOSSOS-EU, Nord2000 and TRANEX. Environmental Pollution, 270: 116240. https://doi.org/10.1016/j.envpol.2020.116240
[26] Vaverková, M.D., Koda, E., Wdowska, M. (2021). Comparison of changes of road noise level over a century quarter: A case study of acoustic environment in the mountainous city. Journal of Ecological Engineering, 22(1): 139-150. https://doi.org/10.12911/22998993/128863
[27] Fallah-Shorshani, M., Fruin, S., Yin, X.Z., McConnell, R., Franklin, M. (2024). Estimating near-roadway air pollution from multi-frequency noise measurements. The Science of the Total Environment, 2024: 173900. https://doi.org/10.1016/j.scitotenv.2024.173900