Chayma Farchi* | Fadwa Farchi | Badr Touzi | Ahmed Mousrij
© 2024 The authors. This article is published by IIETA and is licensed under the CC BY 4.0 license (http://creativecommons.org/licenses/by/4.0/).
OPEN ACCESS
Transportation activities have witnessed a significant increase in recent years, with industrial evolution directly impacting the pillars of sustainable development. The literature demonstrates a surge in transport activities, with, for instance, a 20% rise in environmental impact and a 15% increase in overall economic influence. Recognizing this, businesses understand the importance of developing long-term plans for road transportation, considering its substantial impact on sustainability within logistics operations. Consequently, it becomes crucial to construct decision support models capable of analyzing the sustainability of supply chain and logistics performance. Therefore, the objective of this study is to create a prediction model utilizing an Artificial Neural Network (ANN) to approximate the global multidimensional sustainable performance value of the supply chain in the context of road freight transport. This approach combines the key dimensions of sustainability, including economic, social, and environmental aspects, along with operational and stakeholder considerations, for the first time in pursuit of this goal. Prior to the machine learning phase, a minimum condition algorithm was utilized to calculate sustainable performance as an initial design step. This algorithm assigns to a dimension the lowest level among the fields within the same dimension. This study presents a unique technique for predicting the global multidimensional sustainable performance within the logistics industry, which can also be adapted for other sectors. As a result, it offers valuable insights to managers regarding strategic development options. The sustainable performance value provides an indication and quantification of a company's sustainable performance level corresponding to its adherence to and achievement of objectives.
machine learning, ANN, logistics, performance measurement system, road freight transport, supply chain sustainability
Structured sustainable performance assessment helps organizations identify areas for improvement and the necessary professional development and training. This is particularly relevant for full activity integration, long-term planning, and integrated decision-making.
Implementing a sustainable strategy in the supply chain promotes the emergence of new distribution models aligned with sustainable development's three pillars. The growing concern for sustainable change has made sustainability a global trend in economic activities.
Transportation plays a significant role in logistics and the supply chain. However, product transportation has both positive and negative impacts on corporate profitability due to noise and environmental pollution. Transportation procedures have significant environmental consequences. The increase in transportation, driven by global commerce volume and fossil fuel use, has severely impacted the environment. The rise in transportation raises concerns about environmental degradation and the need for protection [1, 2]. Global transportation activity has surged due to increasing trade, urbanization, and population growth. This spike in transportation volume significantly contributes to greenhouse gas emissions, primarily from fossil fuel combustion in vehicles. Transportation accounts for a substantial portion of global emissions, notably around 28% in the United States. Urgent action is needed to implement sustainable transportation strategies to mitigate environmental degradation and combat climate change. Additionally, social factors for employees must be considered. Sustainability comprises economic, environmental, and social components [3]. In the transportation industry, decision-making should consider these three aspects. The central issue is to create an efficient and sustainable transport system that maximizes positive impacts while minimizing negative environmental consequences. Controlling and monitoring indicators through performance measurement systems (PMS) is essential.
Many works focus on the evolution of sustainable performance in the logistics sector. To compile these works, we conducted a systematic literature review using keywords such as PMS, evolution of sustainable performance in logistics, machine learning, and logistics. This paper is a continuation of our previous communication [4], providing details on article selection, inclusion and exclusion criteria, and relevant models from the literature. While most works focus on a single dimension of sustainable development, as the analyzed models fail to account for the dimensions encompassed in our performance measurement system, which typically address only one or two dimensions of sustainable development without integrating the remaining dimensions relevant to sustainability, several articles emphasize the need to integrate the operational dimension in assessing logistics performance's sustainability. Agyei-Owusu et al. [5] highlight the close relationship between supply chain sustainability and the operational aspect, while Tseng et al. [6] argue that the assessment of all three dimensions of sustainability is meaningful when the operational dimension is included. Similarly, the integration of stakeholders in assessing the sustainability of a supply chain is a research gap. Khosravi and Izbirak [7] argue that the social dimension cannot be dissociated from other dimensions independent of stakeholders, and Butzer et al. [8] emphasize the importance of integrating stakeholders as a separate dimension in evaluating a supply chain. In response to the identified challenge, a viable solution entails the development of a sophisticated performance measurement framework that integrates all pertinent dimensions of sustainability. This framework system should encompass economic, social, environmental, operational, and stakeholder dimensions, offering a comprehensive evaluation of sustainable performance. By adopting such an approach, organizations can gain deeper insights into their overall sustainability endeavors and make informed decisions to drive positive change.This paper aims to introduce a new performance model that goes beyond the conventional assessment framework based on the three fundamental dimensions of sustainable development. Our goal is to develop a comprehensive framework capable of evaluating performance across a wider spectrum of sustainability criteria. By expanding the traditional boundaries, our contribution seeks to redefine how sustainable performance is measured and understood. This effort represents a significant advancement in the field, promising to enhance the precision of performance evaluation methodologies within the context of sustainable development.
The objective of this paper is to contribute to the development of a performance measurement system for the logistics sector. The proposed system is based on supervised machine learning and aims to measure global multidimensional performance by evaluating the five dimensions: economic, social, environmental, operational, and stakeholder. We selected these dimensions through a systematic review of the literature, which justifies their inclusion in the paper. The program includes a learning phase, where the machine is trained on a significant portion of observations in the consolidated database, and a test phase, where output values are estimated based on input elements.
The article's structure is as follows: Section 2 highlights models for evaluating sustainable performance in the logistics chain. Section 3 presents our approach to predicting multidimensional sustainable performance. Section 4 provides detailed information on the main performance results obtained. Finally, in Section 5, we conclude the article with a discussion and suggestions for future work.
This subsection provides an overview of the existing sustainable performance measurement systems in logistics management. The literature offers various models and systems for measuring sustainable performance in logistics. However, only models that utilize machine learning, employing methods such as neural networks, random decision forests, XGBoost, etc., were considered for potential comparison in terms of originality and performance. The specific applications of these models are detailed in Table 1 below, which allows for identifying the most commonly used methods in logistics.
Table 1. Machine learning models for the logistics sector
|
Reference |
Title |
Methods |
|
[9] |
Supervised machine learning algorithms for measuring and promoting sustainable transportation and green logistics |
Decision trees Discriminant analysis the nearest neighbour support vector machine |
|
[10] |
Profit margin prediction in sustainable road freight transportation using machine learning |
Random forest XGBoost Robust Regression |
|
[11] |
A freight inspection volume forecasting approach using an aggregation/disaggregation procedure, machine learning and ensemble models |
Artificial neural networks Bayesian regularization Aggregation/disaggregation Time series inspection |
|
[12] |
Modeling and prediction of freight delivery for blocked and unblocked street using machine learning techniques |
Artificial neural network Support vector machine |
|
[13] |
Inventory management and cost reduction of supply chain processes using AI based time-series forecasting and ANN modeling |
Artificial neural network |
|
[14] |
Applying a random forest method approach to model travel mode choice behavior |
Random forest |
|
[15] |
Energy consumption forecasting in agriculture by artificial intelligence and mathematical models |
Support vector machine |
|
[16] |
Using artificial neural network for predicting and controlling the effluent chemical oxygen demand in wastewater treatment plant |
Artificial neural network |
|
[17] |
A paired neural network model for tourist arrival forecasting |
Neural network |
|
[18] |
Mobile demand forecasting via deep graph-sequence spatiotemporal modeling in cellular networks |
Deep learning |
|
[19] |
Customer demand prediction of service-oriented manufacturing using the least square support vector machine optimized by particle swarm optimization algorithm |
Support vector machine |
|
[20] |
Statistical modeling and prediction for tourism economy using dendritic neural network |
Neural network |
|
[21] |
A data mining based method for route and freight estimation |
Naive bayes multinomial updatable |
|
[22] |
Container sea-rail transport volume forecasting of Ningbo port based on combination forecasting model |
Artificial neural networks |
|
[23] |
Short-term load and wind power forecasting using neural network-based prediction intervals. |
Neural network |
|
[24] |
Demand forecasting of perishable farm products using support vector machine |
Support vector machine |
|
[25] |
Application of artificial neural networks and fuzzy logic methods for short term load forecasting |
Artificial neural network |
|
[26] |
A sparse gaussian process regression model for tourism demand forecasting in Hong Kong |
Gaussian process |
|
[27] |
SVR with hybrid chaotic genetic algorithms for tourism demand forecasting |
Support vector regression |
|
[28] |
Long term electricity demand forecasting in Turkey using artificial neural networks |
Artificial neural network |
|
[29] |
An intelligent simulation method based on artificial neural network for container yard operation |
Fuzzy-based artificial neural networks |
A thorough analysis of the literature reveals a scarcity of studies that combine the concept of machine learning with the quantification of overall sustainable performance. Many models discussed in the literature focus on a single dimension of sustainable development (social, environmental, or economic) or one of its components, lacking a comprehensive approach that evaluates all dimensions and components simultaneously.
This selection allowed us to define the most commonly used methods in terms of sustainable performance evaluation in logistics. The artificial neural network represents, for its various virtues, the most used and frequent method in the literature in various logistics applications.
We conducted this analysis to determine the most commonly used method in the literature to justify its use in what follows. Besides, our work focuses on developing a model based on the multilayer perceptron (MLP) due to its distinct advantages over other prediction methods, such as XGBoost and Random Forest. Neural networks, particularly MLPs, are adept at capturing complex patterns and relationships within data, making them well-suited for the intricate nature of sustainable performance prediction. Their ability to learn from labeled data and adapt to nonlinear relationships is particularly beneficial in the context of sustainable development. Moreover, MLPs can efficiently handle large volumes of data, providing robust predictions crucial for informed decision-making in sustainability initiatives. Therefore, our decision to employ an MLP model underscores our commitment to harnessing advanced machine learning techniques to enhance the accuracy and depth of sustainable performance prediction.
The paper introduces a novel performance measurement system that incorporates five distinct dimensions (social, economic, environmental, operational, and stakeholder) and three constraints (difficulty, duration, cost) to reflect the practical circumstances under which the performance levels of these dimensions are achieved as shown in Table 2. The rationale behind selecting these elements will be discussed in subsequent sections.
Our measurement system utilizes the minimum conditions algorithm to calculate the overall value of multidimensional sustainable performance. Each dimension comprises five fields, capable of accommodating an indefinite number of indicators depending on the specific case. Consequently, the system enables the determination of the comprehensive level of sustainable performance for any organization, irrespective of its industry. Its dimensional nature stems from its primary reliance on the five chosen dimensions.
To assess the robustness of this performance measurement system, further investigation will be conducted through a generalization approach. This involves developing a supervised machine learning model, utilizing an artificial neural network, to predict the overall value of multidimensional sustainable performance. The model will be trained using input data (dimensions and constraints) and output data (multidimensional sustainable performance) from the measurement system.
3.1 Development of the measurement system
3.1.1 Dimensions and constraints
The approach employed in developing the performance measurement system involved initially defining the dimensions to be evaluated prior to data collection and testing.
A systematic literature review guided us in selecting the dimensions as the primary inputs for our performance measurement system. It is crucial for a performance measurement system to rely on well-defined metrics derived from objective parameters to ensure its effectiveness.
Given the core objective of quantifying sustainability in the supply chain, the system's development necessitated the integration of the three fundamental pillars of sustainable development: economic, social, and environmental, aligning with the Triple Bottom Line approach.
Furthermore, advancing the sustainable development approach requires the engagement of all stakeholders who strive to attain specific performance levels. However, the expectations of these stakeholders regarding the supply chain are often overlooked. To address this gap, we incorporated a dedicated dimension that considers the sustainable supply chain from the stakeholders' perspective.
The importance of involving all stakeholders when assessing performance is underscored by Butzer et al. [8], who developed a novel performance evaluation system for international supply chains based on the balanced scorecard approach. Khosravi and Izbirak [7] established that the social dimension can only be comprehensively examined when linked to the dimension concerning stakeholders within the studied supply chain activity.
Agyei-Owusu et al. [5] affirmed the close relationship between the supply chain and the operational dimension, which deserves significant emphasis during performance analysis. Similarly, Tseng et al. [6] argued that sustainable supply chain management performance necessitates considering the relationships and inter-relationships among the traditional dimensions of sustainable development (economic, social, environmental) and the operational dimension.
In general, to ensure the sustainability of any activity, a vision and corporate strategy are indispensable. However, their implementation is equally critical. Concrete objectives in the long term, guided by an applied strategy, have implications for day-to-day activities managed operationally in alignment with current management practices. Recognizing this complementary aspect of strategy, we deemed it essential to integrate an operational dimension into the measurement system.
To evaluate the conditions and circumstances under which different performance levels are achieved, we enriched the system with achievement-oriented constraints. Specifically, for the case under study, the added constraints include what is shown in Table 2.
Table 2. Model constraints
|
Difficulty |
Judgment is given in terms of difficulty level in achieving dimensional performance levels. |
|
Duration |
Rating of the time margin required to reach a performance level (short, medium, long, ...). |
|
Cost |
Budgetary resources are involved in different actions related to fields and dimensions. |
3.1.2 Fields
After establishing the dimensions, the next step involved identifying the appropriate fields (sub-dimensions) for each dimension that align with their nature and purpose.
To accomplish this, we conducted an extensive review of relevant literature articles and sought expert opinions from industry professionals. This comprehensive analysis enabled us to pinpoint the most significant fields within the realms of sustainable development (economic, social, and environmental dimensions), operational activities (operational dimension), and transparency (stakeholders dimension). Our selection of fields was influenced by various considerations of importance and causality.
In Table 3, we present the fields chosen for this study along with their respective designations.
Table 3. Model Fields
|
Dimension |
Codes |
Fields |
References |
|
Environmental |
ENV1 |
Air pollution |
[30] |
|
[31] |
|||
|
[32] |
|||
|
ENV2 |
Water and soil pollution |
[33] |
|
|
[34] |
|||
|
[35] |
|||
|
[36] |
|||
|
ENV3 |
Energy consumption |
[37] |
|
|
[38] |
|||
|
[39] |
|||
|
[40] |
|||
|
ENV4 |
Waste and recycling |
[41] |
|
|
[42] |
|||
|
[43] |
|||
|
ENV5 |
Hazardous waste |
[44] |
|
|
[45] |
|||
|
[46] |
|||
|
Social |
SOC1 |
Security & Safety &Health |
[47] |
|
[48] |
|||
|
[49] |
|||
|
SOC2 |
Training and awareness |
[50] |
|
|
[51] |
|||
|
[52] |
|||
|
SOC3 |
Cohesion, equity, justice |
[53] |
|
|
[54] |
|||
|
[55] |
|||
|
SOC4 |
Air quality |
[56] |
|
|
[57] |
|||
|
[58] |
|||
|
SOC5 |
Noise pollution |
[59] |
|
|
[60] |
|||
|
[61] |
|||
|
Economic |
ECO1 |
Wealth creation |
[62] |
|
[63] |
|||
|
ECO2 |
Financial exchange with external stakeholders |
[64] |
|
|
[65] |
|||
|
[66] |
|||
|
ECO3 |
Financial contribution to its environment |
[67] |
|
|
[68] |
|||
|
[69] |
|||
|
ECO4 |
Innovations in commercial offers |
[70] |
|
|
[71] |
|||
|
ECO5 |
Cost of delay |
[72] |
|
|
[73] |
|||
|
[74] |
|||
|
Operational |
OP1 |
Logistics cost |
[75] |
|
[76] |
|||
|
[77] |
|||
|
OP2 |
Collaborative logistics |
[78] |
|
|
[79] |
|||
|
[80] |
|||
|
OP3 |
Efficiency and flexibility |
[81] |
|
|
[82] |
|||
|
[83] |
|||
|
OP4 |
Delivery reliability and reactivity |
[84] |
|
|
[85] |
|||
|
[86] |
|||
|
OP5 |
Customer satisfaction |
[87] |
|
|
[88] |
|||
|
[89] |
|||
|
Stakeholders |
STA1 |
Governance: Management team / Decision-makers |
[90] |
|
[91] |
|||
|
STA2 |
Visibility and transparency of the Supply Chain |
[92] |
|
|
[93] |
|||
|
STA3 |
Strategic agreement of stakeholders and interested parties |
[94] |
|
|
[95] |
|||
|
STA4 |
Satisfaction with the collaboration of the Supply Chain |
[96] |
|
|
[97] |
|||
|
STA5 |
Interest in sustainability |
[98] |
|
|
[99] |
3.2 Minimum condition algorithm
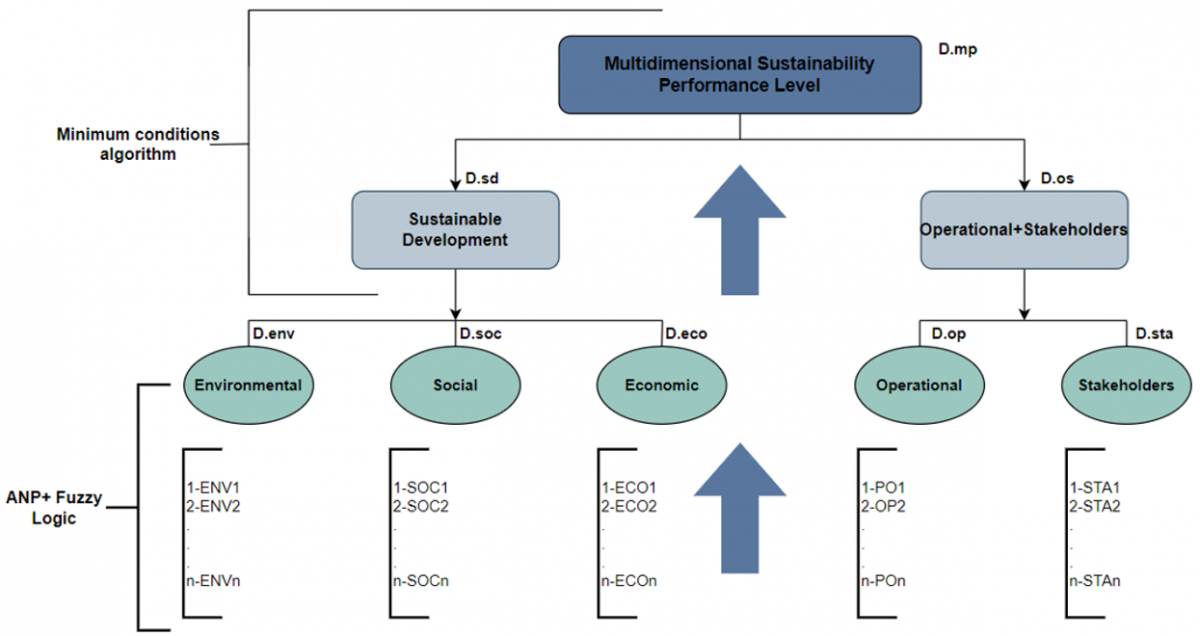
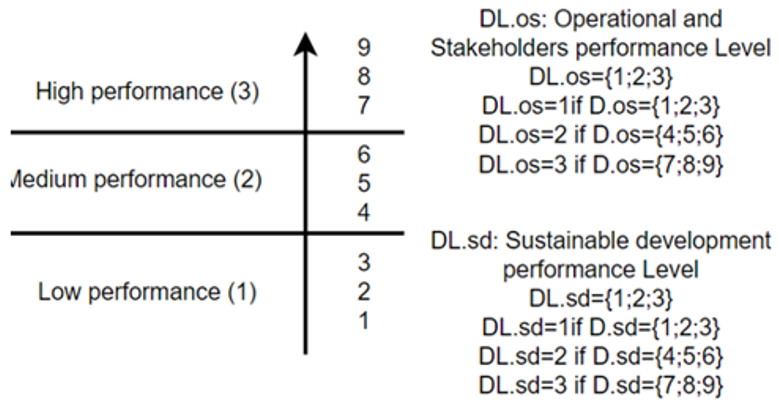
As explained above, our performance measurement system calculates the overall multidimensional sustainable performance value through the application of the minimum conditions algorithm which assigns to each dimension the minimum value of the fields contained in the same dimension (Figure 1). This value represents the performance level of the given dimension as shown in Figure 2.
The steps through which the algorithm passes can be summarized as follows:
(1) Determination of field performance: Within each dimension, assign a score ranging from 1 to 9 to each field until all five fields are scanned.
(2) Scoring the dimensions: For each dimension, assign a score from 1 to 9 based on the minimum scores of the fields contained in each dimension. The dimensional performance (the performance of the dimension under study) will be equal to the minimum value of the fields contained in the same given dimension.
(3) Comparison of dimensional performance:
(a) Sustainable development performance D.sd: Minimum dimensional performance value.
D.sd=Min (economic dimensional performance, environmental dimensional performance, social dimensional performance)
(b) Operational performance+stakeholders D.os: Minimum dimensional performance value.
D.os=Min (operational dimensional performance, stakeholder dimensional performance)
(4) Determination of levels performance D.sd & D.os.
(5) Determining the sustainable multidimensional performance D.mp:
D.mp= Min performance level (D.sd, D.os).
The quantification of the constraints is done in the same way and using the same minimum conditions algorithm.
D.mp’= Min performance level (D.sd, D.os, D.c).
The output values result from the direct application of the minimum algorithm condition, postulating that a global level of performance (output) is only reached when all the inputs have validated it.
The minimum condition algorithm includes three main performance levels where a scale from 1 to 9 is adopted Figure 3. As a result, the output performance level is equal to the level of the smallest score allocated to the dimensions.
For a better understanding of the algorithm and its application, Table 4 includes a set of scenarios explaining its use.
Figure 1. Performance calculation levels
Figure 2. Assessment scale adopted
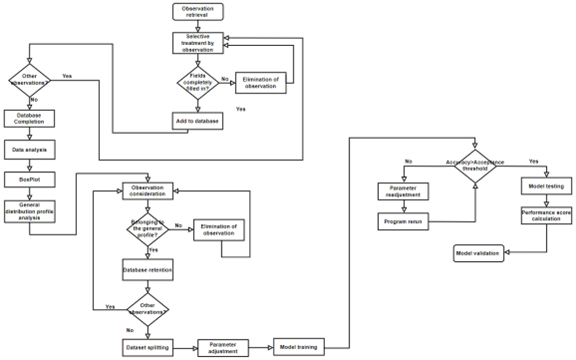
Figure 3. Flowchart on the methodology followed in the model development
Table 4. Fields scoring
|
Fields |
Scenarios |
||||||
|
S1 |
S2 |
S3 |
S4 |
S5 |
S6 |
S7 |
|
|
ENV1 |
8 |
9 |
8 |
8 |
5 |
5 |
9 |
|
ENV2 |
7 |
9 |
8 |
9 |
4 |
5 |
8 |
|
ENV3 |
6 |
9 |
7 |
9 |
6 |
4 |
6 |
|
ENV4 |
7 |
9 |
6 |
8 |
5 |
6 |
5 |
|
ENV5 |
8 |
9 |
6 |
9 |
5 |
6 |
5 |
|
SOC1 |
9 |
8 |
6 |
7 |
6 |
5 |
6 |
|
SOC2 |
6 |
9 |
7 |
8 |
6 |
4 |
7 |
|
SOC3 |
8 |
9 |
9 |
7 |
4 |
4 |
9 |
|
SOC4 |
5 |
8 |
9 |
7 |
5 |
5 |
6 |
|
SOC5 |
6 |
9 |
8 |
8 |
4 |
5 |
6 |
|
ECO1 |
7 |
8 |
7 |
8 |
4 |
4 |
6 |
|
ECO2 |
6 |
8 |
7 |
7 |
5 |
5 |
7 |
|
ECO3 |
6 |
8 |
7 |
8 |
5 |
5 |
5 |
|
ECO4 |
7 |
9 |
8 |
7 |
4 |
6 |
6 |
|
ECO5 |
7 |
9 |
7 |
9 |
6 |
5 |
6 |
|
OP1 |
6 |
9 |
7 |
9 |
6 |
5 |
6 |
|
OP2 |
9 |
9 |
7 |
7 |
7 |
4 |
7 |
|
OP3 |
8 |
9 |
7 |
9 |
5 |
4 |
5 |
|
OP4 |
6 |
9 |
8 |
7 |
5 |
5 |
8 |
|
OP5 |
7 |
9 |
7 |
9 |
6 |
6 |
6 |
|
STA1 |
8 |
9 |
9 |
7 |
6 |
6 |
6 |
|
STA2 |
6 |
9 |
8 |
7 |
4 |
6 |
7 |
|
STA3 |
7 |
8 |
7 |
8 |
6 |
4 |
6 |
|
STA4 |
6 |
8 |
8 |
8 |
6 |
4 |
6 |
|
STA5 |
7 |
9 |
8 |
9 |
4 |
6 |
8 |
|
Difficulty |
6 |
9 |
8 |
8 |
5 |
8 |
7 |
|
Duration |
6 |
8 |
7 |
8 |
7 |
8 |
6 |
|
Cost |
8 |
9 |
8 |
9 |
6 |
7 |
8 |
Table 5. Multidimensional sustainable performance calculation
|
|
S1 |
S2 |
S3 |
S4 |
S5 |
S6 |
S7 |
|
Economic dimension |
6 |
9 |
6 |
8 |
4 |
4 |
5 |
|
Social dimension |
6 |
8 |
6 |
7 |
4 |
4 |
6 |
|
Environmental dimension |
6 |
8 |
7 |
7 |
4 |
4 |
5 |
|
D.sd |
6 |
8 |
6 |
7 |
4 |
4 |
5 |
|
Operational dimension |
6 |
9 |
7 |
7 |
5 |
4 |
5 |
|
Stakeholders dimension |
6 |
8 |
7 |
7 |
4 |
4 |
6 |
|
D.os |
6 |
8 |
7 |
7 |
4 |
4 |
5 |
|
D.c |
6 |
8 |
7 |
8 |
5 |
7 |
6 |
|
D.mp |
2 |
1 |
2 |
1 |
2 |
2 |
2 |
The last row of Table 5 gives us the performance level of the seven fictitious scenarios. Different dimensional performances can lead to the same level of multidimensional sustainable performance which corresponds to the lowest dimensional level. This implies that a dimension can only achieve a level of performance if all its fields are at or above that level of performance.
3.3 Generalization of the performance measurement system
To study the robustness of our performance measurement system and to examine its ability to remain unperturbed by small changes in the data or the parameters, we generalized the system into a supervised machine learning model and analyzed its performance. This generalization was the subject of the development of a multidimensional sustainable performance value prediction model based on neural networks. The purpose of this section is to design, if the model is sufficiently robust, an application that will directly return the multidimensional sustainable performance value that can define the level of performance of a company.
The prediction of output values (multidimensional sustainable performance) results from training the model on the data that emanates from the application of the minimum conditions algorithm. The methodology of this part is based on supervised machine learning techniques for the assessment of sustainability through a set of fields that have been grouped by fields forming the dimensions. Once the database has been consolidated, its content has been processed before applying the methods, training the model, and testing it. The flowchart below shows in detail the approach followed throughout the development of the model and thoroughly explains the taken steps.
3.3.1 Data selection and preparation
(1) Primary database
The database was meticulously compiled after conducting a comprehensive survey in collaboration with a prominent Moroccan freight forwarder situated in Tangier. Through this collaborative effort, data from a total of 43 road journeys, spanning various cities across the kingdom, was systematically collected and integrated into the database., with varying routes, durations, and transportation conditions. Affiliated experts have rated on a scale of 1 to 9 the estimated and projected values that relate to the eight inputs of our multidimensional performance measurement system applied to logistics for road freight transport in the current study.
The company operating in the transport sector with which we conducted this study has a dashboard containing several fields to which it assigns different scores. Our primary work has been to collect the data, prepare it, and clean it before starting any processing or calculation. Once this database was ready, we applied the minimum condition algorithm and arrived at the values for each dimension in the various studied scenarios. The system admits as main inputs 5 dimensions: economic, social, environmental, operational, and stakeholder. which have three implementation constraints whose difficulty, duration, and cost guarantee a certain level of performance. The census of all these data made it possible to establish a solid database containing more than 27,000 observations.
(2) Data processing
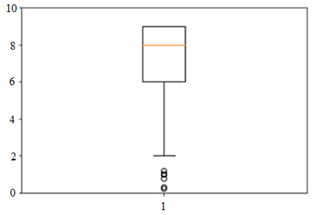
The database was therefore subjected to processing to eliminate any outliers as shown in Figure 4, which are defined as data points that lie significantly away from the rest of the distribution, that could potentially distort the machine learning. To check the normality of the data, we used the boxplot to visualize the centers and identify the general profiles of the statistical distributions of each parameter contained in the system.
An outlier in distribution is a number that is more than 1.5 times the length of the box away from the lower or upper quartile. Specifically, if a number is less than Q1-1.5×IQR or greater than Q3+1.5×IQR, then it is an outlier. The interquartile range (IQR) is a measure of statistical dispersion, being equal to the difference between the third quartile (Q3) and the first quartile (Q1).
Once the general distribution profile was identified, we proceeded to eliminate all outliers that could distort or bias the performance of the model. They also set aside observations whose fields are not filled in. This allows the model to train under the most realistic circumstances.
Figure 4. Boxplot example (1st input)
3.3.2 Model’s development
The learning algorithm predominantly relies on an artificial neural network of the back-propagation multilayer perceptron architecture, characterized by interconnected layers of neurons. Neural networks stand out as one of the most extensively employed supervised techniques across diverse domains, with particular prominence in forecasting variables pertinent to the supply chain, as evidenced by the findings outlined in Table 1. The multilayer perceptron structure facilitates the network's ability to learn complex patterns and relationships within the data, rendering it highly suitable for predictive modeling tasks within the realm of supply chain management.
Artificial neural networks [100] are biologically-inspired computational models formed from hundreds of individual units (artificial neurons) connected to coefficients (weights) that form a neural structure. They are also called processing elements (PEs) because they process information. Each PE has weighted inputs, a transfer function, and an output. PE is basically an equation that balances inputs and outputs. ANNs are also called connectionist models because the connection weights represent the memory of the system.
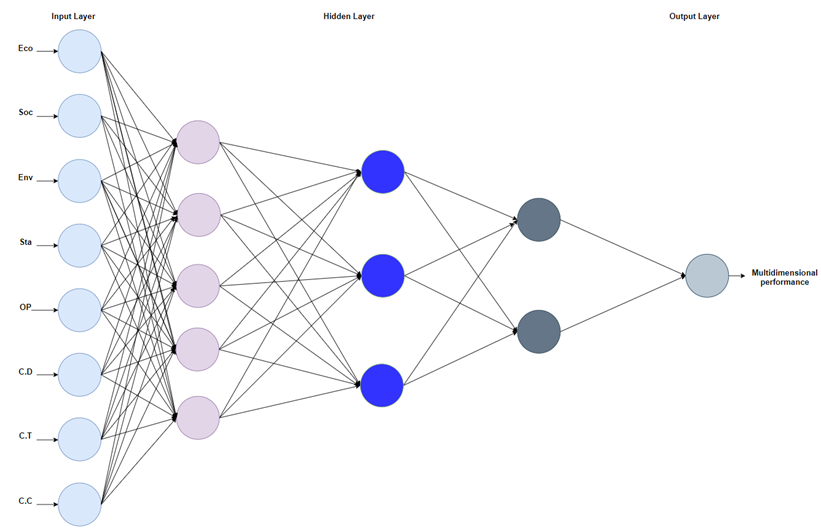
In this study, multiple trials (different artificial networks) leading to different global multidimensional performances allowed the final choice of the type of neural network as well as the number of its hidden layers by retaining the networks with the best accuracy. We finally built a neural network comprising six hidden layers, each of which includes a certain number of neurons. Figure 5 below illustrates the final network based on the model of supervised machine learning for multidimensional global performance prediction applied to logistics.
Figure 5. Neural network adopted
(1) Forward propagation
Along with this propagation, the input data is routed forward through the network until it reaches the output. Each hidden layer accepts input data, processes it according to the activation function, and passes it to the next layer.
To create an output, the input data must only be entered directly. The data must not circulate in the other way while the output is being formed, or else a cycle will occur and the output will never be generated. These network setups are known as network feed-forward configurations. Forward propagation is aided by the feed-forward network. Table 6 below details the accuracy values returned by applying a forward propagation neural network algorithm.
Executing the algorithm working with only the forward propagation returns average precisions oscillating between 49.31% and 52.81% which are not very strong to be able to validate the model completely.
Table 6. Mean accuracies per test
|
Test |
Mean Accuracy |
|
N°1 |
50.9% |
|
N°2 |
50.34% |
|
N°3 |
49.31% |
|
N°4 |
52.81% |
|
N°5 |
51.03% |
(2) Backward propagation
Backward propagation is a method generally used to adjust or correct weights and biases to achieve a minimized cost or loss function. The algorithm thus converges better by going from the output to the hidden layer.
Mathematically, the weights of the hidden layer, which is closest to the output layer, are modified, and the loss is then recalculated. If the error is still to be reduced, the process repeats in the same order, getting closer and closer to the input layer. This is done using "gradient descent," which is an optimization algorithm that calculates the local minimum of a function as the iterations follow one another. In machine learning, gradient descent is most often used to minimize a cost function. Indeed, a cost function, or "lost function," is a function that determines whether a model can make good predictions for a data set or not. At the end of the forward propagation, the model is also trained in the direction of the forward propagation to recalculate the accuracy. The results are shown in Table 7.
Table 7. Mean Accuracies per test
|
Test |
Mean Accuracy |
|
N°1 |
66.01% |
|
N°2 |
69.12% |
|
N°3 |
69.95% |
|
N°4 |
71.93% |
|
N°5 |
64.46% |
The combination of backward propagation with forward propagation allows a considerable increase in terms of model accuracy. The machine learns noticeably better by going in both directions of propagation
(3) Activation Function
The activation function is a function that decides whether or not a neuron is activated by calculating the weighted sum and adding a bias. The purpose of the activation function is to introduce nonlinearity into the output of a neuron.
Without an activation function, a neural network is just a linear regression model. The activation function transforms the input in a nonlinear manner, allowing it to learn and accomplish more difficult tasks. Many activation functions exist; the most commonly used are:
1) Linear function is a straight-line function where the activation is proportional to the input which translates into a situation of proportionality. It can be written in the form of the following equation.
$f\left( x \right)=ax+c$ (1)
where, a is the slope of the line and y-intercept is held by the variable b.
2) Sigmoid function plotted in the form of an “S” shaped graph, it is differentiable and represents the distribution function of the logistic law.
$f\left( x \right)=\frac{1}{1+{{e}^{-x}}}$ (2)
3) Tanh function or hyperbolic tangent results in higher values of gradient during training and higher updates in the weights of the network.
$tanh:~\mathbb{C}\backslash ~i\pi ~($ℤ+$\frac{1}{2}$) (3)
$Z\to \frac{\sinh (z)}{cosh\left( z \right)}$ (4)
where, sinh is the hyperbolic sine function and cosh is the hyperbolic cosine function.
Generally, the hyperbolic tangent function can be expressed using the exponential function:
$Tanh~\left( z \right)=\frac{{{e}^{z}}-{{e}^{-z}}}{{{e}^{z}}+{{e}^{-z}}}$ (5)
4) RELU or Rectified Linear Unit function that directly returns the input when positive. Otherwise, zero.
For any real x:
$f\left( x \right)=max\left( 0,x \right)$ (6)
5) Softmax function which transforms a real vector into a probability vector. It is most often used in the final layer of a classification model, especially for multiclass problems. In the Softmax function, each vector is treated independently.
$\sigma :~\mathbb{R}\to {{\left( 0,1 \right)}^{K}}$ (7)
Is defined when {\displaystyle K} KKKNKHKK, the number of classes in the multi-class classifier, is greater than one by the formula:
$\sigma {{\left( {\vec{z}} \right)}_{i}}=\frac{{{e}^{zi}}}{\mathop{\sum }_{j=1}^{K}{{e}^{zj}}}$ (8)
$\vec{z}$ being the input vector to the Softmax function, ${{e}^{zi}}$ the elements of the input vector, and $\underset{j=1}{\overset{K}{\mathop \sum }}\,{{e}^{zj}}$ the normalization term.
Taking into account the distribution and the values of the outputs contained in the dataset, the sigmoid function constitutes the best choice of the activation function as represents Table 8. To avoid biasing the model, all the functions mentioned above have been tested with different accuracy levels. These results, confirming our expectations, have reinforced our choice of function.
Table 8. Average accuracies depending on the activation functions
|
Activation Function |
Average Accuracy |
|
Linear function |
53% |
|
Sigmoid function |
94.17% |
|
Tanh function |
88% |
|
RELU |
86.3% |
|
Softmax function |
77% |
Based on the returned values, the activation function resulting in the best performance score is the sigmoid function.
(4) Cross-validation
Cross-validation is, in machine learning, a technique for evaluating and estimating the reliability and predictive accuracy of models. It aids in the creation of folds by dividing the data into multiple training and test groups, as well as in the comparison and selection of models in applied machine learning. Therefore, when a model is trained on labeled data, it is hypothesized that it must also work on new data.
In the algorithm, we split the data into five folds. after having tried several possible associations among the variables of the parameters until retaining the best combination. In general, the settings adopted were in Table 9 as follows:
Table 9. Values setting
|
Settings |
Values |
|
n-fold |
5 |
|
l_rate |
0.01 |
|
n_epoch |
8991 |
|
n_hidden |
6 |
The raised impact of the number of hidden neuron layers and epochs on the overall performance of the model remains the most important.
The approach followed during the elaboration of the model had for main mission to identify the various functions and methods allowing better learning of the machine. Therefore, the ultimate algorithm grouped these techniques trying to adjust the parameters to come out with the best possible performance.
Various tests were accumulated until a performance consistent enough for eventual validation was obtained. Apart from the type of neural networks and the activation functions which constituted the basic decisive elements, the precision of the model proved to be drastically dependent on the parameterization of the program. As a result, we proceeded to several possible combinations paving the way to optimal performance.
The Table 10 below show the evolution of the performance scores according to the settings.
Table 10. Values setting per test
|
Settings |
Values Test 1 |
Values Test 2 |
Values Test 3 |
Values Test 4 |
|
n-fold |
3 |
5 |
6 |
5 |
|
l_rate |
0.01 |
0.02 |
0.01 |
0.01 |
|
n_epoch |
7000 |
10000 |
9000 |
8991 |
|
n_hidden |
4 |
6 |
7 |
6 |
|
Mean Accuracy |
61.79% |
78.43% |
85.46% |
94.17% |
4.1 Final accuracy
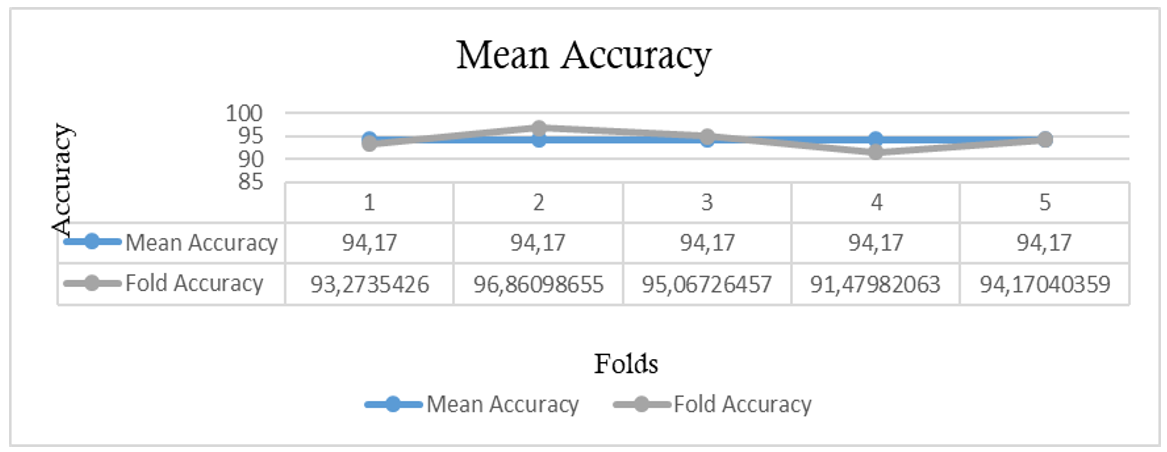
By running the model, it returns an average accuracy score of 94.17% for all the folds. Figure 6 below illustrates the mean accuracy of the model.
Figure 6. Folds accuracy vs mean accuracy
4.2 Final error
To account for the degree of approximation to which the model works, the values of the errors committed in the various measurements have been calculated to identify their consequences on the results obtained.
In this study, it was a question of calculating the root mean square error (MSE) which measures the mean of the error squares or the root mean square difference between the estimated values and the true value.
$R M S E=\sqrt{M S E}=\sqrt{\frac{1}{n} \sum_{i=1}^n\left(Y_i-Y^{\prime}{ }_i\right)^2}$ (9)
where, n is the number of measures, ${{y}_{i}}$ is the value of the ${{i}^{th}}$ observation in the validation dataset, $\bar{y}$ is the mean of the validation dataset values, and $\widehat{{{y}_{i}}}$ is the predicted value for the ${{i}^{th}}$ observation.
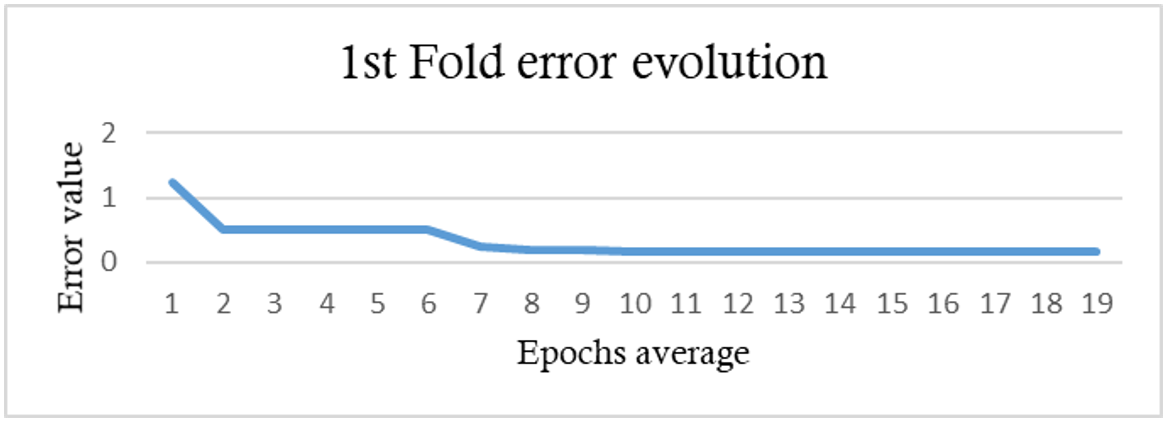
The folds exhibit a regression of the error from the first fold to the fifth. This indicates a progressive reduction in error across the folds, showcasing an improvement in the model's performance over successive iterations of cross-validation.The evolution of the error over the epochs is improving. A value of 1.236487 is noted at the start of execution in Figure 7, the error then decreases until it reaches 0.163628.
Figure 7. 1st fold error returned
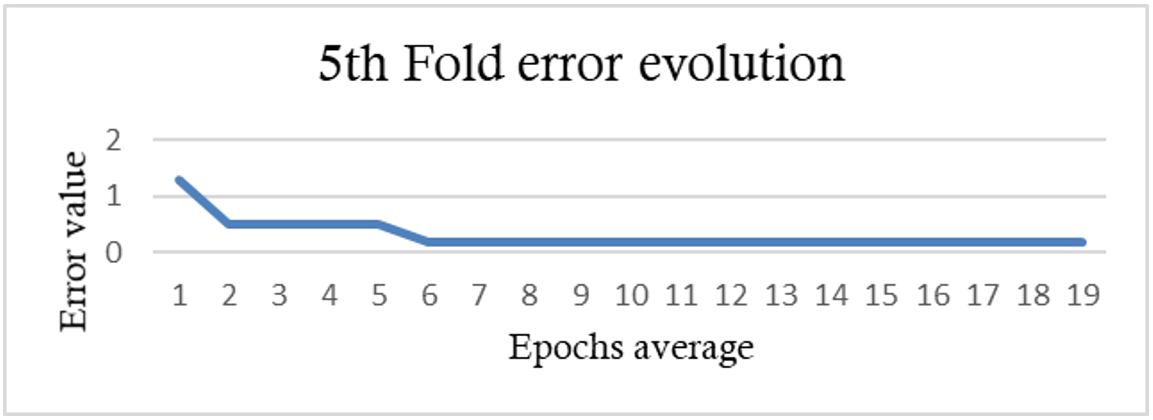
The 5th fold demonstrates as well a difference in the margin of error amounting to 1.123681 as a difference in the bounds of error. Thus, over time the margin of error has diminished as shown in Figure 8.
Figure 8. 5th fold error returned
In Figure 8, the returned error is derived from backpropagation. The first step is to calculate the error for each output neuron, thus obtaining the error signal (input) to propagate backward across the network.
$error=\left( output-expected \right)*transfer~derivate\left( output \right)$ (10)
The error of a given neuron is the difference between its actual output value and the expected output multiplied by the output of the derivative of the transfer function calculating the slope of the output value of the neuron, this is the error signal. This error calculation is used for the output layer neurons. The expected value is the class value itself.
As for the error signal for a neuron in the hidden layer, it is calculated as the weighted error of each neuron in the output layer. The back-propagated error signal is accumulated and then used to determine the error for the neuron in the hidden layer. It is obtained by multiplying the error signal of the jth neuron in the output layer by the weight connecting the kth neuron to the current neuron and by the derivative of the transfer function of the current neuron output.
$error=\left( weigh{{t}_{k}}*erro{{r}_{j}} \right)*transfer-derivate\left( output \right)$ (11)
4.3 Sensitivity analysis
Sensitivity analysis was applied to a significant portion of the observations in the learning package. The method chosen for this analysis is again a version of "k-fold cross-validation." We have chosen to base this analysis on the RMSE indicator to study the uncertainty of inputs on outputs.
Such a sensitivity analysis is very useful since it allows for testing the robustness of the model and an understanding of the relationships and effects between the inputs and outputs of variables.
In this regard, we used the One-At-a-Time (OAT) method to investigate the sensitivity of entries by varying them one by one while holding the others constant at predetermined nominal values. The sensitivity is then measured by monitoring the changes noted at the output level.
The utilization of the OAT method underscores the resilience of the model, providing additional evidence of the model's robustness and its commendable performance. This methodological approach contributes to the validation of the model's reliability and underscores its effectiveness in addressing diverse data scenarios.
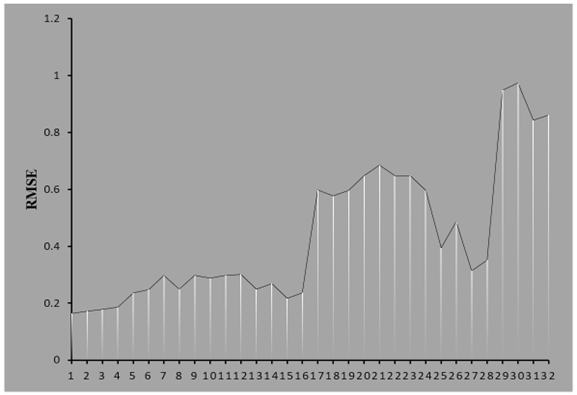
The graph above shows the RMSE developments estimated by OAT. Figure 9 shows four changes related to the input variables, one by one. We can conclude from this, based on the values detailed in the final error chapter, that the model is stable and not very sensitive to variations since these OAT-estimated changes are included in the final error interval. However, we can note that among the 8 entries studied, the "cost constraint" input has a minimally significant effect on the output.
Figure 9. Evolution of RMSE estimated by OAT
4.4 Feature importance
Feature importance is a common way to explain classification models. This term describes how significant a feature is for the model's classifying performance. Feature importance is calculated by assigning scores to input features to determine their relative importance when making predictions. It’s important to note that this score depends on the model and may vary for different models.
Feature importance is a measure of how important each feature is for a specific classifier, no matter the feature effect’s form or direction. It's used to assign scores to input features for predictive modeling and can be used for both regression (predicting a numerical value) and classification (predicting a class label).
These scores are beneficial in many ways; they can provide insight into our dataset by highlighting which features are most or least relevant to the target, and give an understanding of the model by showing which features are most important and least important when making a prediction.
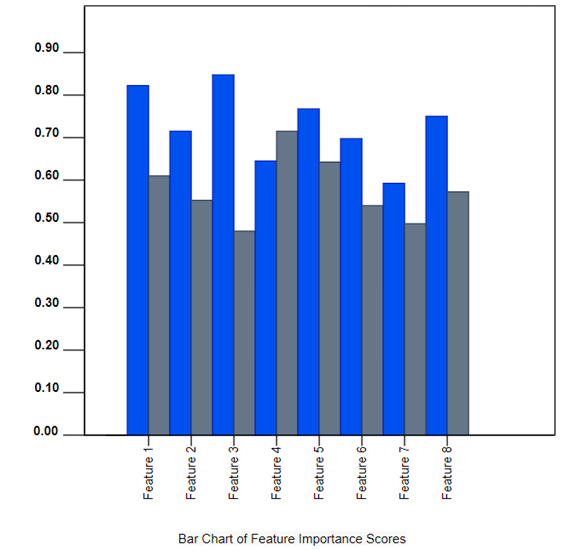
In what follows, we will examine the importance of the different inputs to the model and their effects on the output. The importance scores are returned by both the XGBoost and Random Forest methods as shown in Table 11 and Figure 10. The results show the importance of all dimensions and constraints that are part of the model.
The bar chart shows the importance of the features obtained by XGBoost and Random Forest respectively. The inputs are all equally important for the prediction.
We can thus conclude that all inputs justify their presence in the model and thus their importance in predicting the overall multidimensional performance value.
Table 11. Feature importance
|
Features |
Designation |
Score |
||
|
XGBoost |
Random Forest |
|||
|
Feature 1 |
Dimensions |
Economic |
0.8366 |
0.6064 |
|
Feature 2 |
Social |
0.7135 |
0.5565 |
|
|
Feature 3 |
Environmental |
0.8427 |
0.4839 |
|
|
Feature 4 |
Stakeholders |
0.6469 |
0.7036 |
|
|
Feature 5 |
Operational |
0.7693 |
0.6435 |
|
|
Feature 6 |
Constraints |
Difficulty |
0.6998 |
0.5465 |
|
Feature 7 |
Duration |
0.5943 |
0.4943 |
|
|
Feature 8 |
Cost |
0.7468 |
0.5793 |
|
Figure 10. Bar chart of feature importance scores
4.5 Managerial implications
This performance measurement model (based on ANN) can easily be used as an instrument to drive progress. With its main purpose being the measurement and prediction of global values of sustainable multidimensional performance, it will allow business leaders, and especially the operational managers, to follow the action plans implemented to achieve the company’s objectives or to take the necessary corrective measures if there is a gap between the expected and achieved performance figures.
The simple use of only the performance measurement system will allow different companies to assess their performance levels by simply applying the minimum conditions algorithm. But if they are digitized, they can acquire the application where the data will be implemented directly and the artificial neural network-based model will directly return the multidimensional sustainable performance value and thus the performance level. Sensitivity studies and the examination of the importance of features demonstrate the need to integrate the different dimensions: economic, social, environmental, operational and stakeholders in order to have a better visibility on the real level of overall performance of a company.
This system then resembles a progress instrument, which measures progress in an improvement process by presenting the various data points that a manager or decision-maker wishes to follow. It thus forms a strategic tool to gain visibility and accurately monitor activities.
In terms of managerial implications, the first obvious utility of this system is to give an overall view of the important aspects of an enterprise that have a narrow effect on overall performance. Outputs are easy to read and interpret, although they are calculated from a multitude of complex data that are difficult to process separately as it has a large number of parameters and characteristics taken into account.
The model based on artificial neural network also allows trends to be identified by following historical data while having real-time results. The results can be displayed directly on a dashboard allowing you to monitor at any time what level of performance the company is operating at. This is possible and the resulting data will be reliable due to the high performance and accuracy of the designed model as demonstrated in the results part and the very low margins of error obtained by the RMSE and MSE calculations. And can easily be applied to other research areas as the model presented remains open in terms of fields and can accommodate as many indicators as desired.
The model presented in this paper is a new contribution to the literature as it is the only model based on the five dimensions (economic, social, environmental, operational and stakeholder) and taking into account the three constraints of realism and achieving performance levels. A systematic review of the literature allowed us to identify a research gap residing in the absence of a model considering all the dimensions necessary for the evaluation of sustainable performance in terms of logistics activities. In the present study, multidimensional sustainable performance was calculated by direct application of the minimum condition algorithm performed by experts during a survey conducted by a Moroccan freight forwarder on collected data related to 43 road journeys involving different routes, durations, and transport conditions. Before the machine learning process, the model outputs were estimated by direct application of the minimum conditions algorithm. The results obtained were then subjected to machine learning techniques, especially ANN, which was used to predict the performance values calculated experimentally using the minimum condition algorithm. To evaluate the efficiency of the machine learning model, the performance and accuracy were calculated in each configuration to choose the best network structure and parameterization.
Once the network was frozen, the two parameters MSE and RMSE were also used to account for the degree of approximation to which the model works. It was observed that the evolution of the error over epochs improves significantly.
Future work can be derived from this paper, and this model can be implemented in other sectors by modifying the fields and adapting them to the studied context. This would allow us to verify the generic character of the model and determine the multidimensional value of sustainable performance regardless of the studied sector and thus analyze the accuracy of the model from one sector to another. The model can also be used as an instrument for calculating progress as it returns the level of performance of the organization almost momentarily from measurement and can be designed as a means of aiding decision-making given the information it could provide to business leaders and decision-makers through the choice of areas for improvement.
The proposed model may be subject to subjectivity as the assessment of the fields and dimensions is made by experts in the sector in question from the same geographical area and the constraints taken into consideration are mainly related to the studied context. It should be noted that the duration of the study did not exceed the 43 trips studied, which could limit the results of the model. Consideration of these points in future studies may help mitigate this bias by enriching the model with more dataset scenarios and opinions.
The results are mainly derived from the application of the minimal conditions algorithm. Using other scales or other algorithms would likely change the results.
Furthermore, the machine learning model does not currently support the indicators considered when calculating the global multidimensional performance value, future contributions may address this.
[1] Kumar, A., Anbanandam, R. (2019). Development of social sustainability index for freight transportation system. Journal of Cleaner Production, 210: 77-92. https://doi.org/10.1016/j.jclepro.2018.10.353
[2] Kumar Dadsena, K., Sarmah, S.P., Naikan, V.N.A. (2019). Risk evaluation and mitigation of sustainable road freight transport operation: A case of trucking industry. International Journal of Production Research, 57(19): 6223-6245. https://doi.org/10.1080/00207543.2019.1578429
[3] Budak, A. (2020). Sustainable reverse logistics optimization with triple bottom line approach: An integration of disassembly line balancing. Journal of Cleaner Production, 270: 122475. https://doi.org/10.1016/j.jclepro.2020.122475
[4] Chayma, F., Badr, T., Fadwa, F., Ahmed, M. (2022). Development of a conceptual model of multidimensional measurement of sustainable performance for road freight transport. In 2022 2nd International Conference on Innovative Research in Applied Science, Engineering and Technology (IRASET), Meknes, Morocco, IEEE, pp. 1-8. https://doi.org/10.1109/IRASET52964.2022.9738425
[5] Agyei-Owusu, B., Asamoah, D., Nuertey, D., Acquah, I.N. (2022). Examining the relationship between dimensions of supply chain integration, operational performance and firm performance: Evidence from Ghana. Management Research Review, 45(12): 1644-1669. https://doi.org/10.1108/MRR-06-2021-0464
[6] Tseng, M.L., Wu, K.J., Lim, M.K., Wong, W.P. (2019). Data-driven sustainable supply chain management performance: A hierarchical structure assessment under uncertainties. Journal of Cleaner Production, 227: 760-771. https://doi.org/10.1016/j.jclepro.2019.04.201
[7] Khosravi, F., Izbirak, G. (2019). A stakeholder perspective of social sustainability measurement in healthcare supply chain management. Sustainable Cities and Society, 50: 101681. https://doi.org/10.1016/j.scs.2019.10168
[8] Butzer, S., Schötz, S., Petroschke, M., Steinhilper, R. (2017). Development of a performance measurement system for international reverse supply chains. Procedia CIRP, 61: 251-256. https://doi.org/10.1016/j.procir.2016.11.264
[9] Castaneda, J., Cardona, J. F., Martins, L. D. C., Juan, A. A. (2021). Supervised machine learning algorithms for measuring and promoting sustainable transportation and green logistics. Transportation Research Procedia, 58: 455-462. https://doi.org/10.1016/j.trpro.2021.11.061
[10] Budak, A., Sarvari, P.A. (2021). Profit margin prediction in sustainable road freight transportation using machine learning. Journal of Cleaner Production, 314: 127990. doi:10.1016/j.jclepro.2021.127990
[11] Ruiz-Aguilar, J.J., Urda, D., Moscoso-López, J.A., González-Enrique, J., Turias, I.J. (2020). A freight inspection volume forecasting approach using an aggregation/disaggregation procedure, machine learning and ensemble models. Neurocomputing, 391: 282-291. https://doi.org 10.1016/j.neucom.2019.06
[12] Pandya, P., Gujar, R., Vakharia, V. (2020). Modeling and prediction of freight delivery for blocked and unblocked street using machine learning techniques. Transportation Research Procedia, 48: 555-561. https://doi.org 10.1016/j.trpro.2020.08.059
[13] Praveen, U., Farnaz, G., Hatim, G. (2019). Inventory management and cost reduction of supply chain processes using AI based time-series forecasting and ANN modeling. Procedia Manufacturing, 38: 256–263. https://doi.org 10.1016/j.promfg.2020.01.034 10
[14] Cheng, L., Chen, X., De Vos, J., Lai, X., Witlox, F. (2019). Applying a random forest method approach to model travel mode choice behavior. Travel Behaviour and Society, 14(September 2018): 1-10. https://doi.org/10.1016/j.tbs.2018.09.002
[15] Bolandnazar, E., Rohani, A., Taki, M. (2019). Energy consumption forecasting in agriculture by artificial intelligence and mathematical models. Energy Sources, Part A: Recovery, Utilization and Environmental Effects, 7036. https://doi.org/10.1080/15567036.2019.1604872
[16] Bekkari, N., Zeddouri, A. (2019). Using artificial neural network for predicting and controlling the effluent chemical oxygen demand in wastewater treatment plant. Management of Environmental Quality: An International Journal, 30(3): 593-608. https://doi.org/10.1108/MEQ-04-2018-0084
[17] Yao, Y., Cao, Y., Ding, X., Zhai, J., Liu, J., Luo, Y., Ma, S., Zou, K. (2018). A paired neural network model for tourist arrival forecasting. Expert Systems with Applications, 114: 588-614. https://doi.org/10.1016/j.eswa.2018.08.025
[18] Fang, L., Cheng, X., Wang, H., Yang, L. (2018). Mobile demand forecasting via deep graph-sequence spatiotemporal modeling in cellular networks. IEEE Internet of Things Journal, 5(4): 3091-3101. https://doi.org/10.1109/JIOT.2018.2832071
[19] Cao, J., Jiang, Z., Wang, K. (2017). Customer demand prediction of service-oriented manufacturing using the least square support vector machine optimized by particle swarm optimization algorithm. Engineering Optimization, 49(7): 1197-1210.
[20] Yu, Y., Wang, Y., Gao, S., Tang, Z. (2017). Statistical modeling and prediction for tourism economy using dendritic neural network. Computational Intelligence and Neuroscience, 2017. https://doi.org/10.1155/2017/7436948
[21] Bakhtyar, S., Holmgren, J. (2015). A data mining based method for route and freight estimation. Procedia Computer Science, 52: 396-403. doi:10.1016/j.procs.2015.05.004
[22] Wu, H., Liu, G. (2015). Container sea-rail transport volume forecasting of Ningbo port based on combination forecasting model. In International Conference on Advances in Energy, Environment and Chemical Engineering, pp. 449-454. https://doi.org/10.2991/aeece-15.2015.91
[23] Quan, H., Srinivasan, D., Khosravi, A. (2014). Short-term load and wind power forecasting using neural network-based prediction intervals. IEEE Transactions on Neural Networks and Learning Systems, 25(2): 303-315. https://doi.org/10.1109/TNNLS.2013.2276053
[24] Du, X.F., Leung, S.C.H., Zhang, J.L., Lai, K.K. (2013). Demand forecasting of perishable farm products using support vector machine. International Journal of Systems Science, 44(3): 556–567. https://doi.org/10.1080/00207721.2011.617888
[25] Badri, A., Ameli, Z., Birjandi, A. (2012). Application of artificial neural networks and fuzzy logic methods for short term load forecasting-sciencedirect. Energy Procedia, 1883-1888.
[26] Wu, Q., Law, R., Xu, X. (2012). A sparse Gaussian process regression model for tourism demand forecasting in Hong Kong. Expert Systems with Applications, 39(5): 4769-4774. https://doi.org/10.1016/j.eswa.2011.09.159
[27] Hong, W.C., Dong, Y., Chen, L. Y., Wei, S.Y. (2011). SVR with hybrid chaotic genetic algorithms for tourism demand forecasting. Applied Soft Computing Journal, 11(2): 1881-1890. https://doi.org/10.1016/j.asoc.2010.06.003
[28] Çunkaş, M., Altun, A.A. (2010). Long term electricity demand forecasting in Turkey using artificial neural networks. Energy Sources, Part B: Economics, Planning and Policy, 5(3): 279-289. https://doi.org/10.1080/15567240802533542
[29] Jin, C., Liu, X., Gao, P. (2004). An intelligent simulation method based on artificial neural network for container yard operation. In International Symposium on Neural Networks, Springer, Berlin, Heidelberg, pp. 904-911.
[30] Abhijith, K.V., Kumar, P., Gallagher, J., McNabola, A., Baldauf, R., Pilla, F., Pulvirenti, B. (2017). Air pollution abatement performances of green infrastructure in open road and built-up street canyon environments – A review. Atmospheric Environment, 162: 71-86. https://doi.org/10.1016/j.atmosenv.2017.05.014
[31] Wolkoff, P. (2013). Indoor air pollutants in office environments: Assessment of comfort, health, and performance. International Journal of Hygiene and Environmental Health, 216(4): 371-394. https://doi.org/10.1016/j.ijheh.2012.08.001
[32] Curto, A., Donaire-Gonzalez, D., Barrera-Gómez, J., Marshall, J.D., Nieuwenhuijsen, M.J., Wellenius, G.A., Tonne, C. (2018). Performance of low-cost monitors to assess household air pollution. Environmental Research, 163: 53-63. https://doi.org/10.1016/j.envres.2018.01.024
[33] Li, X.N., Jiao, W.T., Xiao, R.B., Chen, W.P., Chang, A. C. (2015). Soil pollution and site remediation policies in China: A review. Environmental Reviews, 23(3): 263-274. https://doi.org/10.1139/er-2014-0073
[34] Elbana, T., Gaber, H.M., Kishk, F.M. (2018). Soil chemical pollution and sustainable agriculture. The Soils of Egypt, 187-200. https://doi.org/10.1007/978-3-319-95516-2_11
[35] Sharma, G.K., Jena, R.K., Hota, S., Kumar, A., Ray, P., Fagodiya, R.K., Malav, L.C., Yadav, K.K., Gupta, D.K., Khan, S.A., Ray, S.K. (2020). Recent development in bioremediation of soil pollutants through biochar for environmental sustainability. Biochar Applications in Agriculture and Environment Management, 123-140. https://doi.org/10.1007/978-3-030-40997-5_6
[36] Ukaogo, P.O., Ewuzie, U., Onwuka, C.V. (2020). Environmental pollution: Causes, effects, and the remedies. Microorganisms for Sustainable Environment and Health, 419-429. https://doi.org/10.1016/B978-0-12-819001-2.00021-8
[37] Chappells, H., Shove, E. (2005). Debating the future of comfort: environmental sustainability, energy consumption and the indoor environment. Building Research & Information, 33(1): 32-40. https://doi.org/10.1080/0961321042000322762
[38] Jorgenson, A.K., Alekseyko, A., Giedraitis, V. (2014). Energy consumption, human well-being and economic development in central and eastern European nations: A cautionary tale of sustainability. Energy Policy, 66: 419-427. https://doi.org/10.1016/j.enpol.2013.11.020
[39] Doluweera, G., Hahn, F., Bergerson, J., Pruckner, M. (2020). A scenario-based study on the impacts of electric vehicles on energy consumption and sustainability in Alberta. Applied Energy, 268: 114961.
[40] Bibi, A., Zhang, X., Umar, M. (2021). The imperativeness of biomass energy consumption to the environmental sustainability of the United States revisited. Environmental and Ecological Statistics, 28(4): 821–841. https://doi.org/10.1007/s10651-021-00500-9
[41] Skeete, J.P., Wells, P., Dong, X., Heidrich, O., Harper, G. (2020). Beyond the EVent horizon: Battery waste, recycling, and sustainability in the United Kingdom electric vehicle transition. Energy Research & Social Science, 69: 101581. https://doi.org/10.1016/j.erss.2020.101581
[42] Reuter, M.A. (2011). Limits of design for recycling and “Sustainability”: A Review. Waste and Biomass Valorization, 2(2): 183-208. https://doi.org/10.1007/s12649-010-9061-3
[43] Menikpura, S.N.M., Gheewala, S.H., Bonnet, S., Chiemchaisri, C. (2012). Evaluation of the effect of recycling on sustainability of municipal solid waste management in Thailand. Waste and Biomass Valorization, 4(2): 237-257. https://doi.org/10.1007/s12649-012-9119-5
[44] Zhang, Z., Malik, M.Z., Khan, A., Ali, N., Malik, S., Bilal, M. (2022). Environmental impacts of hazardous waste, and management strategies to reconcile circular economy and eco-sustainability. Science of The Total Environment, 807: 150856. https://doi.org/10.1016/j.scitotenv.2021.150856
[45] Block, C., Van Caneghem, J., Van Brecht, A., Wauters, G., Vandecasteele, C. (2014). Incineration of hazardous waste: A sustainable process? Waste and Biomass Valorization, 6(2): 137-145. https://doi.org/10.1007/s12649-014-9334-3
[46] Gomez-Delgado, M., Tarantola, S. (2006). GLOBAL sensitivity analysis, GIS and multi-criteria evaluation for a sustainable planning of a hazardous waste disposal site in Spain. International Journal of Geographical Information Science, 20(4): 449
[47] Gawlik-Kobylińska, M. (2021). Can security and safety education support sustainability? Lessons Learned from Poland. Sustainability, 13(4): 1747. https://doi.org/10.3390/su13041747
[48] Spadaro, Pirlone, F. (2021). Sustainable urban mobility plan and health security. Sustainability, 13(8): 4403. https://doi.org/10.3390/su13084403
[49] De Kruijf, H.A.M., Van Vuuren, D.P. (1998). Following sustainable development in relation to the north–south dialogue: Ecosystem health and sustainability indicators. Ecotoxicology and Environmental Safety, 40(1-2): 4-14. https://doi.org/10.1006/eesa.1998.1635
[50] Turan Çimşir, B., Uzunboylu, H. (2019). Awareness training for sustainable development: Development, implementation and evaluation of a mobile application. Sustainability, 11(3): 611. https://doi.org/10.3390/su11030611
[51] Law, M.M.S., Hills, P., Hau, B.C.H. (2015). Engaging employees in sustainable development-A case study of environmental education and awareness training in Hong Kong. Business Strategy and the Environment, 26(1): 84-97. https://doi.org/10.1002/bse.1903
[52] Baumgartner, R.J., Winter, T. (2013). The sustainability manager: A tool for education and training on sustainability management. Corporate Social Responsibility and Environmental Management, 21(3): 167-174. https://doi.org/10.1002/csr.1313
[53] Ballet, J., Bazin, D., Mahieu, F. (2020). A policy framework for social sustainability: Social cohesion, equity and safety. Sustainable Development, 28(5): 1388-1394. https://doi.org/10.1002/sd.2092
[54] Saunders, F., Gilek, M., Ikauniece, A., Tafon, R.V., Gee, K., Zaucha, J. (2020). Theorizing social sustainability and justice in marine spatial planning: Democracy, diversity, and equity. Sustainability, 12(6): 2560. https://doi.org/10.3390/su12062560
[55] Golub, A., Mahoney, M., Harlow, J. (2013). Sustainability and intergenerational equity: Do past injustices matter? Sustainability Science, 8(2): 269-277. https://doi.org/10.1007/s11625-013-0201-0
[56] Fonseca, A., Abreu, I., Guerreiro, M., Abreu, C., Silva, R., Barros, N. (2018). Indoor air quality and sustainability management-case study in three portuguese healthcare units. Sustainability, 11(1): 101. https://doi.org/10.3390/su11010101
[57] Borrego, C., Martins, H., Tchepel, O., Salmim, L., Monteiro, A., Miranda, A.I. (2006). How urban structure can affect city sustainability from an air quality perspective. Environmental Modelling & Software, 21(4): 461-467. https://doi.org/10.1016/j.envsoft.2004.07.009
[58] Pisoni, E., Christidis, P., Thunis, P., Trombetti, M. (2019). Evaluating the impact of “Sustainable Urban Mobility Plans” on urban background air quality. Journal of Environmental Management, 231: 249-255. https://doi.org/10.1016/j.jenvman.2018.10.039
[59] Balasbaneh, A.T., Yeoh, D., Zainal Abidin, A.R. (2020). Life cycle sustainability assessment of window renovations in schools against noise pollution in tropical climates. Journal of Building Engineering, 101784. https://doi.org/10.1016/j.jobe.2020.101784
[60] Hammad, A.W.A., Akbarnezhad, A., Rey, D. (2017). Sustainable urban facility location: Minimising noise pollution and network congestion. Transportation Research Part E: Logistics and Transportation Review, 107: 38-59. https://doi.org/10.1016/j.tre.2017.09.005
[61] Forouhid, A.E., Khosravi, S., Mahmoudi, J. (2023). Noise pollution analysis using geographic information system, agglomerative hierarchical clustering and principal component analysis in urban sustainability (Case Study: Tehran). Sustainability, 15(3): 2112. https://doi.org/10.3390/su15032112
[62] Pender, J.L., Weber, J.G., Brown, J.P. (2014). Sustainable rural development and wealth creation. Economic Development Quarterly, 28(1): 73-86. https://doi.org/10.1177/0891242413513327
[63] Ratner, S., Markley, D. (2014). Rural wealth creation as a sustainable economic development strategy: Introduction to the special issue. Community Development, 45(5): 435-442. https://doi.org/10.1080/15575330.2014.951375
[64] Lagoarde-Segot, T., Paranque, B. (2018). Finance and sustainability: From ideology to utopia. International Review of Financial Analysis, 55: 80-92. https://doi.org/10.1016/j.irfa.2017.10.006
[65] Lassala, C., Apetrei, A., Sapena, J. (2017). Sustainability matter and financial performance of companies. Sustainability, 9(9): 1498. https://doi.org/10.3390/su9091498
[66] Schumacher, K., Chenet, H., Volz, U. (2020). Sustainable finance in Japan. Journal of Sustainable Finance & Investment, 10(2): 213-246. https://doi.org/10.1080/20430795.2020.1735219
[67] Chan, E.H.W., Lee, G.K.L. (2008). Contribution of urban design to economic sustainability of urban renewal projects in Hong Kong. Sustainable Development, 16(6): 353-364. https://doi.org/10.1002/sd.350
[68] Zhou, X., Tang, X., Zhang, R. (2020). Impact of green finance on economic development and environmental quality: A study based on provincial panel data from China. Environmental Science and Pollution Research, 27(16): 19915-19932. https://doi.org/10.1007/s11356-020-08383-2
[69] Forsyth, P. (2011). Environmental and financial sustainability of air transport: Are they incompatible? Journal of Air Transport Management, 17(1): 27-32. https://doi.org/10.1016/j.jairtraman.2010.10.006"
[70] Clinton, L., Whisnant, R. (2018). Business model innovations for sustainability. Managing Sustainable Business, 467-507. https://doi.org/10.1007/978-94-024-1144-7_22
[71] Schaltegger, S., Lüdeke-Freund, F., Hansen, E.G. (2011). Business cases for sustainability and the role of business model innovation: Developing a conceptual framework. SSRN Electronic Journal. https://doi.org/10.2139/ssrn.2010506
[72] Pasha, J., Dulebenets, M.A., Singh, P., Moses, R., Sobanjo, J., Ozguven, E.E. (2021). Towards improving sustainability of rail transport by reducing traffic delays at level crossings: A case study for the State of Florida. Cleaner Logistics and Supply Chain, 1,
[73] Amri, T.A., Marey-Pérez, M. (2020). Towards a sustainable construction industry: Delays and cost overrun causes in construction projects of Oman. Journal of Project Management, 87-102. https://doi.org/10.5267/j.jpm.2020.1.001
[74] Hanumante, N.C., Shastri, Y., Hoadley, A. (2019). Assessment of circular economy for global sustainability using an integrated model. Resources, Conservation and Recycling, 151: 104460. https://doi.org/10.1016/j.resconrec.2019.104460
[75] Dey, A., LaGuardia, P., Srinivasan, M. (2011). Building sustainability in logistics operations: A research agenda. Management Research Review, 34(11): 1237-1259. https://doi.org/10.1108/01409171111178774
[76] Bosona, T. (2020). Urban freight last mile logistics-challenges and opportunities to improve sustainability: A literature review. Sustainability, 12(21): 8769. https://doi.org/10.3390/su12218769
[77] Gao, T., Erokhin, V., Arskiy, A. (2019). Dynamic optimization of fuel and logistics costs as a tool in pursuing economic sustainability of a farm. Sustainability, 11(19): 5463. https://doi.org/10.3390/su11195463
[78] Vargas, A., Fuster, C., Corne, D. (2020). Towards sustainable collaborative logistics using specialist planning algorithms and a gain-sharing business model: A UK case study. Sustainability, 12(16): 6627. https://doi.org/10.3390/su12166627
[79] Aloui, A., Hamani, N., Derrouiche, R., Delahoche, L. (2021). Systematic literature review on collaborative sustainable transportation: Overview, analysis and perspectives. Transportation Research Interdisciplinary Perspectives, 9: 100291. https://doi.org/10.1016/j.trip.2020.100291
[80] León-Bravo, V., Caniato, F., Caridi, M., Johnsen, T. (2017). Collaboration for sustainability in the food supply chain: A multi-stage study in Italy. Sustainability, 9(7): 1253. https://doi.org/10.3390/su9071253
[81] Sun, Z.Y., Li, G.X. (2015). On reliability and flexibility of sustainable energy application route for vehicles in China. Renewable and Sustainable Energy Reviews, 51: 830-846. https://doi.org/10.1016/j.rser.2015.06.042
[82] Mejías, A.M., Paz, E., Pardo, J.E. (2016). Efficiency and sustainability through the best practices in the Logistics Social Responsibility framework. International Journal of Operations & Production Management, 36(2): 164-199. https://doi.org/10.1108/IJOPM-07-2014-0301"
[83] Cheng, T.C., Kamble, S.S., Belhadi, A., Ndubisi, N.O., Lai, K., Kharat, M.G. (2021). Linkages between big data analytics, circular economy, sustainable supply chain flexibility, and sustainable performance in manufacturing firms. International Journal of Production Research, 1-15. https://doi.org/10.1080/00207543.2021.190697
[84] Ageron, B., Gunasekaran, A., Spalanzani, A. (2012). Sustainable supply management: An empirical study. International Journal of Production Economics, 140(1): 168-182. https://doi.org/10.1016/j.ijpe.2011.04.007
[85] Gouda, S.K., Saranga, H. (2018). Sustainable supply chains for supply chain sustainability: Impact of sustainability efforts on supply chain risk. International Journal of Production Research, 1–16. https://doi.org/10.1080/00207543.2018.1456695
[86] Brown, R.R., Farrelly, M.A. (2009). Delivering sustainable urban water management: A review of the hurdles we face. Water Science and Technology, 59(5): 839-846. https://doi.org/10.2166/wst.2009.028
[87] Wikhamn, W. (2019). Innovation, sustainable HRM and customer satisfaction. International Journal of Hospitality Management, 76: 102-110. https://doi.org/10.1016/j.ijhm.2018.04.009
[88] Strenitzerová, M., Gaňa, J. (2018). Customer satisfaction and loyalty as a part of customer-based corporate sustainability in the sector of mobile communications services. Sustainability, 10(5): 1657. https://doi.org/10.3390/su10051657
[89] Pei, X.L., Guo, J.N., Wu, T.J., Zhou, W.X., Yeh, S.P. (2020). Does the effect of customer experience on customer satisfaction create a sustainable competitive advantage? A comparative study of different shopping situations. Sustainability, 12(18): 7436. https://doi.org/10.3390/su12187436
[90] Evans, B., Joas, M., Sundback, S., Theobald, K. (2013). Governing sustainable cities. Routledge. https://doi.org/10.4324/9781849771504
[91] Billi, M., Mascareño, A., Edwards, J. (2020). Governing sustainability or sustainable governance? Semantic constellations on the sustainability-governance intersection in academic literature. Journal of Cleaner Production, 123523. https://doi.org/10.1016/j.jclepro.2020.123523
[92] Iribarnegaray, M., Seghezzo, L. (2012). Governance, sustainability and decision making in water and sanitation management systems. Sustainability, 4(11): 2922-2945. https://doi.org/10.3390/su4112922
[93] Gardner, T.A., Benzie, M., Börner, J., Dawkins, E., Fick, S., Garrett, R., Wolvekamp, P. (2018). Transparency and sustainability in global commodity supply chains. World Development, 121: 163-177. https://doi.org/10.1016/j.worlddev.2018.05.025
[94] Schreck, P., Raithel, S. (2015). Corporate Social performance, firm size, and organizational visibility: Distinct and joint effects on voluntary sustainability reporting. Business & Society, 57(4): 742-778. https://doi.org/10.1177/0007650315613120
[95] Bai, C., Sarkis, J. (2020). A supply chain transparency and sustainability technology appraisal model for blockchain technology. International Journal of Production Research, 1-21. https://doi.org/10.1080/00207543.2019.1708989
[96] Gibson, K. (2012). Stakeholders and sustainability: An evolving theory. Journal of Business Ethics, 109(1): 15-25. https://doi.org/10.1007/s10551-012-1376-5
[97] Juntunen, J.K., Halme, M., Korsunova, A., Rajala, R. (2018). Strategies for integrating stakeholders into sustainability innovation: A configurational perspective. Journal of Product Innovation Management. https://doi.org/10.1111/jpim.12481
[98] Edwin Clifton, D., Amran, A. (2010). The stakeholder approach: A sustainability perspective. Journal of Business Ethics, 98(1): 121-136. https://doi.org/10.1007/s10551-010-0538-6
[99] Peter Andreasen, K., Sovacool, B.K. (2014). Energy sustainability, stakeholder conflicts, and the future of hydrogen in Denmark. Renewable and Sustainable Energy Reviews, 39: 891-897. https://doi.org/10.1016/j.rser.2014.07.158
[100] Agatonovic-Kustrin, S., Beresford, R. (2000). Basic concepts of Artificial Neural Network (ANN) modeling and its application in pharmaceutical research. Journal of Pharmaceutical and Biomedical Analysis, 22(5): 717-727. https://doi.org/10.1016/s0731-7085(99)00272-1