Xiaoran Pang | Yu Pang*
© 2022 IIETA. This article is published by IIETA and is licensed under the CC BY 4.0 license (http://creativecommons.org/licenses/by/4.0/).
OPEN ACCESS
The boom of online shopping has intensified the competition between e-commerce platforms. To enhance its service quality, every e-commerce website is taking measures to improve shopping experience and consumer satisfaction. However, the existing studies on consumer satisfaction with e-commerce platform fail to fully consider consumer feedbacks, such as sharing, forwarding, and reviewing. Thus, this paper explores the evaluation model and influencing factors of consumer satisfaction with e-commerce platform. Firstly, the behavior features of similar consumers were clustered, and evaluation indices were referred to divide the factors affecting the consumer satisfaction with e-commerce platform into different layers. In addition, a consumer satisfaction evaluation model was constructed based on attention mechanism, and proved effective through experiments.
e-commerce platform, consumer satisfaction, evaluation model, artificial neural network
With the rapid development of e-commerce related technologies, shopping on e-commerce platform has become a main consumption mode [1, 2]. The intense competition between e-commerce platforms motivates e-commerce websites to enhance their service quality by improving shopping experience and consumer satisfaction [3, 4]. Many e-commerce platforms have simplified the acquisition of the data on consumer behaviors, such as sharing, forwarding, and reviewing. This not only improves the service items and marketing goals of the platforms, but also provides strong data support to the evaluation of consumer satisfaction [5-11].
The development of mobile Internet expands the audience of online marketing, and disperses consumer attention [12-16]. Through strength, weakness, opportunity, and threat (SWOT) analysis, Nam and Seong [17] expounded on the correlation between participatory marketing and customer satisfaction, reconstructed a people-oriented path towards participatory marketing, and pointed out the direction of innovative development for this marketing mode. Based on two-factor theory, Liang et al. [18] established a measuring model for consumer satisfaction, and measured the influence of product quality guarantee and product perception over consumer satisfaction. Soltanpour et al. [19] analyzed a massive amount of data on free, anonymous product reviews from online platforms, established the correlations between multi-dimensional factors that affect consumer satisfaction, using a Bayesian network, and set up an accurate and scientific evaluation system based on online review texts. Zhang et al. [20] discussed the reliability and difference of different online product reviews, calculated the utility of online products by Dempster’s rule of combination, and evaluated consumer satisfaction through case analysis. Mariani et al. [21] clarified the correlation of consumer satisfaction with six service quality factors of online tourism platform, namely, reliability, operability, functional completeness, information quality, response speed, security, and experience, identified the positively correlated factors and insignificantly correlated factors, and presented optimization strategies for online tourism platform.
Most studies on consumer satisfaction with e-commerce platform investigate the influencing factors of consumer satisfaction, and innovate the following aspects of the platform: acquisition form of consumer behavior data, interactive interface, and evaluation algorithm, from the perspectives of theory and technology [22-26]. However, few of the proposed e-commerce platforms manage to put consumers at the center, or meet the ideal expectation of consumers, owing to the overlook of platform consumer feedbacks like sharing, forwarding, and reviewing. Thus, this paper explores the evaluation model and influencing factors of consumer satisfaction with e-commerce platform. The main contents of this work are as follows: Section 2 clusters the behavior features of similar consumers; Section 3 relies on evaluation indices to divide the factors affecting the consumer satisfaction with e-commerce platform into different layers, constructs a consumer satisfaction evaluation model based on attention mechanism, and completes index fuzzification and importance calculation. The proposed model was proved effective through experiments.
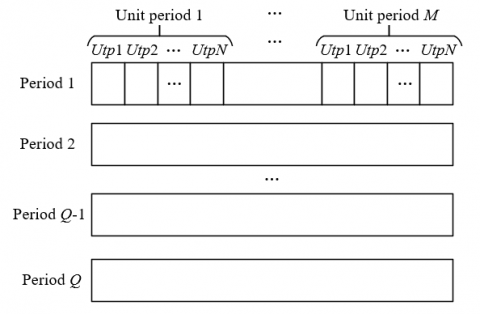
If two e-commerce platform consumers are strongly correlated, their behavior features will follow similar cyclic change laws. To clearly display the e-commerce consumer behaviors in fixed periods, a two-dimensional (2D) consumer behavior matrix was established (Figure 1), and the behavior features of similar consumers were clustered.
Figure 1. Consumer behavior matrix
The time-varying consumer behaviors follow discrete distribution. Therefore, the Gaussian mixture model, which relies on Gaussian probability density function (PDF), applies well to consumer behavior data. The model views a consumption dataset as a collection of M Gaussian models obeying Gaussian distribution A={a(l), a(2), …, a(2)}. The corresponding Gaussian distribution M(a; vj, ∑j) is the cluster center of each class of consumer behavior features. Let l be the number of Gaussian mixture models; ψj be the weight coefficient of each model; ξj and λj be the mean and covariance of Gaussian distribution features, respectively. For each Gaussian model, there is:
$A\tilde{\ }\sum\limits_{j=1}^{l}{{{\psi }_{j}}}M\left( {{\lambda }_{j}},{{\xi }_{j}} \right)$ (1)
Let ω be the set of parameter vectors. The composite Gaussian mixture model can be expressed as:
$GV\left( a,\omega \right)=\sum\limits_{j=1}^{l}{{{\psi }_{j}}}g\left( a;{{\lambda }_{j}},{{\xi }_{j}} \right)$ (2)
Let VB be the dimension of observations. Then, we have:
$g\left( a;{{\lambda }_{j}},{{\xi }_{j}} \right)=\frac{1}{\sqrt{{{\left( 2\pi \right)}^{VB}}\left| {{\xi }_{j}} \right|}}exp\left[ -\frac{1}{2}{{\left( a-{{\lambda }_{j}} \right)}^{T}}\sum{_{_{j}}^{-1}\left( a-{{\lambda }_{j}} \right)} \right]$ (3)
To acquire the hidden variables from consumer behavior data, parameters ψ, λ and ξ are calculated by the expectation-maximization (EM) clustering algorithm, which is a two-step iterative algorithm. The first step is to compute the posterior probability φ(i)j of parameter c(i), using the Bayesian formula:
$\begin{align} & \phi _{j}^{\left( i \right)}=GV\left( {{c}^{\left( i \right)}}=j\left| {{a}^{\left( i \right)}};\psi ,\lambda ,\xi \right. \right)=\frac{GV\left( {{a}^{\left( i \right)}}\left| {{c}^{\left( i \right)}}=j \right. \right)GV\left( {{c}^{\left( i \right)}}=j \right)}{\sum\limits_{i=1}^{l}{GV\left( {{a}^{\left( i \right)}}\left| {{c}^{\left( i \right)}}=k \right. \right)GV\left( {{c}^{\left( i \right)}}=k \right)}} \\ & =\frac{GV\left( {{a}^{\left( i \right)}}\left| {{c}^{\left( i \right)}}=j,\lambda ,\Sigma \right. \right)GV\left( {{c}^{\left( i \right)}}=j;\psi \right)}{\sum\limits_{i=1}^{l}{GV\left( {{a}^{\left( i \right)}}\left| {{c}^{\left( i \right)}}=j,\lambda ,\Sigma \right. \right)GV\left( {{c}^{\left( i \right)}}=j;\psi \right)}} \\\end{align}$ (4)
Formula (4) shows φ(i)j, which characterizes the model estimation of c(i), can be derived from parameter a(i) and current parameters ψ, λ and ξ. Next, the probability of consumer behavior sample i belonging to feature class j is denoted as φj(i). The current parameters ψ, λ and ξ can be updated by:
${{\psi }_{j}}=\frac{1}{M}\sum\limits_{i=1}^{M}{\phi _{j}^{\left( i \right)}},{{\lambda }_{j}}=\frac{\sum\limits_{i=1}^{M}{\phi _{j}^{\left( i \right)}{{a}^{\left( i \right)}}}}{\sum\limits_{i=1}^{M}{\phi _{j}^{\left( i \right)}}},{{\xi }_{j}}=\frac{\sum\limits_{i=1}^{M}{\phi _{j}^{\left( i \right)}\left( {{a}^{\left( i \right)}}-{{\lambda }_{j}} \right){{\left( {{a}^{\left( i \right)}}-{{\lambda }_{j}} \right)}^{T}}}}{\sum\limits_{i=1}^{M}{\phi _{j}^{\left( i \right)}}}$ (5)
The above steps are repeated to update parameter ω continuously until the model converges.
To clarify the degree of consumer satisfaction, it is necessary to distinguish between e-commerce platform consumers by activity. In this paper, the consumption behavior modes and features are evaluated by two indices: bookmarking/reviewing (BR) frequency and the number of days for BR records.
Suppose the historical consumption data span across Q periods. Let εvq be the number of BR by consumer v in period q. Based on the BR records of 4,000 consumers in the e-commerce platform consumption dataset, the BR frequency NCMv by consumer v in a fixed period can be calculated by:
$NC{{M}_{v}}=\frac{\sum\nolimits_{w=1}^{Q}{{\quad{\varepsilon }_{vq}}}}{Q}$ (6)
Out of the Q periods, consumer v has BR record(s) in CNWv periods:
$CN{{W}_{v}}=\sum\nolimits_{q=1}^{Q}{F\left( q \right)}$ (7)
where, F(q) is a binary function reflecting whether consumer v has BR record(s) in period q. If he/she has BR record(s), F(q)=1; if he/she does not have BR record(s), F(q)=0.
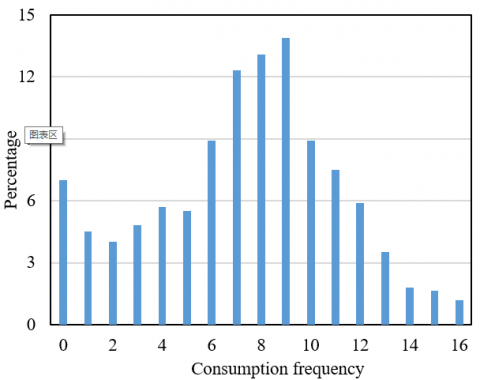
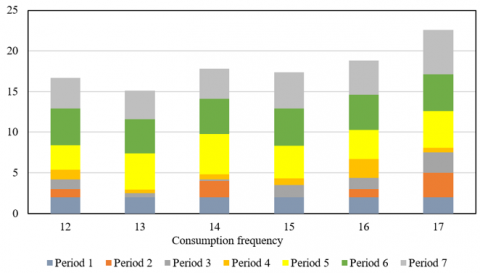
Based on the calculated BR frequency and the number of days for BR records, the e-commerce platform consumers can be preliminarily classified by activity. Figure 2 displays the distribution of consumption frequency derived from the BR frequency.
Figure 2. Distribution of consumption frequency
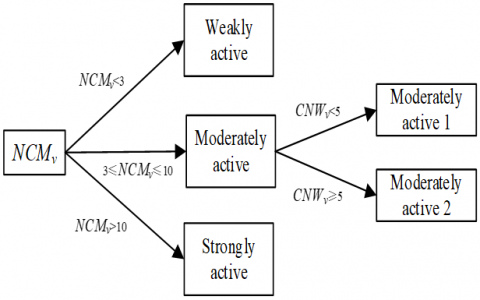
The consumption frequency of e-commerce platform consumers is generally affected by internal and external factors, such as living habits, preferences, and holidays. For moderately active consumers, their consumption frequency changes cyclically in a fixed period, and their activity differ between holidays and non-holidays. Based on BR frequency and the number of days for BR records, this paper divides consumers to four classes by activity: weakly active, moderately active 1, moderately active 2, and strongly active (Figure 3).
Figure 3. Activity-based consumer classification rules
3.1 Model construction
Long short-term memory (LSTM) network is a special structure extended from recurrent neural network (RNN). The storage unit of LSTM network consists of an input gate, an output gate, and a forget gate. The interaction between the three gates controls the network operation. Under the action of activation functions, the three gates generate numbers between 0 and 1 to control their opening and close, and further determine the retaining or removal of historical information. The formula of the forget gate can be given by:
$Y{{G}_{\varepsilon }}=\Gamma \left( {{Q}_{g}}\cdot \left[ {{F}_{\varepsilon -1}},{{A}_{\varepsilon }} \right]+{{r}_{g}} \right)$ (8)
The formula of the input gate can be given by:
$G{{A}_{\varepsilon }}=\Gamma \left( {{Q}_{i}}\cdot \left[ {{F}_{\varepsilon -1}},{{A}_{\varepsilon }} \right]+{{r}_{i}} \right)$ (9)
The current state EUSε of the input unit can be calculated by:
$EU{{S}_{\varepsilon }}=Y{{G}_{\varepsilon }}\times EU{{S}_{\varepsilon -1}}+G{{A}_{\varepsilon }}\times EU{{S}^{*}}_{\varepsilon }$ (10)
where, EUS*ε is the current memory:
$EUS_{\varepsilon }^{*}=tanh\left( {{Q}_{EUS}}\cdot \left[ {{F}_{\varepsilon -1}},{{A}_{\varepsilon }} \right]+{{r}_{EUS}} \right)$ (11)
Formulas (10) and (11) show that the current memory EUS*ε combined with the input unit state EUSε-1 at the previous moment is the new input unit state EUSε. The formula of the output gate can be given by:
${{D}_{\varepsilon }}=\Gamma \left( {{Q}_{D}}\cdot \left[ {{F}_{\varepsilon -1}},{{A}_{\varepsilon }} \right]+{{r}_{D}} \right)$ (12)
${{F}_{\varepsilon }}={{D}_{\varepsilon }}\times tanh\left( EU{{S}_{\varepsilon }} \right)$. (13)
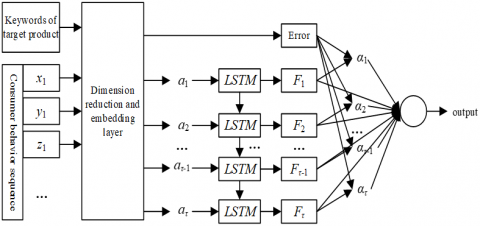
The consumption behavior data of each e-commerce platform consumer contain two implicit rules: First, the consumption is driven by consumer satisfaction; Second, consumption records demonstrate different kinds of consumer satisfaction. Based on these two rules, this paper constructs an LSTM-based mining model for consumer satisfaction. In the model, the satisfaction state comes from the consumer behavior sequence. In addition, the attention mechanism was introduced to the LSTM network to extract the satisfaction information from consumers in different satisfaction states, thereby screening the satisfaction states outputted by the LSTM network.
In the attention layer, the satisfaction classes implied in a consumer behavior sequence are denoted as x, y, z, …The consumer behavior sequence corresponding to each satisfaction state can be expressed as [x1, x2, …, xm]~x, [y1, y2, …, ym]~y, [z1, z2, …, zm]~z, … Therefore, this paper chooses [x1, y1, z1, x2, y2, z2, …] to depict the consumer behavior sequences of e-commerce platform consumers, which obey discrete distribution. In this way, the consumer behavior sequences of multiple satisfaction states can be combined into a hybrid consumer behavior sequence.
Figure 4. Attention-based consumer satisfaction evaluation model
Figure 4 illustrates our attention-based consumer satisfaction evaluation model, which comprises of an input layer of consumer behavior data, a dimension reduction and embedding layer, a LSTM network layer, an attention layer, and an output layer of satisfaction evaluation result.
3.2 Evaluation index system (EIS) construction and fuzzification
The factors affecting consumer satisfaction with e-commerce platform were divided into multiple layers according to evaluation indices. The hierarchical EIS contains 20 secondary indices and 5 primary indices.
Layer 1 (Goal layer):
CS={overall consumer satisfaction with e-commerce platform}
Layer 2 (Primary indices):
CS={CS1, CS2, CS3, CS4, CS5}={personalized recommendation contents, service quality, system response, functional completeness, utility}
Layer 3 (Secondary indices):
CS1={CS11, CS12, CS13, CS14, CS15}={content diversity, content attractiveness, content authenticity, content recommendation accuracy, content display comprehensiveness };
CS2={CS21, CS22, CS23, CS24}={consulting response speed, after-sales mode, after-sales personnel service attitude, return speed };
CS3={CS31, CS32}={information transfer capability, information transfer mode};
CS4={CS41, CS42, CS43, CS44, CS45, CS46}={activity page friendliness, operability, query performance, ease of information storage, accessibility, smoothness of complaint channel};
CS5={CS51, CS52, CS53}={system operation efficiency, system resource expansibility, system resource occupation}
In the EIS of consumer satisfaction with e-commerce platform, the correlation intensities between overall satisfaction and primary indices are denoted as S(1)i(i=1, 2, …, n); the importance of primary indices is denoted as φ(1)i(i=1, 2, …, n); the autocorrelation intensities between primary indices is denoted as sjn(i=1, 2, …, n); the correlation intensity between primary index i and secondary index j is denoted as Sij(i =1, 2, …, n; j =1, 2, …, m); the importance of secondary indices is denoted as φ(2)j(j=1, 2, …, m); the satisfaction indices of primary indices are denoted as SA(1)i(i=1, 2, …, n); the consumer satisfaction evaluated by secondary indices is denoted as ERj(j=1, 2, …, m).
After normalization, the correlation intensity S'ij between evaluation indices can be calculated by:
$S_{i j}^{\prime}=\frac{\quad\quad\sum_{l=1}^m S_{i k} S_{k j}}{\quad\quad\sum_{j=1}^m \quad\sum_{l=1}^m S_{i l} s_{k j}},(i=1,2, \ldots ., n ; j=1,2, \ldots, m), \sum_j S_{i j}^{\prime}=1$ (14)
Let S*il be the fuzzy correlation between an index and a factor affecting consumer satisfaction; s*lj be the fuzzy autocorrelation between factors affecting consumer satisfaction. Then, the fuzzy relationship between S*il and s*lj can be expressed as:
$S_{ij}^{*}=\frac{\sum\limits_{l=1}^{m}{{{S}^{*}}_{il}\circ {{s}^{*}}_{lj}}}{\sum\limits_{j=1}^{m}{\sum\limits_{l=1}^{m}{{{S}^{*}}_{il}\circ {{s}^{*}}_{lj}}}},\left( i=1,2,....,n;j=1,2,...,m \right)$ (15)
where, S*il={(Sil, λS~il(Sil))|Sil$\in$S}; s*il={(sil, λs~il(sil))|sil $\in$s} (Sil and sil $\in$[0, 1]). Let S denote the set of correlations between indices and influencing factors, and s denote the set of autocorrelations between influencing factors. To determine the membership function of S*ij, the α-cut set of S*il is described as a discrete interval based on Zadeh’s series expansion:
${{\left( {{S}_{il}} \right)}_{\alpha }}=\left[ \begin{align} & \underset{{{S}_{il}}}{\mathop{min}}\,\left\{ {{S}_{il}}\in S\left| {{\lambda }_{{{S}^{*}}_{il}}} \right.\left( {{S}_{il}} \right)\ge \alpha \right\}, \\ & \underset{{{S}_{il}}}{\mathop{max}}\,\left\{ {{S}_{il}}\in S\left| {{\lambda }_{{{S}^{*}}_{il}}} \right.\left( {{S}_{il}} \right)\ge \alpha \right\} \\\end{align} \right]=\left[ \left( {{S}_{il}} \right)_{\alpha }^{K},\left( {{S}_{il}} \right)_{\alpha }^{V} \right]$. (16)
The discrete interval for the α-cut set of S*il can be given by:
${{\left( {{s}_{il}} \right)}_{\beta }}=\left[ \begin{align} & \underset{{{s}_{il}}}{\mathop{min}}\,\left\{ {{s}_{il}}\in s\left| {{\lambda }_{{{s}^{*}}_{il}}} \right.\left( {{s}_{il}} \right)\ge \beta \right\}, \\ & \underset{{{S}_{il}}}{\mathop{max}}\,\left\{ {{s}_{il}}\in s\left| {{\lambda }_{{{s}^{*}}_{il}}} \right.\left( {{s}_{il}} \right)\ge \beta \right\} \\\end{align} \right]=\left[ \left( {{s}_{il}} \right)_{\beta }^{K},\left( {{s}_{il}} \right)_{\beta }^{V} \right]$ (17)
Let λS*il(Sil) and λs*il(sil) be the membership functions of Sil and sil, respectively. By Zadeh’s series expansion, the membership function of S'ij* can be derived as:
$\lambda_{S^*}\left(S_{i j}^{\prime *}\right)=\sup _{S . s} \min \left\{\lambda_{S_{i l}^*}\left(S_{i l}\right), \lambda_{S_{l j}}\left(s^* l_j\right), \forall l, j \mid S_{i j}^{\prime}=\frac{ \quad\sum_{l=1}^m S_{i l} s_{l j}}{ \quad\quad\sum_{j=1}^m \sum_{l=1}^m S_{i l} s_{l j}}\right\}$ (18)
The membership function of S'ij* can be deduced from the α-cut set of S'ij*. The upper bound (S'ij)Vα and lower bound (S*ij)Kα of the α-cut set of S'ij* can be solved by:
$S_{i j}^{\prime}=\frac{\sum_{l=1}^m S_{i l} s_{l j}}{\sum_{j=1}^m \sum_{l=1}^m S_{i l} S_{l j}}=\frac{\sum_{l=1}^m S_{i l} s_{l j}}{\sum_{j=1}^m \sum_{l=1}^m S_{i l} S_{l j}+\sum_{l=1}^m S_{i l} s_{l j}}$ (19)
where, Sil and sil satisfy inequality 0≤(Sil)Kα≤Sil≤(Sil)Vα≤1, and 0≤(sil)Kα≤sil≤(sil)Vα≤1. Suppose
$\chi =\sum\limits_{l=1}^{m}{{{S}_{il}}{{s}_{lj}}},\delta =\sum\limits_{\begin{smallmatrix} k=1 \\ k\ne l\end{smallmatrix}}^{m}{\sum\limits_{l=1}^{m}{{{S}_{il}}{{s}_{lj}}}}$ (20)
Then, formula (19) can be expressed as:
$g\left( \chi \right)=\frac{\chi }{\delta +\chi }$ (21)
The first-order derivative of g(χ) satisfies:
$g'\left( \chi \right)=\frac{\chi }{{{\left( \delta +\chi \right)}^{2}}}\ge 0$ (22)
Since g'(χ)>0, g(χ) is an increasing function, and χ satisfies:
$\sum\limits_{l}{\left( {{S}_{il}} \right)_{\alpha }^{K}\left( {{s}_{lj}} \right)_{\alpha }^{K}}\le \chi \le \sum\limits_{l}{\left( {{S}_{il}} \right)_{\alpha }^{V}\left( {{s}_{lj}} \right)_{\alpha }^{V}}$ (23)
Thus, the minimum of g(χ) can be obtained:
$min\ g\left( \chi \right)=\frac{\sum\limits_{l=1}^{m}{\left( {{S}_{il}} \right)_{\alpha }^{K}\left( {{s}_{lj}} \right)_{\alpha }^{K}}}{\delta +\sum\limits_{l=1}^{m}{\left( {{S}_{il}} \right)_{\alpha }^{K}\left( {{s}_{lj}} \right)_{\alpha }^{K}}}$ (24)
$max\ g\left( \chi \right)=\frac{\sum\limits_{l=1}^{m}{\left( {{S}_{il}} \right)_{\alpha }^{V}\left( {{s}_{lj}} \right)_{\alpha }^{V}}}{\delta +\sum\limits_{l=1}^{m}{\left( {{S}_{il}} \right)_{\alpha }^{V}\left( {{s}_{lj}} \right)_{\alpha }^{V}}}$ (25)
The upper bound (S'ij)Vα and lower bound (S*ij)Kα of the α-cut set of S'ij* can be respectively expressed as:
$\left(S_{i j}^{\prime *}\right)_\alpha^K=\min g(\chi)=\frac{\sum_{l=1}^m\left(S_{i l}\right)_\alpha^K\left(s_{l j}\right)_\alpha^K}{\sum_{\substack{k=1 \\ k \neq j}}^m \sum_{l=1}^m\left(S_{i l}\right)_\alpha^V\left(s_{l j}\right)_\alpha^V+\sum_{l=1}^m\left(S_{i l}\right)_\alpha^K\left(s_{l j}\right)_\alpha^K}$ (26)
$\left(S_{i j}^*\right)_\alpha=\max g(\chi)=\frac{\sum_{l=1}^m\left(S_{i l}\right)_\alpha^V\left(s_{l j}\right)_\alpha^V}{\sum_{\substack{k=1 \\ k \neq j}}^m \sum_{l=1}^m\left(S_{i l}\right)_\alpha^K\left(s_{l j}\right)_\alpha^K+\sum_{l=1}^m\left(S_{i l}\right)_\alpha^V\left(r_{l j}\right)_\alpha^V}$ (27)
Based on the upper bound (S'ij)Vα and lower bound (S*ij)Kα of the α-cut set of S'ij*, it is possible to evaluate the importance of each index in the EIS.
3.3 Importance calculation
The evaluation model for consumer satisfaction with e-commerce platform can be fuzzy normalized by formulas (26) and (27). After fuzzy normalization of S(1)i and sin (i=1, 2, n), the upper bound (S'ij)Vα and lower bound (S*ij)Kα of the α-cut set of S'ij* can be calculated. If α=1, there exists:
$\sum_{i=1}^n\left(S_i^{\prime^*}\right)_\alpha^K=\sum_{i=1}^n\left(S_i^{\prime *}\right)_\alpha^V=1$ (28)
The importance of primary indices can be calculated by:
$\varphi_i^{*(1)}=\left(S_i^{'*}\right)_\alpha^K=\left(S_i^{'*}\right)_\alpha^V, \alpha=1$ and $\sum_{i=1}^n \varphi_i^{*(1)}=1$ (29)
If α≠1, there exists:
$\left(\varphi_i^{*(1)}\right)_\alpha=\left[\left(S_i^{\prime^*}\right)_\alpha^K,\left(S_i^{\prime *}\right)_\alpha^V\right], i=1,2, \ldots, n$ (30)
In the evaluation model for consumer satisfaction with e-commerce platform, the importance of secondary indices is jointly determined by the fuzzy normalized relationship between primary and secondary indices, and the importance of primary indices φ*(1)i(i =1, 2, …, n). Let S'ij* be the fuzzy normalized relationship between primary index i and secondary index j. Following fuzzy quality function deployment (FQFD), the fuzzy coefficient Q*(2)j(j=1, 2, …, m) of secondary index j can be calculated by:
$Q_j^{*(2)}=\sum_{i=1}^n \varphi_i^{*(1)} \circ S_{i j}^{\prime^*}$ (31)
Under a certain level of α, the upper and lower bounds of the α-cut set of Q*(2)j can be expressed as:
$\left(Q_j^{*(2)}\right)_\alpha=\left[\left(Q_j^{*(2)}\right)_\alpha^K,\left(Q_j^{*(2)}\right)_\alpha^V\right]$
$=\left[\sum_{i=1}^n \phi_i^{*(1)} \circ\left(S_{i j}^*\right)_\alpha^K, \sum_{i=1}^n \phi_i^{*(1)} \circ\left(S_{i j}^{\prime *}\right)_\alpha^V\right]$ (32)
where, Q*(2)j measures the degree of influence of primary index i on secondary index j, i.e., the importance of the secondary index relative to its superior primary index.
3.4 Consumer satisfaction index
In the FQFD model of consumer satisfaction with e-commerce platform, the first step is to compute the mean fuzzy triangular number based on the evaluation results on each row in the secondary index judgement matrix:
$ER_{j}^{*}=\frac{\sum\limits_{i=1}^{n}{\left( {{x}_{ij}},{{y}_{ij}},{{z}_{ij}} \right)}}{n}=\left( \sum\limits_{i=1}^{n}{\frac{{{x}_{ij}}}{n}},\sum\limits_{i=1}^{n}{\frac{{{y}_{ij}}}{n}},\sum\limits_{i=1}^{n}{\frac{{{z}_{ij}}}{n}} \right)$ (33)
Next, the mean fuzzy triangular number ER*j is cross-multiplied with the fuzzy coefficient Q*(2)j of secondary index importance at different levels of α to obtain the consumer satisfaction SA*(1)i (i=1, 2, …, n) with primary indices at different levels of α:
$\begin{align} & {{\left( SA_{i}^{*\left( 1 \right)} \right)}_{\alpha }}=\sum\limits_{j=1}^{m}{E{{R}^{*}}_{ij}}\circ {{\left( Q_{j}^{*\left( 2 \right)} \right)}_{\alpha }} \\ & =\left[ \sum\limits_{j=1}^{n}{\left( E{{R}^{*}}_{ij} \right)_{\alpha }^{K}}\circ \left( Q_{j}^{*\left( 2 \right)} \right)_{\alpha }^{K},\sum\limits_{j=1}^{n}{\left( E{{R}^{*}}_{ij} \right)_{\alpha }^{V}}\circ \left( Q_{j}^{*\left( 2 \right)} \right)_{\alpha }^{V} \right] \\\end{align}$ (34)
The mean fuzzy triangular number ER*j can be written in the form of an α-cut set:
$\begin{align} & ER_{ij}^{*}=\left[ \left( E{{R}^{*}}_{ij} \right)_{\beta }^{K},\left( E{{R}^{*}}_{ij} \right)_{\beta }^{V} \right] \\ & =\left[ {{f}_{ij}}+\left( {{r}_{ij}}-{{f}_{ij}} \right)\beta ,S{{A}_{ij}}-\left( S{{A}_{ij}}-{{f}_{ij}} \right)\beta \right],\forall \beta \in \left[ 0,1 \right] \\\end{align}$ (35)
After that, the SA*(1)i is multiplied with the importance (φ*(1)i)α(i=1, 2, …, n) of a primary index at the corresponding level of α. The products are added up into the overall consumer satisfaction (TS)α at different levels of α:
${{\left( TS \right)}_{\alpha }}=\sum\limits_{i=1}^{n}{{{\left( \phi _{i}^{\left( 1 \right)} \right)}_{\alpha }}}\otimes {{\left( SA_{i}^{*\left( 1 \right)} \right)}_{\alpha }},i=1,2,...,n$ (36)
By the EM clustering method of Gaussian mixture model, this paper extracts the BR records of active consumers on e-commerce platform from November to December, 2020. The consumer behavior records in each unit period were expressed as a G×H-dimensional vector, where G is the number of days in the fixed period, and H is the number of labels of the product. Then, the consumer behavior matrix was clustered. The periods when consumers follow the same consumption mode were clustered into one class, aiming to effectively differentiate between the behavior features of consumers on different levels of activity. Figure 5 shows the clustering results of consumer behaviors.
As shown in Figure 5, the BR frequencies were close within each class of behavior features, and dispersed between different classes. The behavior features extracted from holidays differed from those extracted from non-holidays: the consumption activity on holidays was higher than that on non-holidays.
Figure 5. Clustering results of consumer behaviors
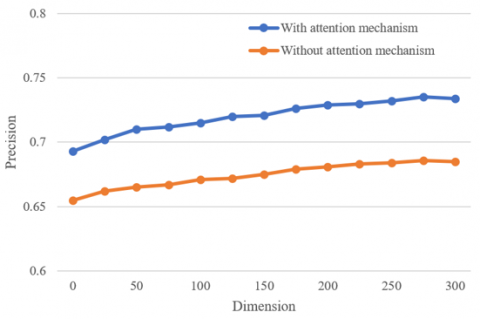
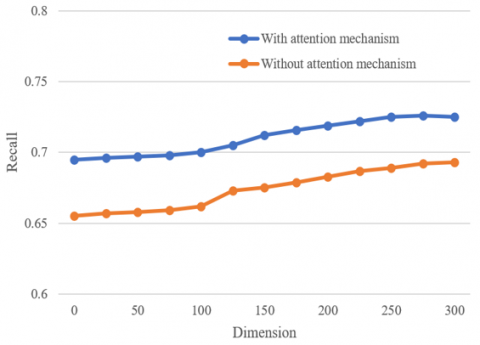
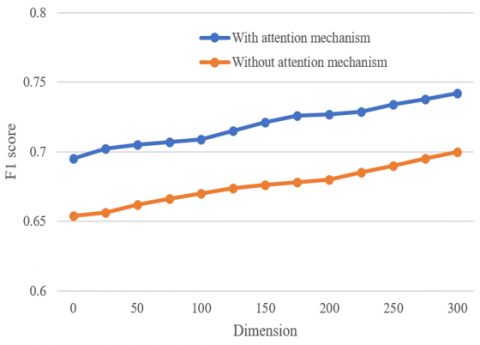
Our evaluation model for consumer satisfaction with e-commerce platform was realized based on machine learning library PyTorch. The batch size and learning rate of the model were set to 32 and 0.01, respectively. The optimal solution was searched for by the adaptive moment estimation algorithm. The e-commerce platform consumption dataset involves 25,145 products. The embedding dimension was set to 13 values between 0 and 320. Besides, the output of the embedding layer was imported to RNN and LSTM network, respectively, for network training. Figures 6-8 report the precisions, recalls, and F1 scores of evaluation models with different embedding dimensions, respectively.
As shown in Figures 6-8, the evaluation models with or without attention mechanism witnessed the improvement of evaluation effect and performance with the growth of the embedding dimension. Judging by any of the three metrics (precision, recall, and F1 score), the attention-based prediction model was better than the original model.
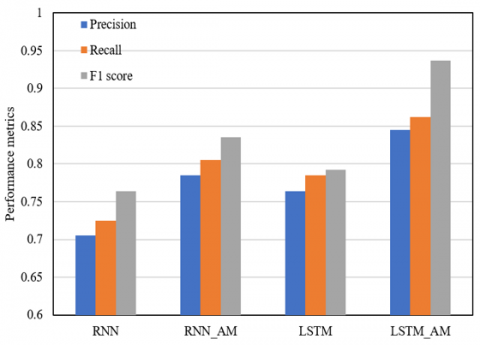
Figure 9 compares the prediction performance metrics of different evaluation models. To acquire the accurate features of consumption behaviors, our model was founded on LSTM network, which is a special structure of RNN, and the attention mechanism. As shown in Figure 9, our model achieved better prediction of consumer satisfaction than traditional RNN, traditional LSTM, and the RNN with attention mechanism. The prediction accuracy of our model was as high as 84.5%.
Figure 6. Precisions of evaluation models with different embedding dimensions
Figure 7. Recalls of evaluation models with different embedding dimensions
Figure 8. F1 scores of evaluation models with different embedding dimensions
Figure 9. Prediction performance of different evaluation models
The fuzzy values of consumer satisfaction indices could be calculated for primary indices (Table 1). The consumer satisfaction indices in Table 1 were imported to our model, and the fuzzy overall consumer satisfaction could be derived for e-commerce platform consumers at each level of α, using formula (36). The calculation results are shown in Table 2.
Table 1. Consumer satisfaction indices of primary indices
|
Secondary indices and their importance |
Primary indices |
|||||
|
CS1 |
CS2 |
CS3 |
CS4 |
CS5 |
||
|
CS11 |
0.0632 |
0.6724 |
|
|
|
|
|
CS12 |
0.0854 |
0.6821 |
|
|
|
|
|
CS13 |
0.0215 |
0.7396 |
|
|
|
|
|
CS14 |
0.0236 |
0.6142 |
|
|
|
|
|
CS15 |
0.0973 |
0.6789 |
|
|
|
|
|
CS21 |
0.1571 |
|
0.6176 |
|
|
|
|
CS22 |
0.3678 |
|
0.6531 |
|
|
|
|
CS23 |
0.1267 |
|
0.6478 |
|
|
|
|
CS24 |
0.0325 |
|
0.6392 |
|
|
|
|
CS31 |
0.0408 |
|
|
0.7131 |
|
|
|
CS32 |
0.0362 |
|
|
0.6042 |
|
|
|
CS41 |
0.0375 |
|
|
|
0.5328 |
|
|
CS42 |
0.0329 |
|
|
|
0.6492 |
|
|
CS43 |
0.0571 |
|
|
|
0.6747 |
|
|
CS44 |
0.0523 |
|
|
|
0.6375 |
|
|
CS45 |
0.0465 |
|
|
|
0.7592 |
|
|
CS46 |
0.0674 |
|
|
|
0.6508 |
|
|
CS51 |
0.0238 |
|
|
|
|
0.6376 |
|
CS52 |
0.0842 |
|
|
|
|
0.6542 |
|
CS53 |
0.0542 |
|
|
|
|
0.5987 |
|
Satisfaction with primary indices |
0.1723 |
0.1894 |
0.1676 |
0.1835 |
0.1842 |
|
Table 2. Overall satisfaction TS of e-commerce platform consumers
|
α=1 |
(TS)α=1 |
|||||
|
Primary indices |
CS1 |
CS2 |
CS3 |
CS4 |
CS5 |
|
|
φ(1)i |
0.213 |
0.267 |
0.219 |
0.245 |
0.245 |
0.172 |
|
SA(1)i |
0.184 |
0.167 |
0.136 |
0.143 |
0.143 |
|
|
α=0.5 |
(TS)α=0.5 |
|||||
|
φ(1)i |
[0.236, 0.348] |
[0.213, 0.387] |
[0.183, 0.375] |
[0.127, 0.236] |
[0.143, 0.222] |
[0.076, 0.403] |
|
SA(1)i |
[0.112, 0.379] |
[0.103, 0.273] |
[0.067, 0.273] |
[0.085, 0.386] |
[0.093, 0.374] |
|
|
α=0 |
(TS)α=0 |
|||||
|
φ(1)i |
[0.217, 0.437] |
[0.194, 0.376] |
[0.063, 0.328] |
[0.136, 0.396] |
[0.117, 0.385] |
[0.037, 0.796] |
|
SA(1)i |
[0.051, 0.573] |
[0.052, 0.423] |
[0.037, 0.419] |
[0.041, 0.575] |
[0.094, 0.612] |
|
This paper investigates the evaluation model and influencing factors of consumer satisfaction with e-commerce platform. Specifically, the behavior features of similar consumers were clustered, the evaluation indices were referred to divide the factors affecting the consumer satisfaction with e-commerce platform into different layers, and a consumer satisfaction evaluation model was constructed based on attention mechanism. Then, experiments were carried out to cluster consumer behaviors. The results verify the difference between feature classes of consumer behaviors on e-commerce platform. In addition, the precisions, recalls, and F1 scores of evaluation models with different embedding dimensions were compared, and the prediction performance metrics of these models were contrasted. The comparison demonstrates the superiority of our model in the prediction of consumer satisfaction with e-commerce platform. Finally, the fuzzy overall satisfaction of e-commerce platform consumers was obtained at each level of α.
[1] Alibasic, A., Popovic, T. (2021). Applying natural language processing to analyze customer satisfaction. In 2021 25th International Conference on Information Technology (IT), pp. 1-4. https://doi.org/10.1109/IT51528.2021.9390111
[2] Wang, J.N., Du, J., Chiu, Y.L., Li, J. (2018). Dynamic effects of customer experience levels on durable product satisfaction: Price and popularity moderation. Electronic Commerce Research and Applications, 28: 16-29. https://doi.org/10.1016/j.elerap.2018.01.002
[3] Hamidi, H., Safareeyeh, M. (2019). A model to analyze the effect of mobile banking adoption on customer interaction and satisfaction: A case study of m-banking in Iran. Telematics and Informatics, 38: 166-181. https://doi.org/10.1016/j.tele.2018.09.008
[4] Tomic, B., Brkic, V.K.S. (2019). Customer satisfaction and ISO 9001 improvement requirements in the supply chain. The TQM Journal. The TQM Journal, 31(2): 222-238. https://doi.org/10.1108/TQM-07-2017-0072
[5] Alexander, D., Boone, C., Lynn, M. (2021). The effects of tip recommendations on customer tipping, satisfaction, repatronage, and spending. Management Science, 67(1): 146-165. https://doi.org/10.1287/mnsc.2019.3541
[6] Juliana, Pramezwary, A., Lemy, D.M., Pramono, R., Djakasaputra, A., Purwanto, A. (2022). Hotel performance in the digital era: roles of digital marketing, perceived quality and trust. Journal of Intelligent Management Decision, 1(1): 36-45. https://doi.org/10.56578/jimd010105
[7] Fargnoli, M., Costantino, F., Di Gravio, G., Tronci, M. (2018). Product service-systems implementation: A customized framework to enhance sustainability and customer satisfaction. Journal of Cleaner Production, 188: 387-401. https://doi.org/10.1016/j.jclepro.2018.03.315
[8] Filina-Dawidowicz, L., Gajewska, T. (2018). Customer satisfaction in the field of comprehensive service of refrigerated containers in seaports. Periodica Polytechnica Transportation Engineering, 46(3): 151-157. https://doi.org/10.3311/PPtr.10824
[9] Mu, R., Zheng, Y., Zhang, K., Zhang, Y. (2021). Research on Customer Satisfaction Based on Multidimensional Analysis. International Journal of Computational Intelligence Systems, 14(1): 605-616. https://doi.org/10.2991/ijcis.d.210114.001
[10] Sivathanu, B. (2019). An empirical study of service quality, value and customer satisfaction for on-demand home services. International Journal of Information Systems in the Service Sector (IJISSS), 11(4): 35-57. https://doi.org/10.4018/IJISSS.2019100103
[11] Vanhanen, J., Lehtinen, T.O., Lassenius, C. (2018). Software engineering problems and their relationship to perceived learning and customer satisfaction on a software capstone project. Journal of Systems and Software, 137: 50-66. https://doi.org/10.1016/j.jss.2017.11.021
[12] Ebrahimi, S.B. (2018). A bi-objective model for a multi-echelon supply chain design considering efficiency and customer satisfaction: A case study in plastic parts industry. The International Journal of Advanced Manufacturing Technology, 95(9): 3631-3649. https://doi.org/10.1007/s00170-017-1437-0
[13] Gaudenzi, B., Confente, I., Russo, I. (2020). Logistics service quality and customer satisfaction in B2B relationships: A qualitative comparative analysis approach. The TQM Journal, 33(1): 125-140. https://doi.org/10.1108/TQM-04-2020-0088
[14] Rastegar, M. (2018). Impacts of residential energy management on reliability of distribution systems considering a customer satisfaction model. IEEE Transactions on Power Systems, 33(6): 6062-6073. https://doi.org/10.1109/TPWRS.2018.2825356
[15] Rew, D., Jung, J., Lovett, S. (2020). Examining the relationships between innovation, quality, productivity, and customer satisfaction in pure service companies. The TQM Journal, 33(1): 57-70. https://doi.org/10.1108/TQM-10-2019-0235
[16] Tseng, C.C., Lin, S.W. (2018). Integrating Kano and quality function deployment into improving the customer satisfaction of Taoyuan international airport. Journal of Quality, 25(5): 289-309.
[17] Nam, K., Seong, N. (2021). A study on influencing factors for customer satisfaction and the continuing use of social network services in financial industry. Enterprise Information Systems, 15(3): 395-419. https://doi.org/10.1080/17517575.2020.1739342
[18] Liang, D., Dai, Z., Wang, M. (2021). Assessing customer satisfaction of O2O takeaway based on online reviews by integrating fuzzy comprehensive evaluation with AHP and probabilistic linguistic term sets. Applied Soft Computing, 98: 106847. https://doi.org/10.1016/j.asoc.2020.106847
[19] Soltanpour, A., Mesbah, M., Habibian, M. (2020). Customer satisfaction in urban rail: A study on transferability of structural equation models. Public Transport, 12(1): 123-146. https://doi.org/10.1007/s12469-019-00223-y
[20] Zhang, J., Zhang, J., Zhang, M. (2019). From free to paid: Customer expertise and customer satisfaction on knowledge payment platforms. Decision Support Systems, 127: 113140. https://doi.org/10.1016/j.dss.2019.113140
[21] Mariani, M., Di Fatta, G., Di Felice, M. (2018). Understanding customer satisfaction with services by leveraging big data: the role of services attributes and consumers’ cultural background. IEEE Access, 7: 8195-8208. https://doi.org/10.1109/ACCESS.2018.2887300
[22] Ayodeji, Y., Rjoub, H. (2021). Investigation into waiting time, self‐service technology, and customer loyalty: The mediating role of waiting time in satisfaction. Human Factors and Ergonomics in Manufacturing & Service Industries, 31(1): 27-41. https://doi.org/10.1002/hfm.20867
[23] Dampage, U., Egodagamage, D.A., Waidyaratne, A.U., Dissanayaka, D.A.W., Senarathne, A.G.N.M. (2021). Spatial Augmented Reality Based Customer Satisfaction Enhancement and Monitoring System. IEEE Access, 9: 97990-98004. https://doi.org/10.1109/ACCESS.2021.3093829
[24] Park, J. (2020). Framework for sentiment-driven evaluation of customer satisfaction with cosmetics brands. IEEE Access, 8: 98526-98538. https://doi.org/10.1109/ACCESS.2020.2997522
[25] Slack, N.J., Singh, G. (2020). The effect of service quality on customer satisfaction and loyalty and the mediating role of customer satisfaction: Supermarkets in Fiji. The TQM Journal. 32(3): 543-558. https://doi.org/10.1108/TQM-07-2019-0187
[26] Yakubu, H., Kwong, C.K., Lee, C.K. (2021). A multigene genetic programming-based fuzzy regression approach for modelling customer satisfaction based on online reviews. Soft Computing, 25(7): 5395-5410. https://doi.org/10.1007/s00500-020-05538-8