Kommana Swathi* | Subrahmanyam Kodukula
© 2022 IIETA. This article is published by IIETA and is licensed under the CC BY 4.0 license (http://creativecommons.org/licenses/by/4.0/).
OPEN ACCESS
In the medical field, gene selection is critical, and it has the ability to diagnose diseases at an early stage. Data imbalance and poor feature selection performance are limitations in current techniques. Hyperband optimization is proposed in this paper to increase the performance of the XGBoost classifier. The NCBI gene dataset is utilised to evaluate the developed technique's performance in gene selection. The normalization procedure is used to scale the input data and decrease data discrepancies. When the Principal Component Analysis (PCA) method is used on input data to choose important features for classification, the independence variable becomes more difficult to interpret. To execute the gene selection for disease diagnosis, the selected features are applied to the XGBoost classifier. The hyperband optimization method searches in a distributed fashion to increase parameter exploration. The accuracy of the XGB-PCA-HO approach is 97.06%, XGB is 88.24%, and Random Forest is 85.29%.
hyperband optimization, NCBI gene dataset, normalization, principal component analysis, XGBoost classifier
Early and accurate cancer prediction helps determine the best treatment option, and DNA microarray technology has shown considerable promise in cancer diagnosis and categorization. Tens of thousands of gene expressions are commonly recorded from each biological sample in cancer datasets gathered with microarray technology [1]. In DNA microarray datasets, tumor classification based on gene expression profiles has garnered a lot of attention, and gene selection plays an important role in improving microarray data classification performance [2]. One of the most difficult difficulties in microarray data analysis is gene selection as a key data preparation strategy for cancer classification. To find the optimum features for gene classification in detecting the lung cancer selection of optimum gene features was the main objective. The goal is to produce the most representative gene subset with the highest level of resolution by removing redundant and irrelevant genes [3]. In gene expression, two types of data reduction exist: relevant and redundant data reduction. Genes and label data are valued in terms of class labels, which are proportionate to a gene's importance in the classification process [4]. There are three types of gene selection methods: (1) filter, (2) wrapper, and (3) hybrid. Rather of considering each gene separately, filter-based approaches select genes based on the overall features of the data. Wrapper approaches, on the other hand, look at gene-to-gene relationships and use a classification model to rate the different gene subsets before selecting the most promising [5].
For analyzing biological data, machine learning has proven to be a highly successful tool. It has primarily been employed in the previous two decades in a range of biological sciences fields. The building of prediction models is one of the most fascinating applications of machine learning [6]. Many genes in high-dimensional gene expression data are likely to be irrelevant, and there is a strong link between them. The accuracy of several categorization systems has been demonstrated to improve with gene selection [7]. Several contemporary approaches were employed to apply gene selection for disease classification. Existing methods have drawbacks such an unbalanced dataset, a small sample size, and overfitting [8-10].
The literature review is found in Section 2, the proposed approach is explained in Section 3, the findings are presented in Section 4, and the conclusion is presented in Section 5.
Gene selection approach has recently been utilized for cancer categorization for early diagnosis, and this is a hot study area. Many studies for cancer categorization based on gene selection have been conducted, and some of the most noteworthy methods are reviewed in this section.
Huang et al. [11] combined data from the Cancer Linker Degree (CLD), the weighted Domain Frequency Score (DFS), the Domain-Domain Interaction (DDI), and the Protein-Protein Interaction (PPI) for gene classification and cancer prediction (PPI). Individual methods, coupled methods, and combinations of identical sorts of methods for prediction were used. In terms of prediction, the created machine learning with voting method outperforms the current method. The weighted DFS technique measures the probability of domain occurrence in non-cancer and cancer proteins in an adaptive way. The performance of the feature selection approach is poor, which leads to an overfitting problem in the machine learning method.
Using microarray data, Azzawi et al. [12] used a Gene Expression Programming (GEP)-based algorithm to predict lung cancer. Two gene selection strategies for extracting relevant genes in lung cancer are proposed, as well as distinct prediction models based on the gene selection methods. The radial basis function neural network, multi-layer perceptron, and support vector machine were employed to make the predictions. The presented method outperforms other methods when it comes to gene prediction. The developed technique performs poorly with missing datasets, which has an impact on prediction performance.
For estimating gene coefficient, a proposed L1 In high-dimensional cancer classification, a logistic regression model for gene prediction was provided by Wu et al. [13]. The selection of genes is dependent on L1 and does not have oracle properties. The L1 logistic regression method was tested in gene prediction using a DNA-based microarray dataset. To tackle the overfitting problem, small sample size, and high-dimensional data, the gene selection approach is used in cancer classification. The performance of the created technique was tested using datasets such as GSE10072, GSE19084, and GSE4115. When compared to existing gene selection approaches, the new method outperforms them. In terms of prediction, the created technique has a worse performance in the imbalance dataset.
In order to classify diseases, Li and Liu [14] used a regularized logistic regression method to select genes from gene expressed data. To properly choose the gene for classification, the seven penalty was employed in regularized logistic regression approach. The performance of the developed approach in classification was tested using several datasets. The SCAD, L1/2, lasso, and elastic net were used as penalties to improve the classification's performance. On gene selection, a functional enrichment analysis is performed, and logistic regression is constructed to increase the model's performance. In terms of gene selection, the suggested strategy outperforms previous methods. In disease categorization, the developed technique has an overfitting problem.
A hybrid wrapper technique that combines the Gravitational Search Algorithm (GSA) and Teaching Learning Based Optimization (TLBO) has been developed for gene categorization [15]. For the continuous search space, a novel encoding approach is used. In the gene expression dataset, feature selection was done using the minimum redundancy maximum relevance method. In the teaching phase, the gravitational search strategy is utilized to improve the evolution process's search power. For the fitness function, the Nave Bayes model is utilized to choose the gene in cancer classification. The biological datasets were utilized to evaluate the created method's performance and compare it to other approaches. The new approach has a lower convergence rate and is more prone to trapping in local optima.
The hyperband optimization strategy in the XGBoost classifier was used in this study to increase the classifier's performance in gene selection. The performance of categorization was tested using the NCBI dataset of gene expression. The normalization procedure is used to scale the data and reduce the disparity in the data. The PCA approach chooses the relevant features for gene categorization, reducing the interpretability of the independent variable. Figure 1 depicts the block diagram of the proposed XGB-PCA-HO technique.
Figure 1. Proposed XGB-PCA-HO method in gene classification
3.1 Principal Component Analysis (PCA)
PCA is a technique for reducing data dimensions [16-18]. The PCA has been widely used in a variety of sectors because to its simplicity and ease of understanding, as well as the fact that it has no parameter constraints. The PCA's main goal is to convert n-dimensional characteristics into k-dimensional ones ($k \leq n$). Primary components are k-dimensional qualities that are rebuilt from n-dimensional input. The PCA's main goal is to decrease data redundancy while retaining as much information as feasible in order to meet the goal of dimension reduction.
The following are the steps of the PCA:
Step1: Find the sample mean of the $\mathrm{n}$-dimensional data set $X$, where $X=\left\{x_1, x_2, \ldots, x_m\right\}$.
$\alpha=\frac{1}{m} \sum_{i=1}^m x_i$ (1)
where, m denotes the total number of samples i= 1, m, and $\alpha$ denotes the sample mean found.
Step 2: Calculate the sample set's covariance matrix using the produced sample mean.
$C=\frac{1}{m} \sum_{i=1}^m\left(x_i-\alpha\right)\left(x_i-\alpha\right)^T$ (2)
C stands for the sample set's covariance matrix.
Step 3: Calculate the sample covariance matrix's feature values and feature vectors.
$C=Q \cdot \sum \cdot Q^T$ (3)
$\sum=\operatorname{diag}\left(\lambda_1, \lambda_2, \ldots, \lambda_n\right) \lambda_1 \geq \lambda_2 \geq \cdots \geq \lambda_2 \geq 0$ (4)
$Q=\left[q_1, q_2, \ldots, q_n\right]$ (5)
where, Q is the feature matrix formed of the matching feature vector qi of the feature value $\lambda_i, i=1, \ldots, n$, and $\sum$ is the organized diagonal matrix of n feature values of the covariance matrix in descending order.
Step 4: Calculate the cumulative variance contribution rate of the first k-row primary elements using the feature values and feature vectors acquired.
$\theta=\sum_{i=1}^k \lambda_i / \sum_{j=1}^m \lambda_j$ (6)
where, $\theta$ is cumulative variance contribution rate of the former k-row principal elements, and the value of $\theta$ is usually greater than or equal to 0.9.
Step 5: Utilize the obtained k-row feature vector to complete the dimension reduction.
$P=Q_k$ (7)
$Y=P . X$ (8)
where, $P$ is a feature matrix, which is composed of corresponding feature vectors of the first k-row feature values $(k \leq n) . Q_k$ is a feature matrix, which is composed of the first k-row feature values $(k \leq n)$. And $Y$ is the $\mathrm{k}$-dimensional data.
3.2 Hyperband optimization
The basic idea behind Hyperband is to devote more resources to hyperparameter combinations that are more promising. It begins by creating a set of n trial points (each trial point corresponding to one hyperparameter configuration). Then it uniformly assigns a budget to each trial point and assesses its performance (i.e., objective function) against that budget. Below is a diagram of the hyperband optimization algorithm.
|
Algorithm: Hyper parameter optimization |
|
Input: Single hyper-parameter configuration $R$, and proportion controller $\eta$ Output: one hyper-parameter configuration Initialization: $s_{\max }=\left\lfloor\log _\eta(R)\right\rfloor, B=\left(s_{\max }+1\right) R$ For $s \in\left\{s_{\max }, s_{\max }-1, \ldots, 0\right\}$ do $n=\left[\frac{B}{R}\left(\frac{\eta^s}{s+1}\right)\right], r=R \eta^{-s}$ $X=$ get_hyperparameter_configuration $(n)$ for $i \in 0, \ldots, s$ do $n_i=\left\lfloor n \eta^{-i}\right\rfloor$ $n_i=\left\lfloor n \eta^{-i}\right\rfloor$ $r_i=r \eta^i$ $F=\left\{\right.$ run_then_return_obj_val $\left.\left(x, r_i\right): x \in X\right\}$ $X=$ top_k $\left(X, F,\left\lfloor n_i / \eta\right\rfloor\right)$ return the configuration with the highest value of the objective function |
3.3 XGBoost algorithm
XGBoost method is a machine learning method that consists of a sequence of weak predictors [19, 20]. The gradient boosting approach is the foundation of this method. Iterative tree estimation with residuals obtained at each step and adaptive estimate updates is what gradient boosting is all about. Gradient boosting uses the gradient descent approach to split the favorites and minimize the objective function's point.
The XGBoost optimization is compared with gradient boosting due to regularization to avoid bias and overfitting, missing values management, tree pruning operations, parallel and distribution computing use, and its scalability.
The variables $x_i$ is a set of values in input data and predict the variable $y_i$, as given in Eq. (9).
$\left\{\left(x_i-y_i\right)\right\}_{i=1}^n$ (9)
This consists of training dataset; the model predicts the variable value $y_i$ based on variable $x_i$ to characterize multiple features. The predicted value is $\widehat{y}_l=\sum_j \theta_j x_{i j}$ is used in a linear regression problem, where weight of $x_j$ is denoted as $\theta_j$. The model parameters are denoted as $\theta$ in a generic problem.
The objective function measures model ability to fit training data that consists of two terms, as given in Eq. (10).
$\operatorname{Obj}(\theta)=L(\theta)+\Omega(\theta)$ (10)
where, regularization term is denoted as $\Omega(\theta)$ and training loss function is denoted as $L(\theta)$. The prediction is evaluated using differentiable function of loss function. The regularization term helps to control model complexity and avoid overfitting.
The loss function of Taylor expansion is used in XGBoost to design objective function, as given in Eq. (11).
$\operatorname{Obj}(\theta)=\sum_{i=1}^n\left[g_i f_t\left(x_i\right)+\frac{1}{2} h_i f_t^2\left(x_i\right)\right]+\Omega\left(f_t\right)$ (11)
where, $g_i=\partial_{\widehat{y}_l}^{t-1} L\left(y_i, \widehat{y}_l^{t-1}\right)$, while $h_i=\partial_{\hat{y}^{t-1}}^2 L\left(y_i, \hat{y}_i^{t-1}\right)$. The following quantities are defined, as given in Eq. (12) to (14).
$G_j=\sum_{i \in I_j} g_i$ (12)
$H_j=\sum_{i \in I_j} h_i$ (13)
$I_j=\left\{i \mid q\left(x_i\right)=j\right\}$ (14)
The $j$-th leaf optimal weight value is denoted as $\theta_j=-\left(\frac{G_j}{H_j+\lambda}\right)$ that returns the leaf index itself. The $j$-th leaf instance set is denoted as $I_j$ and mapping function of data instance into tree leaf. The model optimizes based on objective function is given in Eq. (15).
$O b j=-\frac{1}{2} \sum_{j=1}^T \frac{G_j^2}{H_j+\lambda}+\gamma T$ (15)
where, characterize of tree leaves is denoted as T.
The algorithm computation cost is due to all tree training in simultaneous. The split candidate evaluates based on gain function, is given as in Eq. (16).
$Gain =\frac{G_L^2}{H_L+\lambda}+\frac{G_R^2}{H_R+\lambda}-\frac{G_P^2}{H_P+\lambda}$ (16)
where, left nodes (subscript L) are contributed based on first term, the right nodes (subscript R) is contributed based on second term, the parent leaf node (subscript P) is contributed by the last term. The greatest gain of split condition is selected and pruning method is used to optimize a tree level to reduce overfitting.
In this study, the hyperband optimization strategy is applied to improve the XGBoost classifier's gene selection classification performance. Using NCBI genes such as GSE10072, GSE19084, and GSE4115, the performance of the proposed technique in gene selection was assessed. To extract important features from the input dataset and apply them to the XGBoost classifier, the PCA approach is used. Using the Hyperband optimization method, the XGBoost classifier parameter is fine-tuned.
Table 1 compares and contrasts the existing and proposed gene classification techniques of TN, TP, FN, and FP. This demonstrates that the suggested strategy outperforms existing gene categorization methods. Random Forest outperforms SVM and Neural Network.
Table 2 compares the proposed XGB-PCA-HO methodology to known approaches like support vector machine, random forest, neural networks etc., for gene classification. The proposed XGB-PCA-HO strategy surpasses previous methods in terms of accuracy, sensitivity, specificity, precision, recall, and F-measurement which are measured as a growth percentage. To increase classification performance, the hyperband optimization approach chooses the appropriate parameter settings for the XGBoost method. To optimize the exploration of the process, the search procedure for hyperband optimization is distributed evenly. The hyperparameter setup aids in the improvement of the created method's gene classification ability. The SVM method is limited by the problem of imbalanced data in classification. When the number of trees is little, the Random Forest technique has the limitation of overfitting, and when the number of trees is high, the method has instable performance.
Table 1. Metrics of proposed method
|
TN |
TP |
FN |
FP |
|
|
Logistic Regression |
1 |
11 |
9 |
13 |
|
Naive Bayes |
1 |
13 |
7 |
13 |
|
K-Means |
1 |
15 |
5 |
13 |
|
SVM |
7 |
19 |
1 |
7 |
|
Neural Network |
9 |
18 |
2 |
5 |
|
Random forest |
12 |
17 |
3 |
2 |
|
XGB-GS |
13 |
17 |
2 |
2 |
|
XGB-PCA |
13 |
18 |
2 |
1 |
|
XGB-PCA- HO |
13 |
20 |
1 |
0 |
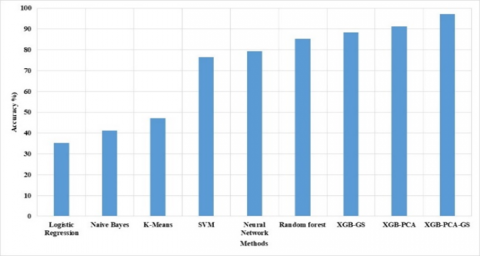
Figure 2 compares the proposed XGB-PCA-HO method to known gene categorization methods. The suggested XGB-PCA-HO approach benefits from hyperparameter optimization via hyperband optimization. The hyperband optimization method performs the search process in equal distributed manner that helps to improve the exploration process. The PCA method reduces the overfitting process in the training and independent variables are less interpretable. The proposed XGB-PCA-HO method has accuracy of 97.06% and existing random forest has 85.29% accuracy.
Figure 2. Accuracy of the proposed XGB-PCA-HO method
Figure 3. Sensitivity of proposed XGB-PCA-GS method
Figure 4. Specificity of proposed XGB-PCA-HO method
Table 2. Performance analysis of proposed method
|
Methods |
Accuracy |
Sensitivity |
Specificity |
Precision |
Recall |
F-measure |
|
Logistic Regression |
35.29 |
55.00 |
7.14 |
45.83 |
55.00 |
50.00 |
|
Naive Bayes |
41.18 |
65.00 |
7.14 |
50.00 |
65.00 |
56.52 |
|
K-Means |
47.06 |
75.00 |
7.14 |
53.57 |
75.00 |
62.50 |
|
SVM |
76.47 |
95.00 |
50.00 |
73.08 |
95.00 |
82.61 |
|
Neural Network |
79.41 |
90.00 |
64.29 |
78.26 |
90.00 |
83.72 |
|
Random forest |
85.29 |
85.00 |
85.71 |
89.47 |
85.00 |
87.18 |
|
XGB-GS |
88.24 |
89.47 |
86.67 |
89.47 |
89.47 |
89.47 |
|
XGB-PCA |
91.18 |
90.00 |
92.86 |
94.74 |
90.00 |
92.31 |
|
XGB-PCA- HO |
97.06 |
95.24 |
100.00 |
100.00 |
95.24 |
97.56 |
The proposed XGB-PCA-HO method and existing method sensitivity were measured, as shown in Figure 3. The sensitivity is important metrics due to its measures the classification performance related to class. The proposed method has higher sensitivity due to its selection of features and parameter setting in classification. To improve the exploration of the parameter search process, the hyperband optimization approach runs the search process in a distributed manner. The suggested XGB-PCA-HO approach has a sensitivity of 95.24%, while the existing random forest method has a sensitivity of 85.71%.
Figure 4 compares the specificity of the proposed XGB-PCA-HO approach with that of existing methods. In comparison to existing gene selection methods, the suggested method has a high specificity. The proposed method has the advantage of allowing you to choose your hyperparameters depending on hyperband optimization. The suggested XGB-PCA-HO approach has a specificity of 99.99%, while the existing random forest method has a specificity of 85.71%.
Gene selection method has the ability to diagnose diseases at an early stage, which is a difficult task. Existing techniques have limitations in terms of data imbalance and feature selection efficiency. To increase classification performance, the hyperband optimization strategy is developed in this study for the XGBoost classifier. To optimize the exploration process for parameter settings, the hyperband optimization approach searches in a dispersed manner. This aids in the selection of the classifier's parameter to avoid overfitting and overcome the imbalance problem. The proposed XGB-PCA-HO approach is 97.06% accurate, while random forest is 85.29% accurate. The proposed method's future development entails using an LSTM-based method to analyze massive gene datasets.
|
Subscripts |
|
|
n |
Size of data set before reduction |
|
k |
Size of data set after reduction |
|
TN |
True negatives |
|
TP |
True positives |
|
FN |
False negatives |
|
FP |
False positives |
|
Greek symbols |
|
|
$\alpha$ |
Mean of n-dimensional data |
|
$\theta$ |
Feature vector |
[1] Jain, I., Jain, V.K., Jain, R. (2018). Correlation feature selection based improved-binary particle swarm optimization for gene selection and cancer classification. Applied Soft Computing, 62: 203-215. https://doi.org/10.1016/j.asoc.2017.09.038
[2] Sun, L., Kong, X., Xu, J., Zhai, R., Zhang, S. (2019). A hybrid gene selection method based on ReliefF and ant colony optimization algorithm for tumor classification. Scientific Reports, 9(1): 1-14. https://doi.org/10.1038/s41598-019-45223-x
[3] Sun, L., Zhang, X.Y., Qian, Y.H., Xu, J.C., Zhang, S.G. Tian, Y. (2019). Joint neighborhood entropy-based gene selection method with fisher score for tumor classification. Applied Intelligence, 49(4): 1245-1259. https://doi.org/10.1007/s10489-018-1320-1
[4] Huang, X., Zhang, L., Wang, B., Li, F., Zhang, Z. (2018). Feature clustering-based support vector machine recursive feature elimination for gene selection. Applied Intelligence, 48(3): 594-607. https://doi.org/10.1007/s10489-017-0992-2
[5] Rani, M.J., Devaraj, D. (2019). Two-stage hybrid gene selection using mutual information and genetic algorithm for cancer data classification. Journal of Medical Systems, 43(8): 1-11. https://doi.org/10.1007/s10916-019-1372-8
[6] Dashtban, M., Balafar, M., Suravajhala, P. (2018). Gene selection for tumor classification using a novel bio-inspired multi-objective approach. Genomics, 110(1): 10-17. https://doi.org/10.1016/j.ygeno.2017.07.010
[7] Algamal, Z.Y., Lee, M.H. (2019). A two-stage sparse logistic regression for optimal gene selection in high-dimensional microarray data classification. Advances in Data Analysis and Classification, 13(3): 753-771.
[8] Hamamoto, R., Komatsu, M., Takasawa, K., Asada, K., Kaneko, S. (2020). Epigenetics analysis and integrated analysis of multiomics data, including epigenetic data, using artificial intelligence in the era of precision medicine. Biomolecules, 10(1): 62-62. https://doi.org/10.3390%2Fbiom10010062
[9] Pes, B. (2021). Learning from High-Dimensional and Class-Imbalanced Datasets Using Random Forests. Information, 12(8): 286-286. https://doi.org/10.3390/info12080286
[10] Bilen, M., Işik, A.H., Yiğit, T. (2020). A New Hybrid and Ensemble Gene Selection Approach with an Enhanced Genetic Algorithm for Classification of Microarray Gene Expression Values on Leukemia Cancer. International Journal of Computational Intelligence Systems, 13(1): 1554-1566. http://dx.doi.org/10.2991/ijcis.d.200928.001
[11] Huang, C.H., Peng, H.S., Ng, K.L. (2015). Prediction of cancer proteins by integrating protein interaction, domain frequency, and domain interaction data using machine learning algorithms. BioMed Research International, 2015: 312047. https://doi.org/10.1155/2015/312047
[12] Azzawi, H., Hou, J., Xiang, Y., Alanni, R. (2016). Lung cancer prediction from microarray data by gene expression programming. IET Systems Biology, 10(5): 168-178. https://doi.org/10.1049/iet-syb.2015.0082
[13] Wu, S., Jiang, H., Shen, H., Yang, Z. (2018). Gene selection in cancer classification using sparse logistic regression with L1/2 regularization. Applied Sciences, 8(9): 1569. http://dx.doi.org/10.3390/app8091569
[14] Li, L., Liu, Z.P. (2020). Biomarker discovery for predicting spontaneous preterm birth from gene expression data by regularized logistic regression. Computational and Structural Biotechnology Journal, 18: 3434-3446. https://doi.org/10.1016/j.csbj.2020.10.028
[15] Shukla, A.K., Singh, P., Vardhan, M. (2020). Gene selection for cancer types classification using novel hybrid metaheuristics approach. Swarm and Evolutionary Computation, 54: 100661. http://dx.doi.org/10.1016/j.swevo.2020.100661
[16] Chen, Y., Tao, J., Zhang, Q., Yang, K., Chen, X., Xiong, J., Xia, R., Xie, J. (2020). Saliency detection via the improved hierarchical principal component analysis method. Wireless Communications and Mobile Computing, 2020: 8822777. https://doi.org/10.1155/2020/8822777
[17] Zhao, H., Zheng, J., Xu, J., Deng, W. (2019). Fault diagnosis method based on principal component analysis and broad learning system. IEEEAccess, 7: 99263-99272. https://doi.org/10.1109/ACCESS.2019.2929094
[18] Nobre, J., Neves, R.F. (2019). Combining principal component analysis, discrete wavelet transform and XGBoost to trade in the financial markets. Expert Systems with Applications, 125: 181-194. https://doi.org/10.1016/j.eswa.2019.01.083
[19] Duan, J., Asteris, P.G., Nguyen, H., Bui, X.N., Moayedi, H. (2021). A novel artificial intelligence technique to predict compressive strength of recycled aggregate concrete using ICA-XGBoost model. Engineering with Computers, 37(4): 3329-3346. https://doi.org/10.1007/s00366-020-01003-0
[20] Qiu, Y., Zhou, J., Khandelwal, M., Yang, H., Yang, P., Li, C. (2021). Performance evaluation of hybrid WOA-XGBoost, GWO-XGBoost and BO-XGBoost models to predict blast-induced ground vibration. Engineering with Computers, 1-18. https://doi.org/10.1007/s00366-021-01393-9