Mohammad S. Khrisat
© 2022 IIETA. This article is published by IIETA and is licensed under the CC BY 4.0 license (http://creativecommons.org/licenses/by/4.0/).
OPEN ACCESS
Classification or prediction problem is how to solve it using a specific feature to obtain the predicted class. A wheat seeds specifications 4 3 classes of seeds will be used in a prediction process. A multi-linear regression will be built, and a prediction error ratio will be calculated. To enhance the prediction ratio an ANN model will be built and trained. The obtained results will be examined to show how to make a prediction tool capable to compute a predicted class number very close to the target class number.
classification, prediction, ANN, FFANN, training, MLR, prediction error ratio, features, regression coefficient, the regression equation
Classification is the study of methods that are used to categorize data based on distinct classes. We might call the class as targets, labels, or categories. Labels are the data we plan to build a prediction on. Categorization is a fundamental cognitive ability or the activity to distinguish between objects, events, or ideas, and these activities are in general called elements of experience. Category, class, or type are abstract groupings for experience elements that have criteria in common. Basically, classifying or categorizing is meant to simplify and quantize elements of experience so that it can be distinguished and learnable.
In Artificial Intelligence, data classification can be done by three or more methods. Some of these methods are listed as follows:
(1) Distinct labeling of data or what is known as supervised learning. Once the desired output or target value is known. We use training data set for a model to yield the desired output. In essence, we are training a model on a set of data that consists of inputs and the desired output. The accuracy for the model is measured by loss functions. The loss functions measure the absolute difference between the actual output and the predicted output. By using the loss function, a recursive process can be conducted to minimize the error in the desired output from the predicted output. Supervised learning models can be optimized to reduce errors based on previous experience. With the large amount of data, supervised learning may have drawbacks, such as human errors in the data and time required in training [1-3].
(2) Unsupervised leaning is unlike supervised leaning where the data is labeled. In the unsupervised learning models, the output are patterns that are searched for from unlabeled input data. These patterns help in solving clustered or related problems. The outputted patterns for the data may classify the properties of an inputted data. Advantages of unsupervised leaning is the absence of human involvement, and it allows to discover patterns or information that was previously unpredicted. The unsupervised learning algorithms deals with more complex tasks compared to supervised leaning algorithms. However, the unsupervised learning algorithms can be more unpredictable.
- Clustering
The fundamental reason for clustering is to group data points that have similar properties, and or features. Features are commonly known values used in prediction. One of the most popular terms in clustering of labeled and unlabeled data is what is known as the k mean. Its main purpose is to cluster vague data.
- Regression
Regression is a statistical term that is different from clustering. Regression does not involve true and false in classified labels, instead, regression outputs unbound data.
In mathematical relations, optimization is the process of obtaining maximum and or minimum. In AI, optimization is methods or algorithms that are used to apply changes to neural networks attributes. Some of these attributes could be weights, bias and learning rate. Weights are the coefficients to the input data or could be thought of as signal strength. This can be shown in the equation below:
Output = weight1 x input1 + weight2 x output2 + … bias
In neural networks there exist input layer that passes the inputs to next layer. Weights are applied in layers to perform transformation. Bias is used to make up the difference between the desired output and the function output. There are many AI optimization techniques have been developed, such as genetic algorithms, elephant herding algorithm. These techniques provide optimal or near optimal solutions.
-Data division into classes as in unsupervised learning.
-Distinguished features selection, and combinations of these stated methods.
Based on the input of features or patterns [4-6]. The classifier can be used to distinguish the inputted data by performing needed actions to output a predicted class. Thereafter it's possible to use the calculated classifier to implement an action [7-9]. In classification without the label, the data is inputted to the model, the model should return a class in a specific place [10, 11]. Classification descriptions and predication are two forms of data mining that can be used to extract models and their use to describe the important data classes or predict future data. From the set of training data, the model learns to predict the class label then we used this set to predict the class label of the new sample. The major goal of classification techniques is to maximize predictive accuracy.
To predict future data direction, the following is of concern as shown in Table 1.
Table 1. Proses of data prediction
|
Find the missing elements in the datasheet |
|
Predicting the outcome by the classification model |
|
No dependence on the label of the class |
|
Predication is based on both the label and the class model |
1.1 Classification by regression
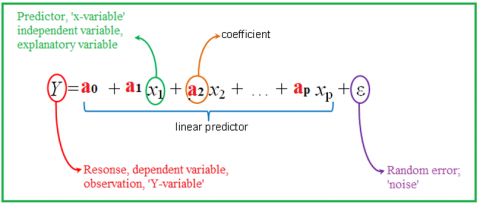
In general, classification involves the prediction of labelling, while regression involves the prediction of quantity. Multiple Linear Regression is an estimator for the relationship between two independent variables or several variables, used as an input, and a single dependent variable is used as an output. Input variables can be categorical, which contain a finite number of categories or distinct groups. Also, the input variables could be continuous.
To describe the relationship between variables, we usually fit a line in the observed data. This will allow us to estimate how the output variable changes concerning the inputted variables. To perform multiple line regression, we must use a formula as shown in Figure 1 where y is the observed dependent variable [12-13].
Figure 1. MLR model
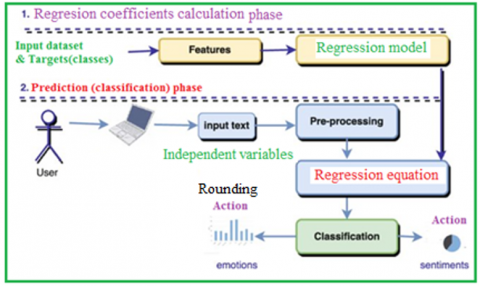
To find a class value using MLR we have to follow up the following phases (see Figure 2).
Figure 2. Classification using MLR model
Phase 1:
Use the input dataset (features) to build the MLR model, then apply this model to obtain the regression coefficients.
Phase 2:
The following steps were used to implement this phase:
- Obtain the values of the feature (independent variables values).
- Use the regression coefficients to build the regression equation.
- Apply the regression equation to find the class value.
- Round the result to get the class value [14, 15].
1.2 Classification using artificial neural networks
Artificial neural networks (ANN) have been the most useful tool in dealing with many challenging applications. Some of these applications could be time series, regression [16, 17], and clustering. ANN is the type of model for Machine Learning (ML), which is relatively competitive to handle complex and non-complex problems. Variant of ANN is a feed-forward ANN (FFANN) [18, 19].
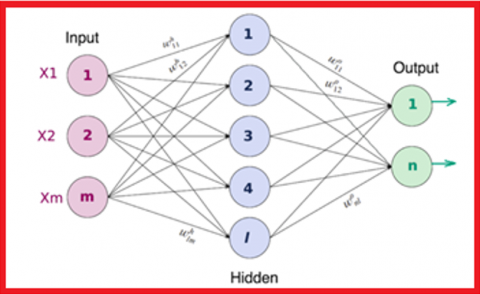
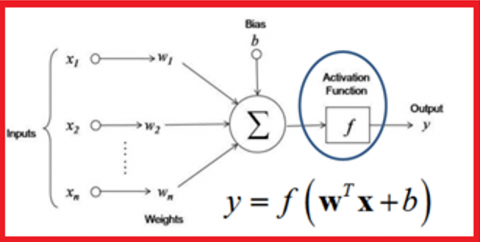
Feed Forward Artificial Neural Network (FFANN) where each neuron in the input layer is connected to the next layer as shown in Figure 3. FFANN contrasts with the convolutional layer where the output neuron is a subset of the input neuron. A single neuron cell performs two main functions as shown in Figure 4. the first function computes the product sum of the inputs with the weights. the second function computes the output of the neuron which depends on an activation function [20, 21] chosen for the neuron with specified layer.
Figure 3. Feed forward ANN Architecture
Figure 4. Neuron inputs, bias, activation function, and output
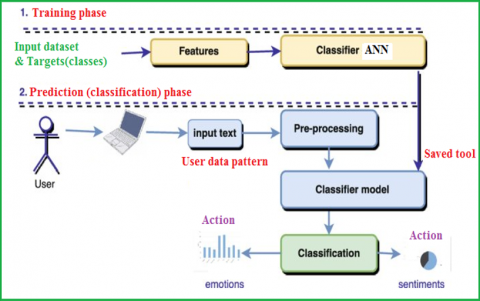
The following steps should be followed for the classification of FFANN (see Figure 5) [22-24]:
Phase 1: Training
In this phase we have to apply the following steps:
1. Select the input dataset (features) and targets (classes values), when necessary, preprocess data such as data performing normalization.
2. Perform architecture definition for the FFANN by defining the following:
a) determine the count of the layers.
b) determine the count of neurons in each layer.
c) determine the function of activation for all layers.
3. The FFANN should be initialized.
4. Determine the parameter for the network such that the difference between the target value and the calculated value is close to zero.
5. Net should be trained in the specified features in addition to classes.
6. Verify that the difference between the computed value and the target value is close to zero. If not close to zero, then retrain and increase the number of training cycles.
Figure 5. Using ANN as a classifier
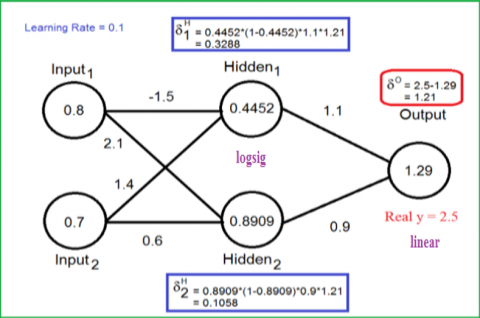
Figure 6. Calculating the outputs (Forward cycle)
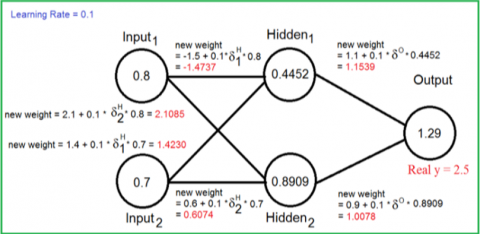
Figure 7. Updating the weights (Forward phase)
We have two cycles for training the ANN, one feedforward and the second one for feed backward. The feedforward cycle calculates the output from the beginning at the input layer. And the second one computes from the output layer to the input layer, where it’s used to adjust the ANN weights as shown in Figures 6 and 7.
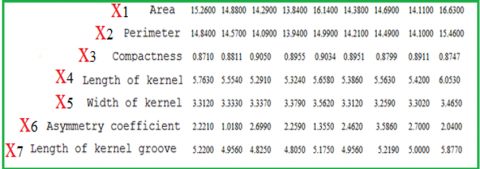
The wheat seeds dataset was used as an input to the created models to generate classification. When the dataset for the seeds includes the species prediction. The seeds measurement was given by wheat of a different kind. This was a two-class classification binary case. The observation for the individual classes was balanced. There exist 210 observations with seven input variables and one output variable. The variable's names are listed as follows:
1- Area
2- Compactness
3- Perimeter
4- Kernel length
5- Kernel width
6- Asymmetric Coefficients
7- Grove of kernel length
8- Classes 1, 2, and 3.
Nine samples are shown below in Figure 8.
Figure 8. Some samples of the input dataset
First, we apply MLR, the coefficients of the regression outputs are shown in Table 2.
Table 2. Regression coefficients
|
Coefficient |
Value |
|
a0 |
53.4436 |
|
a1 |
1.4891 |
|
a2 |
-3.2204 |
|
a3 |
-30.6774 |
|
a4 |
-2.3151 |
|
a5 |
0.2460 |
|
a6 |
0.1149 |
|
a7 |
2.1926 |
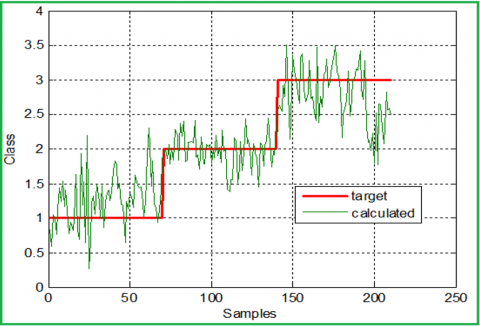
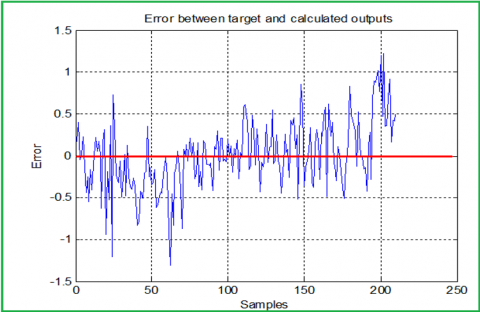
Applying the regression equation using the obtained regression coefficients we found the predicted values of the classes, rounding these values we can obtain the predicted class number for any given value of the independent variables. From the used 210 samples, 36 classes were wrong calculated, with a prediction error ratio equal to 17.14%. Figure 9 shows the target and the predicted classes, while Figure 10 shows the error between them (before rounding).
Figure 9. Targets and predicted classes (regression model)
Second, we apply ANN mode:
ANN was created using the following features:
- Number of inputs 7.
- Number of outputs 1.
- ANN contains 2 layers, the first layer with 7 neurons and tansig activation function, the second layer with 1 neuron and linear activation function.
- The error was set to zero.
- The training cycle number was set to 2000.
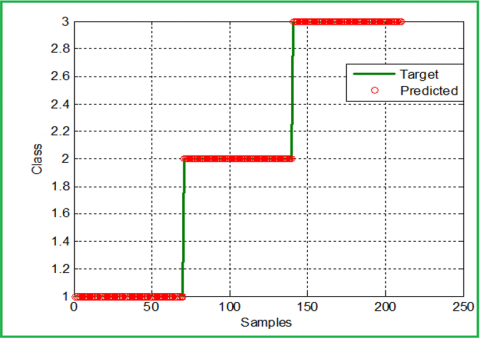
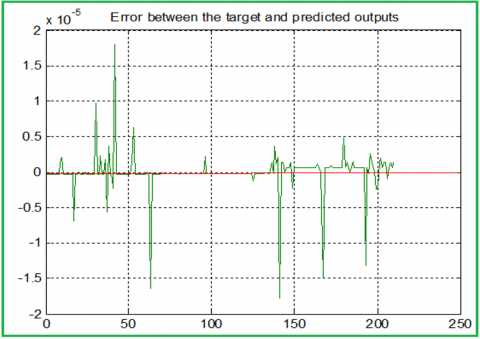
ANN was trained using the same data set and targets, the trained ANN was used to predict the class number using specific features, here the max error obtained was equal to 1.7979e-005, which means that the prediction ratio is very close to 100%. Figure 11 shows the target and the predicted classes, while Figure 12 shows the error between them (before rounding).
From the obtained experimental results we can raise the following facts:
- MLR model is restricted to a specific prediction problem.
- Using the MLR model for prediction causes a high regression error ratio.
- To rapidly decrease the prediction error ratio we recommend using the ANN model.
- Building the ANN model is a very simple process, this model can be easily updated to suit any input data set with any target classes.
Figure 10. Error between the target and predicted classes (regression model)
Figure 11. Targets and predicted classes (ANN model)
Figure 12. Error between the target and predicted classes (ANN model)
A wheat seeds dataset with various specifications for 3 classes of wheat were used as an input data set for a classification problem, an MLR model was built and implemented to calculate the wheat class number depending on a selected specification, the obtained results were acceptable but with prediction error equal 17.14%. To minimize the prediction error ratio, and to obtain a predicted class number closed to the target class, we recommend using the ANN model. The ANN model decreases rapidly the prediction error, it is very simple to build and update.
[1] Khine, K.L., Nyunt, T.S. (2020). Predictive geospatial analytics using principal component regression. International Journal of Electrical and Computer Engineering, 10(3): 2651-2658. https://doi.org/10.11591/ijece.v10i3.pp2651-2658
[2] Dhaval, B., Deshpande, A. (2020). Short-term load forecasting with using multiple linear regression. International Journal of Electrical and Computer Engineering, 10(4): 3911-3917. https://doi.org/10.11591/ijece.v10i4.pp3911-3917
[3] Kavati, I., Kumar, G.K., Kesagani, S., Rao, K.S. (2017). Signboard text translator: a guide to tourist. International Journal of Electrical and Computer Engineering (IJECE), 7(5): 2496-2501.
[4] Iksan, N., Sembiring, J., Hariyanto, N., Supangkat, S.H. (2019). Residential load event detection in NILM using robust cepstrum smoothing based method. International Journal of Electrical & Computer Engineering, 9(2): 742-752. https://doi.org/10.11591/ijece.v9i2.pp742-752
[5] Al-Qaisi, A., AlTarawneh, M. S., ElSaid, A.A., Alqadi, Z. (2020). A hybrid method of face feature extraction, classification based on MLBP and layered-recurrent network. Traitement du Signal, 37(4): 555-561. https://doi.org/10.18280/ts.370402
[6] Hindi, Z.A.A.A.Y., Majed, O.D. (2020). Procedures for speech recognition using LPC and ANN. International Journal of Engineering Technology Research & Management, 4(2): 48-55.
[7] Khrisat, M.S., Eltous, Y., Khawatreh, S.A., Dwairi, M.O., Alqadi, Z. (2020). Building face recognition system (FRS). International Journal of Computer Science and Mobile Computing, 9(6): 15-24.
[8] Asad, J.A.A.N., Alqadi, Z., Shayeb, I., Jaber, Q., Al-Azzeh, J. (2020). Simple procedures to create HSCS. International Journal of Engineering Research and Management (IJERM), 7(5): 6-10.
[9] Hindi, A., Dwairi, M.O., Alqadi, Z. (2020). Analysis of procedures used to build an optimal fingerprint recognition system. International Journal of Computer Science and Mobile Computing, 9(2): 21-37.
[10] Al-Qaisi, A., Manasreh, A., Sharadqeh, A., Alqadi, Z. (2019). Digital color image classification based on modified local binary pattern using neural network. International Journal on Communications Antenna and Propagation (I. Re. CAP), 9(6): 403-408. https://doi.org/10.15866/irecap.v9i6.18425
[11] Al-Hiar, E.M.A., Ghaza, E.O.T., Salma, E.S.S. (2019). Investigation of ANN used to solve MLR problem. IJCSMC, 8(5): 38-50.
[12] AlQadi, Z.A., AlOthman, E.A.S., Alleddawi, E.M.O., AlHiary, E.M., Ghazal, E.O.T., Salman, E.S.S. (2019). Building accurate and efficient color image recognizer. IJCSMC, 8(4): 127-135.
[13] Al-Azzeh, J., Alqadi, Z., Abuzalata, M. (2019). Performance analysis of artificial neural networks used for color image recognition and retrieving. International Journal of Computer Science and Mobile Computing, 8(2): 20-33.
[14] Ayyoub, J.A.A.B., Sharadqh, A., Alqadi, Z., Al-azzeh, J. (2019). Simulink based RNN models to solve LPM. International Journal of Research in Advanced Engineering and Technology, 5(1): 49-55.
[15] Qaryouti, G., Khawatreh, S., Alqadi, Z., Abu Zalata, M. (2017). Optimal color image recognition system (OCIRS). International Journal of Advanced Computer Science and Technology, 7(1): 91-99.
[16] Al-Hasanat, A., Alasha'ary, H., Matrouk, K., Al-Qadi, Z., Al-Shalabi, H. (2014). Experimental investigation of training algorithms used in back propagation artificial neural networks to apply curve fitting. European Journal of Scientific Research, 121(4): 328-335.
[17] Matrouk, K., Alasha'ary, H., Al-Hasanat, A., Al-Qadi, Z., Al-Shalabi, H. (2014). Investigation and analysis of ANN parameters. European Journal of Scientific Research, 121(2): 217-225.
[18] Moustafa, A.A., Alqadi, Z.A., Shahroury, E.A. (2011). Performance evaluation of artificial neural networks for spatial data analysis. WSEAS Transactions on Computers, 10(4): 115-124.
[19] Aqel, M., AlQadi, Z., Zalata, M.A., Zneit, R.A. (2011). Evaluation of artificial neural networks used for pattern recognition systems. Paper Title Page No., 3(1): 18.
[20] AlQaisi, A., AlTarawneh, M., Alqadi, Z.A., Sharadqah, A.A. (2019). Analysis of color image features extraction using texture methods. TELKOMNIKA (Telecommunication Computing Electronics and Control), 17(3): 1220-1225. http://doi.org/10.12928/telkomnika.v17i3.9922
[21] Al-Qadi, Z., Aqel, M. (2009). Performance analysis of parallel matrix multiplication algorithms used in image processing. World Applied Sciences Journal, 6(1): 45-52.
[22] Moustafa, A.A., Alqadi, Z.A. (2009). A practical approach of selecting the edge detector parameters to achieve a good edge map of the gray image. Journal of Computer Science, 5(5): 355-362. ttp://doi.org/10.3844/jcssp.2009.355.362
[23] Alshammari, E.T. (2018). Towards an accurate ground-level ozone prediction. International Journal of Electrical and Computer Engineering, 8(2): 1131-1139. https://doi.org/10.11591/ijece.v8i2.pp1131-1139
[24] Khrisat, M.S., Alqadi, Z.A. (2022). Solving multiple linear regression problem using artificial neural network. International Journal of Electrical and Computer Engineering, 12(1): 770-775. http://doi.org/10.11591/ijece.v12i1.pp770-775