Mohamed Masmoudi* | Wahid Kaddouri | Kaouther Bourih | Abdellah Bourih | Salah Madani
© 2022 IIETA. This article is published by IIETA and is licensed under the CC BY 4.0 license (http://creativecommons.org/licenses/by/4.0/).
OPEN ACCESS
Transversal cross-section pores of lotus-type porous materials are generally considered circular; however, they exhibit various pore geometries, which affect their effective properties. The main objective of this work is to develop a generalized model which allows estimating the effective Young’s modulus of multi-void shape porous microstructures by exploiting a relationship developed to evaluate the effective Young’s modulus of porous materials with single-void shape. A procedure based on free software is then proposed to allow the application of the proposed generalized model on real lotus-type porous material images to estimate the effective Young’s modulus. The free tool allows the processing of real porous materials images to obtain multi-void shape microstructures and their pores parameters data. The validation of the generalized model has been established by confronting the obtained results with experimental data taken from literature; an excellent agreement was observed. Therefore, it can be concluded that the proposed procedure associated with the generalized model can be used efficiently for predicting the effective Young’s modulus of the multi-void porous materials, particularly lotus-type porous materials.
multi-phase porous materials, mean-field technique, multi-scale numerical homogenization, effective Young’s modulus, multi-pore shape model
Predicting effective physical and mechanical properties of porous materials is of great interest in large research sciences and industrial applications. The development of estimation models is motivated by the availability of several experimental data in the specialized literature.
For example, Kee et al. [1] experimented with the tensile and compressive behavior of GASAR porous copper, which confirmed a finite element computational simulation model. Nakajima et al. [2] described the fabrication of porous copper. They observed that its mechanical properties, such as ultimate tensile strength and yield strength, are superior to conventional porous materials such as sintered and foamed materials. Hyun et al. [3] examined the anisotropy in the tensile behavior of the porous copper. The ultimate tensile strength and yield strength were studied in two cases when the tensile is parallel and perpendicular to the pore axis. A model based on Balshin [4] was proposed. An experimental and computational work performed by Ichitsubo et al. [5], measured the elastic constants of a lotus-type porous copper. It presented a micromechanics calculation prediction model which confirmed experimental anisotropic elastic constants. Ikeda et al. [6] studied the tensile behavior of a lotus-type porous stainless steel. They found that the ultimate tensile strength model obeys the same one of lotus-type porous copper in the direction perpendicular to the pore axis. The compressive behavior of porous copper has been investigated by Hyun and Nakajima [7]. The variation of the porosity confronted yield strength.
Tane et al. [8] studied the elastic properties of lotus iron experimentally and found that they obey the well-known stress concentration model. In the study by Sueno et al. [9], the effect of the specimen thickness variation on the ultimate tensile strength of lotus-type porous copper was investigated. It has observed a significant effect when the width of the specimen is larger enough than the pore diameter. Predicting yield behaviors of porous metals was the object of the work of Tane et al. [10]. Using the mean-field method, the proposed model has taken account of the pore morphology in the anisotropies of the metal matrix. It has been validated by comparing the numerical results of the lotus-type porous iron with the experimental ones. Ide et al. [11] studied the compressive behavior of lotus-type porous TiAl characterized by high temperature and high strength. He has fitted the Boccaccini model to experimental results and concluded that both pore morphology and matrix ductility significantly affect compressive properties.
Nakajima [12] developed three techniques to fabricate lotus-type metals, and he observed that the behaviors of the mechanical and physical properties are due to the anisotropic porous structure. The fitting of the Boccaccini model to experimental results showed good precision. He also concluded that the anisotropic mechanical strength is due to the phenomenon of the stress concentration around the pores.
Many works have focused on modeling the pore morphology effect on porous materials' physical and mechanical properties by exploiting the experimental data from the studies cited above. For example, using the series model, parallel model, effective medium theory, and Maxwell models, Kaddouri et al. [13] proposed an estimation model for the effective thermal conductivity of porous materials. Masmoudi et al. [14] proposed a model for the prediction of the effective ultimate tensile strength of lotus-type porous copper using the multi-scale numerical homogenization technique where the obtained numerical results were compared to the analytical model of Boccaccini et al. [15] and confronted to experimental data of [12]; the proposed formula was in good agreement.
In recent work, Bourih et al. [16] developed a model which estimates the pore shape effect on the effective Young's modulus of porous microstructures with a single identical circular or elliptical shape. The multi-scale homogenization technique based on the representative volume element was used, and the results were validated by comparison to experimental data taken from the literature.
The main object of the present study is to develop a more general model, based on the one developed by Bourih et al. [16], allowing estimation of the effective Young's modulus by considering microstructures with not a single pore shape but several pore shapes.
The procedure is based on using the mean-field homogenization technique to develop the generalized model, which will be validated by application to 2D porous microstructures pictures obtained by the Image J software.
2.1 Presentation of the employed model
The model that will be generalized in this study was suggested by Bourih et al. [16]; it predicted the effective Young's modulus of porous materials considering the pore shape effect. This model relates to a type of two-phase porous matrix where the microstructure is characterized by a random distribution of pores having a single type of cross-sectional contour morphology.
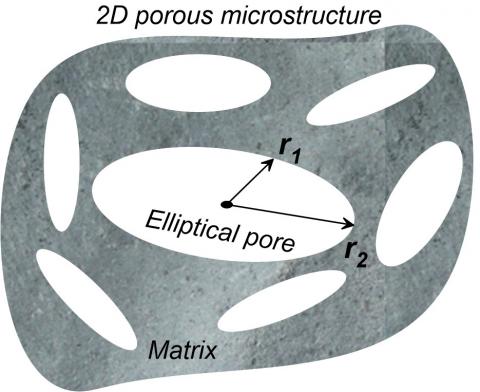
Figure 1. Examples of porous microstructures studied by Bourih et al. [16]
Figure 1 illustrates examples of porous microstructures that the considered model can treat.
It is noted, here, that these microstructures with a single pore shape are not real but virtual. They are considered to investigate the pore shape effect on the effective property studied and to model this effect.
The following equation expressed the model:
$\frac{E^{e f f}}{E_m}=(1-P)^{0.6\left(\frac{1}{r}+3\right)}$ (1)
$E^{e f f}$ is the effective Young’s modulus (EYM) of the porous material, $E_m$ is Young’s modulus of the fully dense material, P is the porosity is the ratio of the total pores area and matrix area, and r is the ratio of the minor and major radii of the elliptical pores, see Figure 2.
2.2 Proposed generalized model
In this paper, it should be noted that since the studied multi-void shape lotus type porous microstructures contain several elliptical pore shapes with different aspect ratios, these microstructures are considered multiphase, i.e., the matrix is the phase containing different pores with different shapes; each pore is regarded as a different phase.
The employed model, which has been developed by Bourih et al. [16] for porous microstructures with a single pore shape, given by equation (1), is generalized to multi-void porous microstructures by using the two-step mean-field homogenization technique, which has mainly been used to estimate the effective properties of multiphase materials, see [8] and [17-26].
Figure 2. Pore geometry
The generalized model is deduced by applying the mean-field formulation. The Eq. (1), applied as a model to estimate the effective Young's modulus of porous microstructures with a single-shape, is used in the first step of the mean-field technique to compute the effective partial property of each decomposed volume containing one phase shape. The mean-field second step is then applied to calculate the average of the properties of the different volumes obtained in the first step; the obtained relationship represents the proposed generalized model given by expression (2).
$\frac{E^{e f f}}{E_m}=\sum_{i=1}^{n_{p h}} \frac{P_i}{P}(1-P)^{0,6\left(\frac{1}{r_i}+3\right)}$ (2)
$E^{e f f}$ is the effective Young’s modulus, $E_m$ is the matrix Young’s modulus, $n_{p h}$ is the phase or pore number, $P_i$ is the phase porosity, $P$ is the total porosity and $r_i$ is the phase aspect ratio.
The application of the proposed model, represented by Eq. (2), requires the parameters $P_i$ and $r_i$ of each phase. These parameters are obtained by the use of an image processing tool. In this study, the free ImageJ software is used.
3.1 Description of the ImageJ software
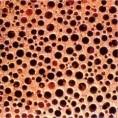
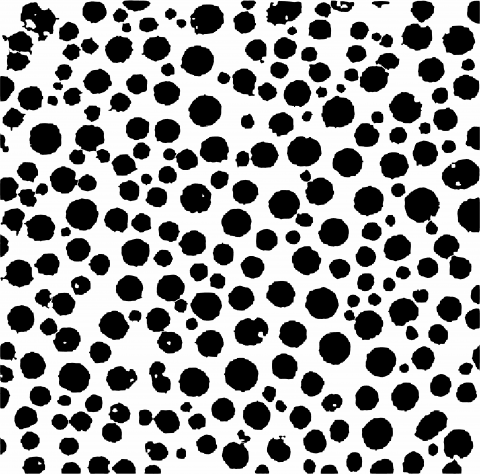
The purpose of the ImageJ tool, in this study, is to process the images of the lotus-type porous material microstructures by fitting the contour shape of the cross-section of the pores. By inspecting the pictures, it can be seen that the contour shape of the pores, obtained by a moulding process called Gasar and which is supposed to be circular, is, however, irregular. The used tool approaches these contours to be elliptical or circular shapes. The obtained porous microstructures, containing different pore shapes, will be used to computational the effective Young’s modulus. The ImageJ tool processed the real pictures of lotus-type porous copper in three steps, see Table 1. The obtained porous microstructure is considered a randomly dispersed multiphase porous material containing np non-overlapped pores.
Table 1. Processed porous microstructures
|
Step |
Processing description |
Result |
|
0 |
The picture of real lotus porous copper microstructure is used to be processed. |
|
|
1 |
The real microstructure picture is transformed into 8 bits-greyscale and the matrix and pores are identified. |
|
|
2 |
Separation of the different color phases to obtain matrix and pore phases which are numbered. Pore shapes are irregular. The different pore shapes are identified by the different colors. |
|
|
3 |
Fitting the irregular morphology of pores to obtain the different aspect ratios of elliptical pores. |
After the final step 3, the ImageJ tool gives the results which are considered data as the example shown in Table 2. It must be noted that in step 2 of ImageJ software, described in Table 1, this configuration of microstructures with the different colors is cited just for information and is not used in the proposed procedure.
Table 2. Obtained results by ImageJ processing
|
Pore |
1 |
2 |
3 |
… |
208 |
|
Area |
5,436 |
8,713 |
41,324 |
… |
1,349 |
|
Xi |
190.296 |
468.549 |
906.794 |
… |
364.438 |
|
Yi |
33.492 |
28.578 |
114.175 |
… |
3,752.932 |
|
Major |
124.094 |
200.566 |
238.480 |
… |
523.83 |
|
Minor |
55.775 |
55.312 |
220.628 |
… |
96.385 |
|
Angle |
178.428 |
179.982 |
112.506 |
… |
17.820 |
The ImageJ tool processing results of real porous microstructures are composed of RVE images with pores fitted by ellipses. See Table 1, step 3 and the pore parameter values (data); see Table 2. The data will be used to apply the proposed model and the RVEs for the numerical computation of the effective properties by the multi-scale homogenization technique. The application results will be compared to numerical homogenization to be validated.
3.2 Computational procedure
3.2.1 Porous microstructures processing
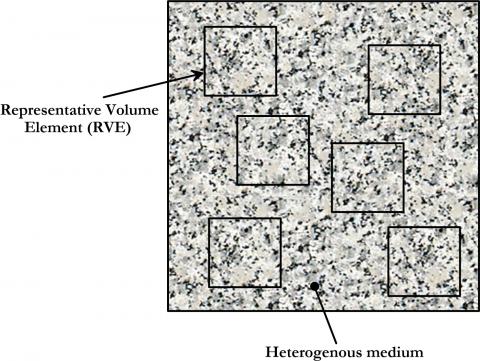
Stationarity is a morphological analysis characteristic of heterogeneous mediums random sets. A set (volume) is said to be stationary if the property of the medium remains invariable by translation (change of position) of the volume [27], see Figure 3. The effective properties computation is carried out using the multi-scale finite element homogenization technique based on the representative volume element RVE, which must satisfy the stationarity criteria.
In this study, the RVE is taken equal to 200 voids as in the study of ref. [16]. This section will check the considered microstructures for this stationarity condition. The strategy translates the predefined volume to different positions on the studied microstructure picture to obtain different configurations. To satisfy the RVE stationarity condition, the calculated effective property for all formats must be the same.
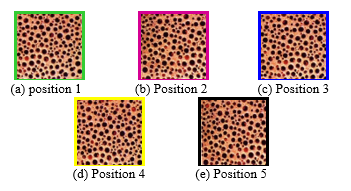
Five positions have been considered; each is represented by a different colored frame in Figure 4.
Figure 3. RVE stationarity characteristic
Figure 4. The different considered positions of RVE
The five positions give the different RVEs represented in Figure 5.
Figure 5. The five different RVE configurations
All these RVE porous microstructure pictures in Figure 5 must be processed using the ImageJ software by applying the three-step process as illustrated in section 3.2. The obtained parameters of the green RVE (position 1) processing are shown, as an example, in Table 2. Due to the considerable number of results, only the first three lines and the last, number 208, are displayed.
3.2.2 Application of the proposed model
It must be noted that only parameters: matrix area (Am), pore area (Ai), minor, and major, obtained by the ImageJ processing, are helpful in the application of the proposed model represented by Eq. (2). Note that the ratio is defined as the quotient of minor and major.
The processing results of the five RVEs presented in Figure 5 are all displayed in Tables 3, 4, 5, 6, and 7. Only the first three and the last line are represented.
It must be remembered that the adopted RVE in this study is equal to 200 pores, the same as determined by Bourih et al. [16] and as mentioned in section 3.2.1. This RVE is used to determine the five different positions, which allow for verification of the stationarity condition. The results obtained by the ImageJ software processing applied to the five porous microstructures pictures show a difference in the pore numbers; this can be explained by the fact that this RVE is numerical, unlike the picture RVEs, which are real.
Table 3. Green RVE (position 1) results matrix area Am = 14,686,705
|
Pore i |
1 |
2 |
3 |
… |
208 |
|
Ai |
5,436 |
8,713 |
41,324 |
… |
1,349 |
|
Ratio |
0.449 |
0.275 |
0.925 |
… |
0.184 |
|
Porosity |
0.00037 |
0.00059 |
0.0028 |
… |
0.00091 |
Table 4. Pink RVE (position 2) results matrix area Am = 12,870,921
|
Pore i |
1 |
2 |
3 |
… |
189 |
|
Ai |
12,597 |
21,424 |
6,882 |
… |
2,101 |
|
Ratio |
0.642 |
0.325 |
0.606 |
… |
0.253 |
|
Porosity |
0.00097 |
0.00166 |
0.00053 |
… |
0.00016 |
Table 5. Blue RVE (position 3) results matrix area Am = 13,658,593
|
Pore i |
1 |
2 |
3 |
… |
194 |
|
Ai |
3,026 |
36,192 |
1,079 |
… |
1,090 |
|
Ratio |
0.195 |
0.506 |
0.122 |
… |
0.207 |
|
Porosity |
0.00022 |
0.00264 |
0.00007 |
… |
0.00007 |
Table 6. Yellow RVE (position 4) results matrix area Am = 14,590,625
|
Pore i |
1 |
2 |
3 |
… |
211 |
|
Ai |
10,510 |
66,204 |
3,845 |
… |
4,077 |
|
Ratio |
0.286 |
0.388 |
0.539 |
… |
0.415 |
|
Porosity |
0.00072 |
0.00453 |
0.00026 |
… |
0.00027 |
Table 7. Black RVE (position 5) results matrix area Am = 13,275,201
|
Pore i |
1 |
2 |
3 |
… |
192 |
|
Ai |
17,593 |
11,973 |
28,554 |
… |
2,986 |
|
Ratio |
0.384 |
0.391 |
0.434 |
… |
0.818 |
|
Porosity |
0.00132 |
0.00090 |
0.00215 |
… |
0.00022 |
The parameters of Tables 3, 4, 5, 6, and 7 are defined as follows:
Ai: area of the pore number i.
Ratio: the quotient of the minimum. and maximum radii.
Porosity: pore porosity rate.
The results show that the areas and the shapes of the pores are all different; therefore, every pore can be considered a phase so that the pore number can replace the phase number of Eq. (2).
The expression of the proposed model becomes
$\frac{E^{e f f}}{E_m}=\sum_{i=1}^p \frac{P_i}{P}(1-P)^{0.6\left(\frac{1}{r_i}+3\right)}$ (3)
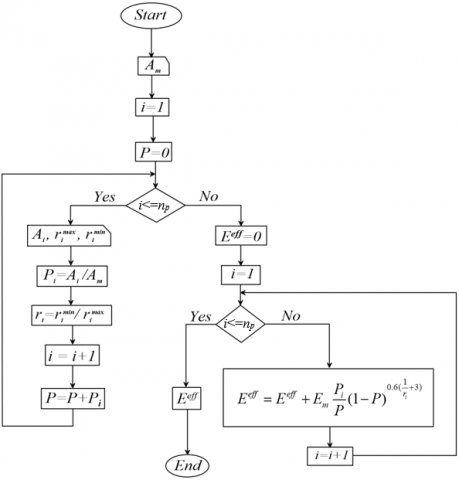
The effective Young’s modulus of the multiphase porous microstructure is computed according to the organigram of Figure 6 by applying the model represented by Eq. (3) to the data issued from ImageJ software processing displayed in Tables 3, 4, 5, 6, and 7.
Figure 6. Computation Organigram of the effective Young’s modulus (EYM) of multiphase porous material
The iterative computation procedure begins from the first pore and is repeated until reaching the last one; the multi-pore EYM is the sum of all EYM pores computed by Eq. (1) applied to each pore. The results which are obtained using the proposed model for the five different RVE configurations are presented in Table 8.
Table 8. The EYM computed by the proposed model
|
RVE |
Porosity P |
$\frac{E^{e f f}}{E_m}$ |
|
Green (position 1) |
0.3991 |
0.2831 |
|
Pink (position 2) |
0.3765 |
0.3085 |
|
Blue (position 3) |
0.4012 |
0.2805 |
|
Yellow (position 4) |
0.4063 |
0.2744 |
|
Black (position 5) |
0.4038 |
0.2769 |
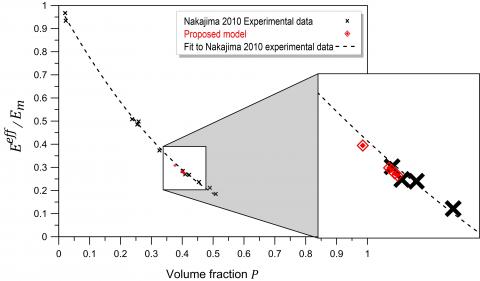
To validate the EYM computed by the proposed model, obtained results were compared to experimental data found in the literature [12].
Figure 7 shows the variation of the normalized EYM as a function of the volume fraction P. The results of the four configurations, represented by positions 1, 3, 4, and 5 having volume fractions of 0.4, coincide with the experimental data of the same volume fraction. Since the results of the last four configurations, which have the same volume fraction, are equal, it can be concluded that the stationarity condition is satisfied.
For the configuration of position 2, whose volume fraction is 0.37 and which does not correspond to any volume fraction of the experimental data, and for a better comparison, the experimental data of the study in ref. [12] have been fitted. The comparison of the position 2 configuration results to the fitted curve showed good agreement. This has been proven by an error calculation whose results are given in Table 9. The maximum relative error doesn’t exceed 3.22 %. which would be appreciable.
Figure 7. Comparison of the proposed model results to Nakajima’s 2010 experimental data
Table 9. Comparison of the proposed model EYM to the experimental data
|
RVE |
P |
$\frac{E^{e f f}}{E_m}$ |
Fitted experimental data |
Relative error [%] |
|
Position 1 |
0.3991 |
0.2831 |
0.2915 |
2.89 |
|
Position 2 |
0.3765 |
0.3085 |
0.3187 |
3.22 |
|
Position 3 |
0.4012 |
0.2805 |
0.2890 |
2.96 |
|
Position 4 |
0.4063 |
0.2744 |
0.2831 |
3.09 |
|
Position 5 |
0.4038 |
0.2769 |
0.2860 |
3.20 |
Hence, since all relative error values are around 3% for all configurations as seen in Table 9, it can be concluded that the proposed model provides a very good estimation of the EYM of the multi-shape porous microstructures.
In addition to the results exploited as data by the model proposed in section 3.2.2, the ImageJ tool provides a second alternative which is the estimation of the EYM of the five porous microstructures using the RVE-based multi-scale finite elements homogenization technique applied to the microstructure images obtained by applying step 3 of Table 1, to the five configurations of Figure 5. The fitted elliptical pore images of considered porous microstructures are presented in Figure 8.
Figure 8. The fitted elliptical porous microstructures
The application of the numerical homogenization procedure to the considered porous microstructures is described in section 4.1.
4.1 Effective bulk modulus and effective shear modulus
The effective Young’s Modulus $E^{e f f}$ is computed according to the relation
$E^{e f f}=\frac{4}{\frac{1}{\mu^{e f f}}+\frac{1}{k^{e f f}}}$ (4)
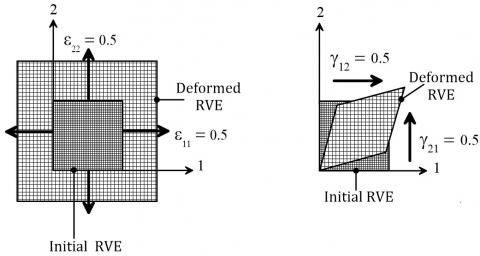
$\mu^{e f f}$ and $k^{e f f}$ are the effective shear modulus and the effective bulk modulus. which must be determined by applying specific kinematic uniform boundary conditions (KUBC) on a volume element V as in the study of ref. [16], see Figure 9.
At a point $V$ of the boundary $\partial V$ the imposed deformation causes a displacement $\underline{u}$
$\underline{u}=D\cdot\underline{x}$ (5)
D is a symmetrical second-rank tensor independent of $\underline{x}$.
Figure 9. Boundary conditions for -a- effective bulk modulus and -b- effective shear modulus
The strain tensor is given by
$\langle\varepsilon\rangle=\frac{1}{V}\int\varepsilon d V=D$ (6)
Then, the macroscopic stress tensor is given by the spatial average
$\sum=(\sigma)\frac{1}{V}\int_V\sigma d V$ (7)
For the specific boundary values used, specific values of D must be chosen.
$D_k=\left[\begin{array}{cc}1/2&0 \\0&1 / 2\end{array}\right]$ and $D_\mu=\left[\begin{array}{cc}0 & 1 / 2 \\ 1 / 2 & 0\end{array}\right]$ (8)
The effective bulk modulus $k^{e f f}$ and the effective shear modulus $\mu^{e f f}$ are defined by
$k^{e f f}=\frac{1}{2}\left(\left\langle\sigma_{11}\right\rangle+\left\langle\sigma_{22}\right\rangle\right)$ (9)
$\mu^{e f f}=\left\langle\sigma_{12}\right\rangle$ (10)
For meshing microstructures, the finite element mesh used in this study is the same as the study of ref. [16]; it’s a regular mesh grid with quadratic 8-node elements.
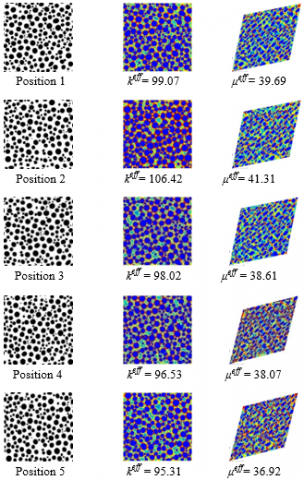
The effective moduli $k^{e f f}$ and $u^{e f f}$ are computed for the five RVEs images represented in Figure 8 and are shown in Figure 10 with the stress iso-values results.
Figure 10. Stress iso-values and $k^{e f f}$ , $u^{e f f}$ results [GPa]
Finally, the EYM is determined using Eq. (4). The results of the five positions are given in Table 10. which shows that the results are pretty close to those of the proposed model.
Table 10. The EYM computed by the numerical homogenization technique
|
RVE |
Porosity P |
$\frac{E^{e f f}}{E_m}$ |
|
Green (position 1) |
0.4026 |
0.2906 |
|
Pink (position 2) |
0.3791 |
0.3052 |
|
Blue (position 3) |
0.4043 |
0.2840 |
|
Yellow (position 4) |
0.4092 |
0.2800 |
|
Black (position 5) |
0.4070 |
0.2729 |
Figure 11 shows good agreement between the results of the EYM computed by the multi-scale numerical homogenization technique. represented by green points, and both results of the EYM estimated by the proposed model, described by red points, and the experimental data [12], represented by black points. It must be remembered that the comparison was carried out for the RVE volume fraction of the five porous microstructures configurations considered in this study.
Results of this section are summarized in Table 11 and compared to experimental data [12] with a calculation of errors which shows that the proposed model is entirely accurate; the maximum relative error is less than 4%.
Figure 11. Numerical homogenization. The proposed model and experimental data [12] comparison
Table 11. Comparison between the EYM of the proposed model and the experimental data
|
RVE |
$\boldsymbol{P}$ |
$\boldsymbol{P}$ |
Fitted experimental data |
Error [%] |
|
Position 1 |
0.39 |
0.2906 |
0.3023 |
3.88 |
|
Position 2 |
0.3789 |
0.3052 |
0.3158 |
3.36 |
|
Position 3 |
0.4043 |
0.2840 |
0.2854 |
0.51 |
|
Position 4 |
0.4093 |
0.2800 |
0.2797 |
0.10 |
|
Position 5 |
0.4069 |
0.2729 |
0.2824 |
3.38 |
The main purpose of this article was to propose a new simplified procedure for estimating Young's modulus of porous materials and especially of the lotus-type porous ones characterized by not a single pore shape but by multi-shape-pores. This study is considered a continuation of the study by Bourih et al. [16] which proposed a model for estimating the effective Young's modulus of 2D porous microstructures with identical circular or elliptical pores, particularly of lotus-type porous materials by considering microstructures with only a single pore shape.
In this work, a generalized model is developed to model better as much as possible the effective Young’s modulus of the lotus-type porous materials considered as multi-pore.
The generalized model is developed using the mean-field homogenization principle. The single pore-shape model of the study in ref. [16] is used in the first step of the mean-field homogenization technique to compute the partial effective Young’s modulus of each decomposed volume containing one phase-shape. The mean-field second step is then applied to calculate the effective Young’s moduli average of the different volumes obtained in the first step; the obtained relationship represents the proposed generalized model.
The free ImageJ software, which allows the processing of real composite microstructure images, gives two different results: geometrical parameters data of the lotus-type porous materials characterized by irregular multi-pore shapes and microstructure pictures with fitted pore shapes.
The originality of the new simplified procedure resides in the fact, on the one hand, that the proposed model could be applied to a real microstructure using the obtained data results of the ImageJ software, on the other hand, and in the case where no model is available, the application of a numerical homogenization on the obtained microstructure images is possible.
The two types of results, data, and pictures give two alternatives: the first is that the data contain processing results of aspect ratios and porosities of pores which are needed to compute the effective Young’s modulus of the multiphase porous microstructures by applying the generalized proposed model. This alternative is exploited to verify the RVE stationarity condition considering five different positions; the calculations gave the effective property for the five positions. The validation has been ensured by comparing obtained results to literature experimental data. and good agreement was noted.
The second alternative allows the estimation of the effective Young’s modulus by applying the multi-scale finite element homogenization technique based on the representative volume element RVE on the obtained microstructure images with fitted pores. The five different configurations used in the first alternative were exploited in this computational technique. The obtained results were confronted with both literature experimental data and the generalized model; a very good agreement and a low relative error were observed for all the results.
Finally, it could be concluded that the application of the proposed generalized model on real microstructures can accurately predict the effective Young’s modulus of the multi-shape porous microstructures.
|
Ai |
Area of pore number i |
|
Am |
Area of the matrix |
|
$D$ |
Symmetrical second-rank tensor |
|
$d V$ |
Volume differential |
|
$E^{e f f}$ |
Effective porous material Young’s modulus |
|
$E_m$ |
The matrix Young’s modulus |
|
k |
Effective bulk modulus |
|
$n_{p h}$ |
Number of phases |
|
$n_p$ |
Number of pores |
|
$P$ |
Porosity |
|
$P_i$ |
Porosity of pore number i |
|
$r$ |
Ratio |
|
$\underline{u}$ |
Displacement tensor |
|
V |
Volume |
|
Xi |
X coordinate of pore i |
|
Yi |
Y coordinate of pore i |
|
Greek symbols |
|
|
$\mu^{e f f}$ |
Effective shear modulus |
|
$\langle\varepsilon\rangle$ |
Strain tensor |
|
$\langle\sigma\rangle$ |
Stress tensor |
|
$\sum$ |
Macroscopic stress tensor |
|
Subscripts |
|
|
m |
Matrix |
|
i |
Pore number |
|
p |
Pore |
|
ph |
Phase |
|
Superscripts |
|
|
eff |
Effective |
[1] Kee, A., Matic, P., Everett, R.K. (1998). A mesoscale computer simulation of multiaxial yield in gasar porous copper. Materials Science and Engineering: A, 249(1-2): 30-39. http://dx.doi.org/10.1016/S0921-5093(98)00560-7
[2] Nakajima, H., Hyun, S.K., Ohashi, K., Ota, K., Murakami, K. (2001). Fabrication of porous copper by unidirectional solidification under hydrogen and its properties. Colloids and Surfaces A: Physicochemical and Engineering Aspects, 179(2-3): 209-214. http://dx.doi.org/10.1016/S0927-7757(00)00639-7
[3] Hyun, S.K., Murakami, K., Nakajima, H. (2001). Anisotropic mechanical properties of porous copper fabricated by unidirectional solidification. Materials Science and Engineering: A, 299(1-2): 241-248. http://dx.doi.org/10.1016/S0921-5093(00)01402-7
[4] Balshin, M.Y. (1949). Relation of mechanical properties of powder metals and their porosity and the ultimate properties of porous metal-ceramic materials. Dokl. Acad. Nauk, SSSR, 67: 831-834.
[5] Ichitsubo, T., Tane, M., Ogi, H., Hirao, M., Ikeda, T., Nakajima, H. (2002). Anisotropic elastic constants of lotus-type porous copper: Measurements and micromechanics modelling. Acta Materialia, 50(16): 4105-4115. http://dx.doi.org/10.1016/S1359-6454(02)00228-8
[6] Ikeda, T., Tsukamoto, M., Nakajima, H. (2002). Fabrication of lotus-type porous stainless steel by unidirectional solidification under hydrogen atmosphere. Materials Transactions, 43(11): 2678-2684. http://dx.doi.org/10.2320/matertrans.43.2678
[7] Hyun, S.K., Nakajima, H. (2003). Anisotropic compressive properties of porous copper produced by unidirectional solidification. Materials Science and Engineering: A, 340(1-2): 258-264. http://dx.doi.org/10.1016/S0921-5093(02)00181-8
[8] Tane, M., Ichitsubo, T., Nakajima, H., Hyun, S.K., Hirao, M. (2004). Elastic properties of lotus-type porous iron: acoustic measurement and extended effective-mean-field theory. Acta Materialia, 52(17): 5195-5201. http://dx.doi.org/10.1016/j.actamat.2004.07.030
[9] Sueno, H., Tane, M., Park, J.S., Hyun, S.K., Nakajima, H. (2006). Size effects on tensile strength of lotus-type porous copper. Materials Transactions, 47(9): 2203-2207. http://dx.doi.org/10.2320/matertrans.47.2203
[10] Tane, M., Ichitsubo, T., Hirao, M., Nakajima, H. (2007). Extended mean field method for predicting yield behaviors of porous materials. Mechanics of Materials, 39(1): 53-63. http://dx.doi.org/10.1016/j.mechmat.2006.02.008
[11] Ide, T., Tane, M., Nakajima, H. (2009). Compressive deformation behavior of porous TiAl with directional pores. Material Science and Engineering: A, 508(1-2): 220-225. https://doi.org/10.1016/j.msea.2009.01.046
[12] Nakajima, H. (2010). Fabrication, properties and applications of porous metals with directional pores. Proc. Jpn. Acad., Ser., 86(9): 884-899. http://dx.doi.org/10.2183/pjab.86.884
[13] Kaddouri, W., El Moumen, A., Kanit, T., Madani, S., Imad, A. (2016). On the effect of inclusion shape on effective thermal conductivity of heterogeneous materials. Mechanics of Materials, 92: 28-41. http://dx.doi.org/10.1016/j.mechmat.2015.08.010
[14] Masmoudi, M., Kaddouri, W, Kanit, T, Madani, S, Ramtani, S, Imad, A. (2017). Modeling of the effect of the void shape on effective ultimate tensile strength of porous materials: Numerical homogenization versus experimental results. International Journal of Mechanical Sciences, 130: 497-507. http://dx.doi.org/10.1016/j.ijmecsci.2017.06.011
[15] Boccaccini, A.R., Ondracek, G., Mombello, E. (1996). Determination of stress concentration factors in porous materials. J. Mater Sci. Lett., 14: 534-536. http://dx.doi.org/10.1007/BF00275423
[16] Bourih, A., Bourih, K., Kaddouri, W., Masmoudi, M., Madani, S. (2022). Modeling of the pore shape effect on the effective modulus of lotus-type porous materials by a numerical homogenization technique. Advanced Materials Research, 1171: 73-86. http://dx.doi.org/10.4028/p-y2cejy
[17] Pierard, O., Friebel, C., Doghri, I. (2004). Mean-field homogenization of multi-phase thermo-elastic composites: A general framework and its validation. Composites Science and Technology, 64(10-11): 1587-1603. http://dx.doi.org/10.1016/j.compscitech.2003.11.009
[18] Doghri, I., Tinel, L. (2006). Micromechanics of inelastic composites with misaligned inclusions: Numerical treatment of orientation. Comput. Methods Appl. Mech. Engrg., 195(13-16): 1387-1406. http://dx.doi.org/10.1016/j.cma.2005.05.041
[19] Friebel, C., Doghri, I., Legat, V. (2006). General mean-field homogenization schemes for viscoelastic composites containing multiple phases of coated inclusions. International Journal of Solids and Structures, 43(9): 2513-2541. http://dx.doi.org/10.1016/j.ijsolstr.2005.06.035
[20] Doghri, I., Adam, L., Bilgerc, N. (2010). Mean-field homogenization of elasto-viscoplastic composites based on a general incrementally affine linearization method. International Journal of Plasticity, 26(2): 219-238. http://dx.doi.org/10.1016/j.ijplas.2009.06.003
[21] Perdahcioglu Semih, E., Geijselaers, H.J.M. (2010). Constitutive modeling of two-phase materials using the mean field method for homogenization. International Journal of Material Forming, 4(2): 93-102.
[22] Kammoun, S., Doghri, I., Adam, L., Robert, G., Delannay, L. (2011). First pseudo-grain failure model for inelastic composites with misaligned short fibers. Composites Part A: Applied Science and Manufacturing, 42(12): 1892-1902. http://dx.doi.org/10.1016/j.compositesa.2011.08.013
[23] Kaiser, J.M., Stommel, M. (2012). An extended mean-field homogenization model to predict the strength of short fibre polymer composites. Technische Mechanic, 32(2): 307-320.
[24] Goodarzi, M., Rouainia, M., Aplin, A.C. (2016). Numerical evaluation of mean-field homogenization methods for predicting shale elastic response. Comput Geosci., 20(5). http://doi.org/10.1007/s10596-016-9579-y
[25] Ogierman, W., Kotot, G. (2013). Mean field homogenization in multi-scale modelling of composite materials. Journal of Achievements in Materials and Manufacturing Engineering, 61(2): 343-348.
[26] Sekkate, Z., Aboutajeddine, A., Seddouki, A. (2020). Elastoplastic mean-field homogenization: Recent advances review. Mechanics of Advanced Materials and Structures, 29(3): 449-474. http://dx.doi.org/10.1080/15376494.2020.1776431
[27] Victor BLANC. (2009). Thesis: Modélisation du comportement thermo-mécanique des combustibles à particules par une approche multi-échelle. Universit´e de Provence Aix-Marseille 1. https://tel.archives-ouvertes.fr/tel-00523278v1, accessed on May 10, 2022.