Thota Sneha Sai Lakshmi![]() | Ranganadha Reddy Aluru*
| Ranganadha Reddy Aluru*![]()
© 2025 The authors. This article is published by IIETA and is licensed under the CC BY 4.0 license (http://creativecommons.org/licenses/by/4.0/).
OPEN ACCESS
Pneumonia is a deadly lung infection which can lead to life-threatening complications if left undiagnosed and untreated. Traditional diagnosis depends on radiologists reading chest X-rays manually, a time-consuming process prone to human error. Mistakes in diagnosis causes delayed or improper treatment and severe health impacts or even fatality. Following the growth of deep learning methods, automatic medical image analysis is becoming an increasingly potential means to enhance the accuracy and efficiency of diagnoses. To tackle these challenges, we propose a deep learning-based model for automated pneumonia detection using Convolutional Neural Networks (CNNs). Our research leverages the publicly available chest X-ray dataset from Kaggle to train a custom CNN model that includes three convolutional layers, batch normalization, dropout regularization, and an Adam optimizer. The model achieved an impressive test accuracy of 85.74%, showcasing its potential to aid in clinical decision-making. Additionally, this study looks into how data augmentation affects performance and considers ways to improve the model’s generalization and robustness.
pneumonia, deep learning, data augmentation, chest X-ray analysis, Convolutional Neural Network (CNN), binary classification
Pneumonia is an inflammatory infection of the lung induced by bacterial, viral, or fungal pathogens, resulting in the trapping of fluid within the alveoli and respiratory failure. Pneumonia is a serious medical risk, especially in children under five years old and elderly with weakened immune systems [1]. Pneumonia is one of the leading causes of child death, particularly in the developing world, according to the World Health Organization (WHO). Despite the medical advancements, pneumonia remains a significant global public health burden, which necessitates timely and appropriate diagnosis for effective intervention. medical imaging, particularly chest X-rays, is a standard diagnostic tool used to identify pneumonia. Radiologist interpretation, though, is subjective, time-consuming, and susceptible to human error, particularly in low-resource settings where experienced radiologists are not readily available [2]. Moreover, inter-observer diagnostic discrepancy could lead to variability in patient care outcomes [3]. In underserved areas, there is an acute dearth of trained radiologists (i.e., one radiologist per 100,000 people), and thus, AI-based diagnostic tools are an essential asset to bridge the gap and offer prompt diagnoses.
Machine learning and deep learning have become powerful tools for medical image analysis, which may make diagnosis more efficient, accurate, and accessible [4]. Convolutional Neural Networks (CNNs), a deep learning network, have outperformed conventional networks in image classification, particularly medical imaging. CNNs are able to learn and extract useful features from chest X-ray images automatically, which can increase the accuracy of pneumonia detection and reduce the requirement for expert knowledge. The ability of CNNs to process large volumes of medical images efficiently makes it a better choice for large-scale pneumonia detection, particularly where expert radiologists are limited [5]. Recent technological developments in AI-based image processing techniques have shown remarkable progress in medical diagnosis, thereby decreasing diagnostic blunders and enhancing patient outcomes. AI-based models not only aid radiologists in decision-making but also provide quick diagnosis, allowing early intervention. As large datasets in medicine are more readily available, deep learning models can revolutionize diagnostic radiology [6]. AI-based applications are not limited to other respiratory diseases, either, and automated diagnostic tools form an essential component of contemporary healthcare. Furthermore, AI-based systems have the potential to alleviate the burden on healthcare professionals, allowing them to focus on critical cases while routine screenings can be automated. The application of CNN-based models in hospitals leads to cost- and time-saving initiatives, such as reducing patient waiting times and facilitating quicker decision-making. Second, the application of AI on Electronic Health Records (EHR) leads to end-to-end analysis of patient history for further enhancing diagnostics [7]. This paper highlights the importance of integrating AI into the healthcare industry, debating real-world application issues, and proposing changes to existing automated diagnostic systems [8]. Ethical concerns and regulatory approvals for AI-based medical devices are also addressed, highlighting the importance of transparency and accountability in automated healthcare solutions.
2.1 Dataset
The data used here is taken from Kaggle’s publicly released chest X-ray dataset. It comprises labelled chest X-ray images, which are divided into "pneumonia" and "normal" categories. The dataset is predominantly made up of paediatric patient X-rays, and thus it is most suitable for the detection of pneumonia in younger patients [5].
The dataset description can be explained in Table 1, which is separated into three segments:
Table 1. Dataset description
|
Class |
Training Set |
Validation Set |
Test Set |
Total Images |
|
Normal |
1341 |
8 |
234 |
1583 |
|
Pneumonia |
3875 |
8 |
390 |
4273 |
|
Total |
5216 |
16 |
624 |
5856 |
The database has a lot of images, which provide an extremely well-balanced collection of pneumonia and normal ones. The database is a great benchmark to train machine learning models, and having a validation set guarantees that overfitting is avoided. There are frontal-view chest radiographs, which are the most widely used radiographs in clinical diagnosis. In the future, studies can investigate the use of multi-view X-rays in an attempt to further improve diagnostic performance.
To make the dataset robust, data was collected from different medical sources to make sure that there are several imaging conditions like different scanners, different resolutions, and different patient positions. Quality verification of the images was done to avoid poor-quality or corrupted images which might have an adverse effect on model performance. In addition to this, metadata like patient age, gender, and medical history were also taken into account in order to check for possible biases in the dataset and provide unbiased model predictions.
2.2 Preprocessing
In order to enhance model performance and globalizability, the following preprocessing methods were utilized:
Through the use of these preprocessing methods, the model is less sensitive to real X-ray image variation, thus more clinically applicable and diagnostic precise. The overall preprocessing and image processing pipeline is illustrated in Figure 1.

Figure 1. Overview of the proposed CNN-based image processing pipeline
2.3 Model architecture
The proposed CNN model consists of multiple layers that progressively extract the right features from chest X-ray images to enable efficient classification between pneumonia and normal cases. The detailed architecture of the CNN-2D model is illustrated in Figure 2.
It is trained with binary cross-entropy as the loss function, which is best suited for binary classification tasks. Adam optimizer with a learning rate of 0.0001 is employed to allow efficient weight updates and stable convergence during training [4]. Such optimizations as a whole improve the predictive capacity as well as the stability of the model, and therefore, it becomes appropriate for real-world clinical use.
Figure 2. Architecture of CNN model
2.4 Model compilation and training
The CNN model was trained with the pre-prepared dataset, implementing different optimization methods to enhance accuracy. Training consisted of passing input images through stacks of convolutional layers, extracting hierarchical features, and classifying them into pneumonia or normal. Every training iteration (epoch) updated the weights of the model using back propagation and gradient descent was described in Table 2.
Table 2. Hyperparameters values
|
Hyperparameter |
Value |
|
Learning rate |
0.0001 |
|
Batch size |
10 |
|
Optimizer |
Adam |
|
Epochs |
15 |
|
Loss function |
Binary cross-entropy |
2.5 Evaluation
The F1 score, Receiver Operating Characteristic (ROC) curve, accuracy matrix, and Area Under the Curve (AUC) are applied for segmentation performance assessment. Evaluation metrics also define the effectiveness of classifiers.
2.6 Accuracy metrics
An overall assessment of the performance of model on each class. Accuracy is determined by dividing the number of correct predictions by the total number of predictions made. For a complete assessment, recall, F1 score and precision are also calculated. A mathematical representation of accuracy is given below:
$A C=\frac{(\mathrm{TP}+\mathrm{TN})}{(\mathrm{TP}+\mathrm{FP}+\mathrm{FN}+\mathrm{TN})}$ (1)
where,
• TP (True Positive) is correctly identified positive cases.
• TN (True Negative) is correctly identified negative cases.
• FP (False Positive) is incorrectly classified negative cases as positive.
• FN (False Negative) is incorrectly classified positive cases as negative.
The following are the classifier performance measures using evaluation metrics.
$\mathrm{TPR}=(\text{Sensitivity}) \frac{T P}{T P+F N}$ (2)
$\mathrm{TNR}=(\text{Specificity}) \frac{T N}{T N+F P}$ (3)
$\mathrm{FPR}=\frac{F P}{F P+T N}$ (4)
where, TPR is True Positive Rate, TNR is True Negative Rate, and FPR is False Positive Rate.
Precision $=\frac{T P}{T P+F P}$ (5)
Recall $=\frac{T P}{T N+F N}$ (6)
$\begin{gathered}\mathrm{G}-\text { Mean }=\left(\prod \text { Recall } \mathrm{k}\right) \\ \mathrm{K}=1\end{gathered}$ (7)
Here, mm is the total number of categories; GG denotes the accuracy ratio of the TNR to the FPR.
The mean average precision (mAP) of the algorithm measures Precision, Recall, and Mean. mAP is used to evaluate image processing tasks and detection tasks.
In terms of results, accuracy assesses the ratio of appropriately classified examples, while recall measures the proportion of correctly identified instances to the total relevant cases.
The F1 score is yet a crucial performance measure, since it provides a balance between precision and recall, which can be said to be more informative. The formula for calculating it:
F1 Score $=\frac{2 \times \text { Precision } \times \text { Recall }}{\text { Precision }+ \text { Recall }}$ (8)
2.7 ROC
ROC curve is useful in assessing classification performance and addressing issues related to computational modeling. Figure 3 represents the connection between the false positive rate and the true positive rate at different thresholds.

Figure 3. Receiver operating characteristics FP vs. TP
The model with the highest true negative rate detected the bad cases, whereas the model that includes the highest true positive rate classified the healthy cases. To reduce both training and testing times, an overall assessment is made using the Matthews Correlation Coefficient (MCC). MCC classifies only tough datasets reliably. Unlike accuracy, which can be misleading in imbalanced datasets, MCC takes into account all classification results; that is, true negatives, true positives, false negatives, and false positives. Its values range between -1 lowest classification to +1 perfect classification; 0 denotes random predictions. The combination of hidden layers, number of epochs and hidden nodes, dropout rate, activation functions, learning rate as well as batch size impact model optimization.
Hyperparameter tuning – changing epochs, learning rate, hidden layers and activation functions in a systematic way – increase efficiency and performance. The model is adjusted so that its accuracy will be improved and the average loss will be reduced.
An experimental analysis was conducted on Google Collaboratory using the research tools developed by Google. This environment is equipped with Python programming and several pre-installed research libraries. The experiment utilized Python 3 Google Compute Engine GPUs with RAM of 12.72 GB and disk space of 68.40 GB. Mounting Google Drive transferred the dataset, and the platform's robust computational resources trained the model. A Python program that turned images into arrays and fetched them from the directory was aided by this.
All the label images are converted with Scikit-learn's Python label binarization feature and are taken from a folder for processing. The train-test-split function splits the dataset into training and testing datasets. The deep learning CNN was optimized using Adam, thereby overcoming sparse gradient noise.
2.8 Performance metrics
For model performance evaluation, accuracy was computed: Accuracy: computes the overall accuracy of the predictions. Accuracy is the proportion of correctly predicted cases to the number of cases being tested. It provides a critical measure of the ability of the model to distinguish between pneumonia and normal cases. The model performed with an accuracy of 85.74%, reflecting high reliability in classification [11]. But accuracy does not give us information about false positive and false negative rates, which can be investigated in future research using other measures like precision and recall.
3.1 Results
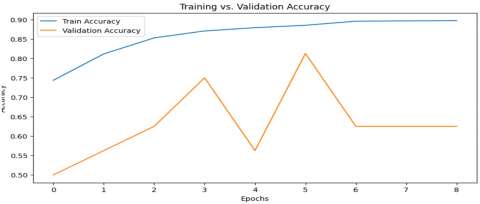
Model performance: Train accuracy: 89.84%; Test accuracy: 85.74%.
The model performed well, with 89.84% training accuracy and 85.74% test accuracy. The learning curve indicated consistent improvement in training accuracy, while validation accuracy did not fluctuate, reflecting that the model was successful in evading overfitting. The addition of data augmentation methods helped in improved generalization, enabling the model to generalize well to unseen images [12-14]. The performance of the CNN model indicates its viability in assisting automated pneumonia diagnosis, especially in medical environments where there is a need for quick and accurate detection. The training and validation accuracy was described in Figure 4 in detail.
Figure 4. Training and validation accuracy curves over epochs
3.2 Discussion
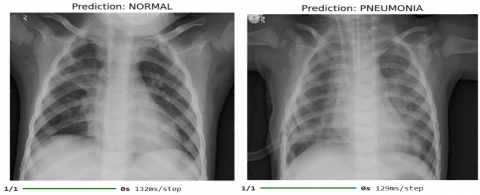
The CNN model effectively handles chest X-ray images and labels them as "pneumonia" or "normal" categories. The system receives an input X-ray image and processes it, generating an output label:
Pneumonia caption: It signifies the existence of pneumonia in the image.
Normal caption: It confirms the absence of pneumonia. the output labels of chest X-ray images can be observed in Figure 5.
The machine labeling reduces diagnostic errors and enables quicker pneumonia detection, which is highly beneficial for clinical use. Owing to its high accuracy, the model has the potential to assist radiologists in more informed decisions, reducing the workload for medical personnel, and increasing the availability of pneumonia diagnosis in rural areas [15-17]. Potential enhancements in the future may include adding explainability functionality, for instance, heatmaps pointing out the damaged areas within the X-ray images, in order to facilitate the interpretability of model outputs. In general, the CNN-based pneumonia detection model offers a stable and effective solution for the detection of pneumonia from chest X-ray images. Its application in hospitals would improve early detection and timely management, ultimately leading to better patient outcomes and lower mortality rates [18-21].
Figure 5. Model output showing classification of a chest X-ray as a classification result of normal and pneumonia
A critical limitation of deep learning models in the medical domain is their perceived "black box" nature. To mitigate this, the Gradient-weighted Class Activation Mapping (Grad-CAM) technique was used to provide interpretability to the Xception model’s predictions. Grad-CAM heatmaps were generated for representative images across each KL grade. Grad-CAM was used to visualize model attention on two correct and two incorrect classifications. In correctly classified cases, heatmaps aligned with clinically relevant lung regions as confirmed by a radiologist. Misclassified cases showed diffuse or irrelevant focus, highlighting the need for better contextual learning.
The study was able to create a deep learning pneumonia detection model from chest X-ray images using CNN. It trained and tested the model using Kaggle chest X-ray data, whose test accuracy was 85.74%. The primary performance measure was accuracy, i.e., the general capability of the model to classify pneumonia and normal ones correctly. The findings state that the proposed model is suitable to detect pneumonia and can also support radiologists clinically by diminishing time taken during diagnosis and eradicating the probability of human errors. Using data augmentation also made the generalization of the model better as it avoided overfitting the data and delivered an enhanced performance with unseen information. The proposed system classifies the X-ray images effectively in the categories "pneumonia" and "normal," thus presenting an efficient resource in supporting clinical diagnosis. Notwithstanding its excellent performance, the research does concede some limitations. Accuracy being a general indicator of correctness, the work for the future can further look at further enhancements such as the inclusion of explainability methods, the hyperparameter optimization, and enlarging the dataset for better robustness and suitability in real clinical settings of the model.
Though the existing model is effective in detecting pneumonia, a number of improvements can be made for even better efficiency: Integration with hospital information systems: It can be applied as a diagnostic assistance tool in hospitals to help radiologists come to decisions in real-time. Expansion of dataset: training the model on bigger and more heterogeneous datasets, including images from various sources, can increase its generalizability. Ulti-class classification: generalizing the model to classify different lung diseases other than pneumonia can make it more universal for clinical use. Tuned hyperparameters: more work with varying architectures, optimizers, and regularization methods can further refine model precision and stability. By filling in these gaps, the pneumonia detection system can be built into a more accurate, interpretable, and clinically relevant AI-based diagnostic system.
[1] Wardlaw, T., Salama, P., Johansson, E.W., Mason, E. (2020). Pneumonia: The leading killer of children. Lancet, 368(9541): 1048-1049.
[2] Saw, S.N., Ng, K.H. (2022). Current challenges of implementing artificial intelligence in medical imaging. Physica Medica, 100: 12-17. https://doi.org/10.1016/j.ejmp.2022.06.003
[3] Esteva, A., Chou, K., Yeung, S., Naik, N., Madani, A., Mottaghi, A., Liu, Y., Topol, E., Dean, J., Socher, R. (2021). Deep learning-enabled medical imaging and the future of radiology. NPJ Digital Medicine, 4(1): 5. https://doi.org/10.1038/s41746-020-00376-2
[4] Rajpurkar, P., Irvin, J., Zhu, K., Yang, B., Mehta, H., Duan, T., Ding, D., Bagul, A., Langlotz, C., Shpanskaya, K., Lungren, M.P., Ng, A.Y. (2017). Chexnet: radiologist-level pneumonia detection on chest x-rays with deep learning. arXiv preprint arXiv:1711.05225. https://doi.org/10.48550/arXiv.1711.05225
[5] Kermany, D.S., Goldbaum, M., Ai, W., Valentim, C.C., et al. (2018). Identifying medical diagnoses and treatable diseases by image-based deep learning. Cell, 172(5): 1122-1131. https://doi.org/10.1016/j.cell.2018.02.010
[6] Gu, M.H., Han, X.D., Liu, X.D., Sui, F.X., Zhang, Q.S., Pan, S.Q. (2023). Predictive value of Annexin A1 for disease severity and prognosis on patients with community-acquired pneumonia. Diagnostics, 13(3): 396. https://doi.org/10.3390/diagnostics13030396
[7] Patel, R., Irving, J., Brinn, A., Broadbent, M., Shetty, H., Pritchard, M., Downs, J., Stewart, R., Harland, R., McGuire, P. (2021). Impact of COVID-19 pandemic on remote mental healthcare and prescribing in psychiatry: An electronic health record study. BMJ Open, 11(3): e046365. https://doi.org/10.1136/bmjopen-2020-046365
[8] Hasan, M.R., Ullah, S.M.A., Islam, S.M.R. (2023). Recent advancement of deep learning techniques for pneumonia prediction from chest X-ray images. Medical Reports, 7: 100106. https://doi.org/10.1016/j.hmedic.2024.100106
[9] Jaiswal, A., Gian Chandani, N., Singh, D., Kumar, V., Kaur, M. (2020). Classification of the COVID-19 infected patients using DenseNet201 based deep transfer learning. Journal of Biomolecular Structure and Dynamics, 39(15): 5682-5689. https://doi.org/10.1080/07391102.2020.1788642
[10] Huang, W.E., Matifoll, J.A., Lord, D., Haggie, S. (2025). A review of imaging in the diagnosis and management of complicated paediatric pneumonia. Paediatric Respiratory Reviews, 54: 12-18. https://doi.org/10.1016/j.prrv.2024.12.001
[11] Asnake, N.W., Salau, A.O., Ayalew, A.M. (2024). X-ray image-based pneumonia detection and classification using deep learning. Multimed Tools and Applications, 83: 60789-60807. https://doi.org/10.1007/s11042-023-17965-4
[12] Ibrahim, A.U., Ozsoz, M., Serte, S., Al-Turjuman, F., Yakoi, P.S. (2024). Pneumonia classification using deep learning from chesy X-rays images during COVID-19. Cognitive Computation, 16: 1589-1601. https://doi.org/10.1007/s12559-020-09787-5
[13] Mabrouk, A., Díaz Redondo, R.P., Dahou, A., Abd Elaziz, M., Kayed, M. (2023). Pneumonia detection on chest x-ray images using ensemble of deep convolutional neural networks. Applied Sciences, 12(13): 6448. https://doi.org/10.3390/app12136448
[14] Zhang, X., Lu, S., Wang, S.H., Yu, X., Wang, S.J., Yao, L., Pan, Y., Zhang, Y.D. (2021). Diagnosis of COVID-19 pneumonia via a novel deep learning architecture. Journal of Computer Science and Technology, 37(2): 330-343. https://doi.org/10.1007/s11390-020-0679-8
[15] Rabbah, J., Ridouani, M., Hassouni, L. (2025). Improving pneumonia diagnosis with high-accuracy CNN-based chest X-ray image classification and integrated gradient. Biomedical Signal Processing and Control, 101: 107239. https://doi.org/10.1016/j.bspc.2024.107239
[16] Rajeashwari, S., Arunesh, K. (2024). Enhancing pneumonia diagnosis with ensemble-modified classifier and transfer learning in deep-CNN based classification of chest radiographs. Biomedical Signal Processing and Control, 93: 106130. https://doi.org/10.1016/j.bspc.2024.106130
[17] Apostolopoulos, I.D., Papandrianos, N.I., Apostolopoulos, D.J., Papageorgiou, E. (2024). Between two worlds: Investigating the intersection of human expertise and machine learning in the case of coronary artery disease diagnosis. Bioengineering, 11(10): 957. https://doi.org/10.3390/bioengineering11100957
[18] Aluru, R.R., Koyi, S., Nalluru, S., Chanda, C. (2021). Production of biopolymer from bacteria–A review. Environment and Earth Sciences Research Journal, 8(2): 91-96. https://doi.org/10.18280/eesrj.080205
[19] Peele, K.A., Durthi, C.P., Srihansa, T., Krupanidhi, S., Ayyagari, V.S., Babu, D.J., Indira, M., Ranganadha Reddy, A., Venkateswarulu, T.C. (2020). Molecular docking and dynamic simulations for antiviral compounds against SARS-C0V-2: A computational study. Informatics in Medicine Unlocked, 19: 100345. https://doi.org/10.1016/j.imu.2020.100345
[20] Reddy, A.R., Venkateswarulu, T.C., Indira, M., Narayana, A.V., Lohita, T.N., Sriharsha, M. (2015). Identification of membrane drug targets by subtractive genomic approach in mycoplasma pneumonia. Research Journal of Pharmacy and Technology, 8(9): 1209-1216. https://doi.org/10.5958/0974-360X.2015.00221.8
[21] Reddy, A.R., Venkateswarulu, T.C., Babu, D.J., Indira, M. (2015). Homology modelling studies of human genome receptor using modeller, swiss model server and esypred-3D tools. International Journal of Pharmaceutical Sciences Review and Research, 30(1): 1-6.