Mehri Alizadeh
OPEN ACCESS
This research describes numerical investigations on the impacts of length of main (hot) tube (95 to 125 mm) and type of the boundary condition on the thermal capability (heating and cooling) of the vortex tube and the heat and mass transfer between the cold and hot vortex cores inside a Ranque-Hilsch vortex tube applying the 3D CFD models. The cooling and heating capabilities increase severely with an increase in the main tube length upto 115mm (optimum value) and beyond L=115mm the thermal effectiveness of vortex tube decreases. The results have been compared to the experimental values with good agreement (less than 7 %).
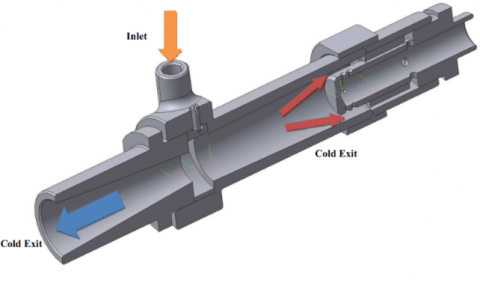
The vortex tube, also called air separator in respect of the inventors to its invention and development [1, 2], is a useful and simple device with simplified structure but very wide usages. The vortex tube is an uncomplicated device, with no moving parts which is able to separate a pressurized operating fluid into two different streams like the dirty and the clean streams (or the hot and the cold). The separation process of the vortex tube air separator can be simplified as Figure 1.
Figure 1. Schematic diagram of a vortex tube with flow directions
The parts of the separator system can be introduced as follows: a vortex chamber, some slots, a cold orifice, a working tube and a conical valve. There is a super rotational flow field with 106 rpm inside the air separator. First the fluid (which is compressed by a compressor) inters to the air separator via the nozzles (slots) and the powerful turbulent field is created during the tangential movement inside the main tube. The center of the vortex tube can be regarded as the axis of the rotation and it can be said that when the pressurized gas layers are turning tangentially around this center, the operating gas will expand and the temperature will drop. During the rotational movement of the fluid layers, the separation process occurs and the pressurized gas is divided into two flows namely the clean (cold) and the dirty (hot) flows. The rate of the clean or cold flow is controlled by a conical or throttle valve which is located at the hot side. The control valve controls the flow of the cold air through the warm air flow controlling. Here an important parameter can be defined as bellow:
$\alpha=\frac{\dot{m}_{c}}{\dot{m}_{i}}$ (1)
So, $\alpha$ is the cold flow fraction. In equation (1) the terms of $\dot{m}_{c}$ and $\dot{m}_{i}$ are the cold flow rate and the rate of the inlet gas. The vortex tube air separator is discovered (for the first time) by Ranque [1]. This device was geometrically improved by Hilsch [2]. In this article we utilize the numerical models to explain the details of the separation process inside the air separator. Researches on the vortex tube air separators has a long history, however, we explain a brief list of important works as follow: The NIST real gas model (as a CFD model) was used to investigate the flow pattern inside the air separator by Dutta et al. [3]. The capabilities of different turbulence models (the RSM, LES, k–ω, k–ɛ and SST k–ω) for predicting the flow structures within the air separator were examined by Baghdad et al. [4] and Rafiee and Sadeghiazad [5]. Some variations in the temperature drops are seen when a bended main tube is used in the structure of the air separator. These variations are reported in comparison with the air separator equipped with the straight main tube [6, 7]. Skye et al. [8] performed an experimental work on the thermal and flow separation inside a commercial vortex tube. The effect of divergent main tube has been investigated by Rahimi et al. [9] and the optimum angle for the divergent main tube has been achieved numerically. Some factors regarding the vortex tube structure (the inlet of slots, the ratio of slots, the hot and cold exit area, the rounding off edge radius, the internal radius of main tube and the convergent slots) were optimized by Rafiee et al. [10], Rafiee and Sadeghiazad [11], Pourmahmoud et al. [12] and Im and Yu [13]. Some refrigerant gases (R728, R32, R134a, R161, R744, and R22) have been examined in the vortex tube air separator and the thermal performance of air separator has been studied and the best refrigerant gas has been determined [14, 15]. MohammadI and Farhadi [16] handled a laboratory study on the optimization of the nozzle diameter and the cold flow fraction. Rafiee and Sadeghiazad [17, 18] managed some experimental setups to optimize the control valve structural parameters such as the conical angle and the cone length and proved that there are some optimized values which lead to the best thermal capability. The convergent nozzles have been examined and optimized by Rafiee and Rahimi [19]. The impact of a new shape of the hot tube (the convergent main tube) is experimentally tested by Rafiee et al. [20]. Their results stated that there is an optimized angle for the convergent main tube to produce the best cooling capacity. Xue et al. [21] and Rafiee and Sadeghiazad [22] proposed a new energy explanation to analyze the thermal distribution and the exergy density inside the air separator applying the measured flow factors along the hot tube. The thermophysical parameters (the total temperature, the total pressure and the tangential velocity) inside the vortex tube are comprehensively reported by Rafiee and Rahimi [23]. A valuable work was done to analyze the isotope separation using vortex tubes by Lorenzini and Spiga [24]. The influence of inlet temperature on the vortex tube performance is investigated by Pourmahmoud et. al [25]. In this work, we considered the advantage of utilizing the best length of main (hot) tube (for cooling or heating) and its clear role in the improvement of the thermal capacity of the vortex tube air separator as the main reasons for doing this work. This work tries to choose the best (optimum) hot tube length which leads to the highest cooling and heating capabilities.
The extremely rotating and compressible flow field inside the air separator is considered due to the creation of a three dimensional structure as the main computational domain. A commercial code (Fluent 6.3.26) is employed to simulate the turbulent patterns inside the air separator using the standard k-ε turbulence model. There is a developed numerical model restricted by following consideration: (a) the operating fluid properties are constant; (b) the flow field regime is assumed full turbulent; (c) the steady state condition is considered. With these conditions and assumptions, we can present the governing equations as the continuity (conservation of mass), momentum and energy equations, which can be written as:
$\frac{\partial}{\partial x_{j}}\left(\rho u_{j}\right)=0$ (2)
$\frac{\partial}{\partial x_{j}}\left(\rho u_{i} u_{j}\right)=-\frac{\partial p}{\partial x_{i}}+\frac{\partial}{x_{j}}\left[\mu\left(\frac{\partial u_{i}}{\partial x_{j}}+\frac{\partial u_{j}}{\partial x_{i}}-\frac{2}{3} \delta_{i j} \frac{\partial u_{k}}{\partial x_{k}}\right)\right]+\frac{\partial}{\partial x_{j}}(-\overline{\rho u_{i}^{\prime} u_{j}^{\prime}})$ (3)
$\frac{\partial}{\partial x_{i}}\left[u_{i} \rho\left(\frac{1}{2} u_{j} u_{j}+h\right)\right]=\frac{\partial}{\partial x_{j}}\left[u_{i}\left(\tau_{i j}\right)_{e f f}+k_{e f f} \frac{\partial T}{\partial x_{j}}\right]$
$k_{e f f}=\frac{c_{p} \mu_{t}}{\mathrm{Pr_{t}}}+K$ (4)
One of the assumptions to simplify the heat transfer computations is the consideration of the operating fluid as an ideal gas, so, there is the compressibility effect:
$p=\rho R T$ (5)
Equations (6) and (7) present the detailed configurations of the dissipation rate (ε) and the turbulence kinetic energy (k) regarding the standard k-ε turbulence model.
$\frac{\partial}{\partial t}(\rho \varepsilon)+\frac{\partial}{\partial x_{i}}\left(\rho \varepsilon u_{i}\right)=\frac{\partial}{\partial x_{j}}\left[\left(\mu+\frac{\mu_{t}}{\sigma_{\mathcal{E}}}\right) \frac{\partial \varepsilon}{\partial x_{j}}\right]+C_{1 \varepsilon} \frac{\varepsilon}{k}\left(G_{k}+C_{3} G_{b}\right)-C_{2 \varepsilon} \rho \frac{\varepsilon^{2}}{k}$ (6)
$\frac{\partial}{\partial t}(\rho k)+\frac{\partial}{\partial x_{i}}\left(\rho k u_{i}\right)=\frac{\partial}{\partial x_{j}}\left[\left(\mu+\frac{\mu_{t}}{\sigma_{k}}\right) \frac{\partial k}{\partial x_{j}}\right]+G_{k}+G_{b}-\rho \varepsilon-Y_{M}$ (7)
Here Gk and Gb are the turbulence kinetic energy generation regarding the gradients of the mean velocity and the buoyancy effect, respectively. Also, YM is the fluctuating stretch contribution in the compressible turbulence to the overall rate of dissipation. Also, there are two constants as C1ε and C2ε. It should be said that σε and σk are the Prandtl numbers (turbulent). Also, the constants in equation (6) and (7) are presented as follow: σε = 1.3, C1ε = 1.44, C2ε = 1.92, Cμ = 0.09, σk = 1.0, σε = 1.3.
3.1 3D CFD MODEL
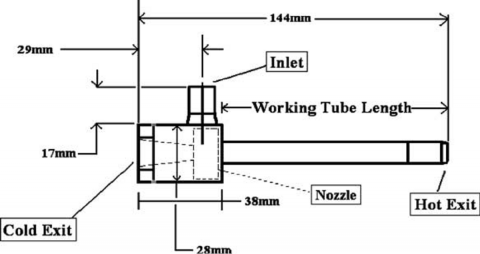
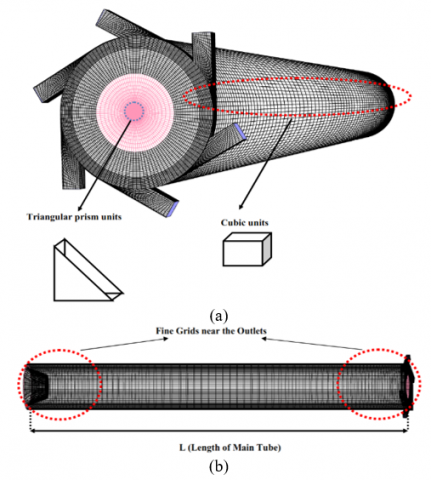
The three-dimensional model of the air separator is created and developed based on the experimental air separator cooling system used by Skye et al. (2006). The model of the vortex tube air separator used in their tests was ExairTM 708 slpm. Figure 2 depicts the schematic representation of the real model of the air separator used by Skye et al. (2006). The structural dimensions of the air separator are summarized in Table. 1. Figure 3a shows the created computational grids. As seen in Figure 3a, the created CFD model of the air separator uses the structured grid pattern to divide the domain into the cubic units (With the exception of the volume units around the center line which are triangular prism units), because of this fact that the calculations of a domain with an unstructured mesh grid system usually take more CPU time than the calculation of the domain with the structured mesh grid arrangement. Also, the structured arrangements are more accurate compared to the unstructured ones.
In the computations, the velocity pressure coupling uses the SIMPLE algorithm. Also, the convective items have been discretized using the second order upwind scheme. The minimum value for the convergence standard regarding the turbulence and the velocity quantities and the continuity equation was 10-6 and 10-13 for the energy terms. One of the advantages of the created CFD model is that the hot control valve is completely modeled (as seen in Figure 3b) which leads to real modeling of the flow pattern inside the air separator (as much as possible). Because of the complexity of the flow field inside the air separator, some special combinations of the relaxation factors are used to simulate the separation process inside the device. The ranges of the relaxation factors are presented as follow: Pressure (0.1 to 0.2), Density (0.1 to 1), Body force (0.1 to 1), Momentum (0.1 to 0.6) and Energy (0.1 to 1). In this CFD model, the mesh grids are finer (Figure 3b, for more accuracy) close to the cold and the hot exhausts where the cold and hot temperatures are measured in these areas.
Table 1. Geometrical details of the CFD models which are similar to the experimental dimensions
|
Value |
Structural Parameter |
|
95 mm2 |
Area of hot exit |
|
11 mm |
Diameter of hot exit |
|
6.2 mm |
Diameter of cold exhaust |
|
8.2 mm2 |
Slot area |
|
1.41 mm |
Width of nozzle |
|
30.3 mm2 |
Area of cold exit |
|
0.97 mm |
Height of nozzle |
|
11.4 mm |
Diameter of main tube |
|
106 mm |
Length of main tube |
Figure 2. Structure diagram of the air separator used in the tests
Figure 3. a) Mesh arrangement of the CFD model, b) Longitudinal arrangement of the mesh grids
3.2 Grid independence study, boundary conditions and validation
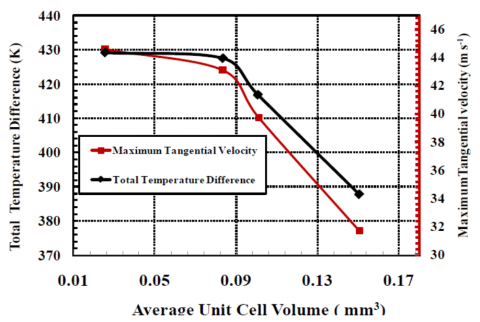
A careful analyzing for the grid-independence process of the CFD computations is performed to concentrate on the validity and the accuracy of the CFD outputs. During the grid-independence test, the 3D CFD models are created based on various average unit cell volumes. For this reason, four grid systems are created and analyzed to consider the most accurate grid numbers for the CFD models. The thermal and velocity investigations have been done for four different average unit cell volumes. In this case, the optimum cold flow fraction is 0.3 which the highest cooling power can be found at this cold flow fraction. So the independence study is conducted at this cold flow fraction ($\alpha$=0.3). The variations of two main parameters namely; the maximum tangential velocity and the cold exit temperature difference are considered for different unit cell volumes as shown in Figure 4. As seen in Figure 4, applying the numerical models with the average unit cell volumes smaller than 0.0257 mm3 (which corresponds to 287000 cells) cannot make a big difference in the results. After this average cell volume (0.0257 mm3), the difference between the results is small, and the 287000 cells can present both accuracy and efficiency as well, so it is applied for all the models in this research.
Figure 4. Grid independence analysis of total temperature difference (black axis) and maximum tangential velocity (red axis)
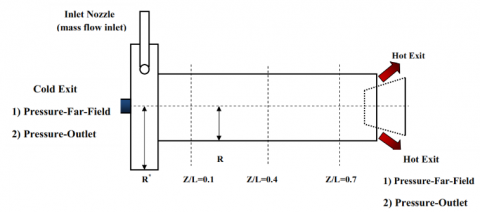
Figure 5 shows the schematic diagram of the boundary conditions used in the vortex tube air separator CFD model. The mass-flow-inlet boundary condition is considered for the injectors with the mass flow rate 8.35 gr. s-1 (4.8 bar) and the temperature at the slots is adjusted at the ambient temperature 294.2 K (Based on the experimental data). The no-slip situation is applied on the air separator's walls. There are two types of boundary conditions which can be used at the slots surfaces namely Pressure-Far-Field and Pressure-Outlet. When the pressure values at the cold and hot exhausts are measured in the experiments, the scientists can use the Pressure-Outlet boundary condition to perform the computations. This method is applicable for those who have access to laboratory data. In this paper, we introduce a boundary condition method for use by researchers who do not have access to laboratory data, in other words, this article introduces a simple way to analyze a real model of the air separator without even knowing the pressure values at the exhausts. There is no need for the pressure values when the model is created based on the pressure-far-field boundary conditions. So, we have to prove that the results of the two methods (Pressure-Far-Field and Pressure-Outlet) are consistent with each other. The procedure to change the cold flow fraction during the application of different boundary conditions is as follow: a. Pressure-Outlet: Achieved by considering a fixed pressure value at the cold outlet and changing the pressure at the hot outlet (as the experimental values). b. Pressure-Far-Field: Obtained by adjusting a constant cold exit area and varying the hot area. c. Experimental model: Achieved by the control valve performance. So, it can be seen that the second mode (Pressure-Far-Field) is the closest option to the experimental process
Figure 5. Details of the boundary conditions used in the computations
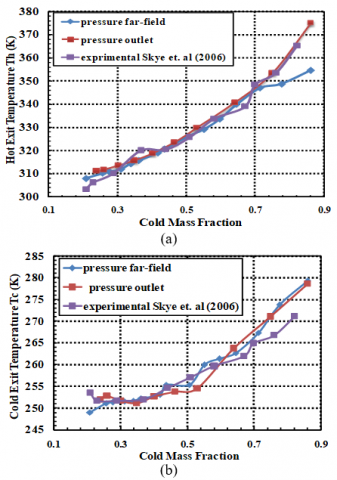
Figure 6. Validation of experimental values with numerical data using both boundary conditions; a) Hot temperature, b) Cold temperature
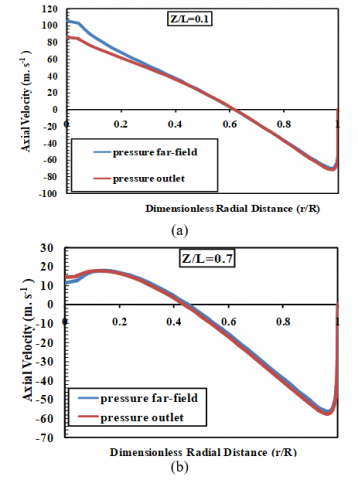
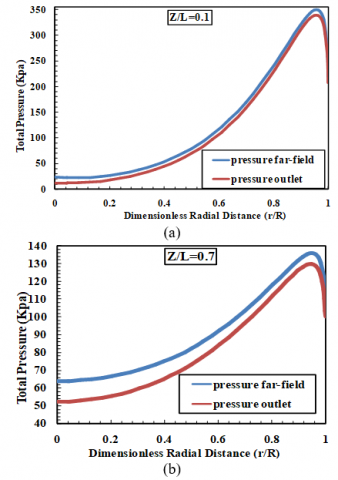
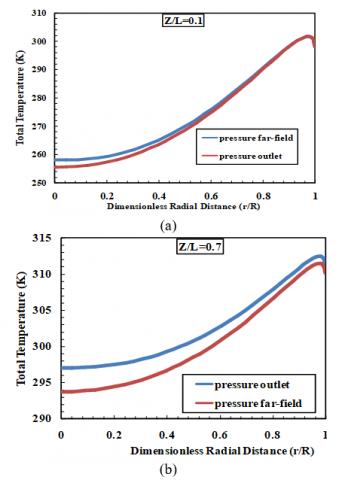
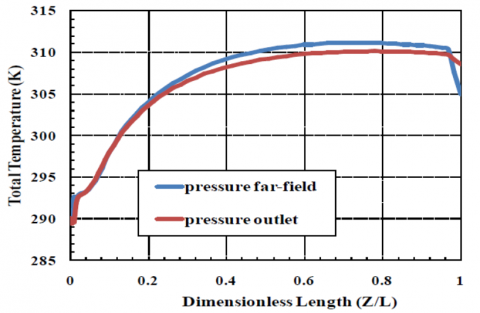
In order to compare the similarity of the mentioned boundary conditions, the comparison between the numerical outputs (cold and hot temperatures resulted from both boundary conditions) and experimental results (Skye et al. [8]) is shown in Figure 6. All structural factors (as seen in Table 1) of real and CFD models are completely similar. The only difference between the CFD models is the type of the boundary conditions and the operating conditions are adjusted as the real conditions. The adiabatic boundary condition is applied to the main tube wall (the outer surface) and the convection heat transfer between the air separator and the ambient is neglected which is the main difference between the computational and real models. As depicted in Figure 6, the results of the 3D computations (for both boundary conditions) are in agreement with the experimental outputs from the real model and all the predicted values are within 7% of the laboratory results, which is within the acceptable range. Figures 6 show that the developed model is an accurate model which creates the reliable results using both boundary conditions (Pressure-Far-Field is used or Pressure-Outlet). In order to present a complete comparison between the Pressure-Far-Field and the Pressure-Outlet boundary conditions, some parameters such as axial velocity, tangential velocity, total pressure and total temperature at three different longitudinal sections (z/L=0.1and 0.7 as Figure 5) of the working tube have been studied as a function of r/R (dimensionless radial distance), as well as the total temperature on the wall of the vortex tube air separator. The axial and rotational velocities, the total pressure and temperature distributions in different axial sections have been shown in Figure s. 7-11. These Figure s illustrate a comparative presentation of the CFD results with employing two different boundary conditions and one can see the good adjustability of the results for both models.
Figure 7. Comparison of the axial velocities at different longitudinal sections regarding two different boundary conditions; a) Z/L=0.1, b) Z/L=0.7
Figure 8. Comparison of the axial velocities at different longitudinal sections regarding two different boundary conditions; a) Z/L=0.1, b) Z/L=0.7
Figure 9. Comparison of the total pressure variations at different longitudinal sections regarding two different boundary conditions; a) Z/L=0.1, b) Z/L=0.7
Figure 10. Comparison of the total temperature variations at different longitudinal sections regarding two different boundary conditions; a) Z/L=0.1, b) Z/L=0.4 and c) Z/L=0.7
Figure 11. Indication of the total temperature on the wall of the main tube for two different boundary conditions
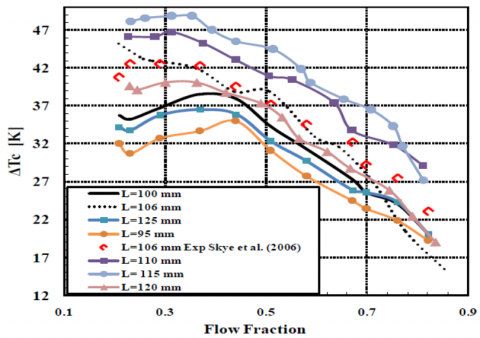
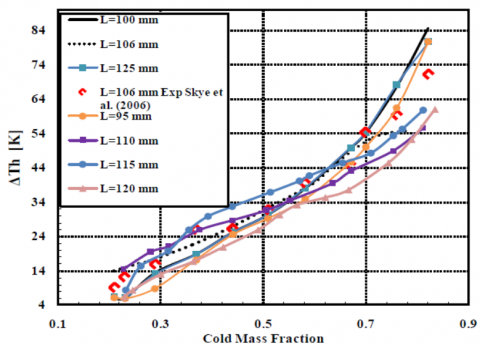
In the present study, the air separator thermal performance in the terms of cold and hot exhaust temperatures (Tcand Th) is analyzed, also the cold and hot power separation rates ($\dot{Q}_{c}$ and $\dot{Q}_{h}$) are predicted numerically. This prediction is based on different hot tube lengths which are used as the variable geometrical parameter. The main objective of this investigation is to achieve the most accurate predicting of cooling and heating capacities by changing the length of main tube which controls the energy and flow separation process inside the commercial vortex tube. Figure 12 presents the variation of the cold temperature difference ΔTc (Ti-Tc) at the exhaust of the cold orifice as a function of cold flow fraction. As seen in Figure 12, the trend of the experimental curve shows that the temperature difference ΔTc of the cold exit decreases with the increasing cold flow fraction (for the cold flow fraction values greater than 0.36). This means that the cold temperature Tc increases for the cold flow fraction values greater than 0.36. In the case of L=106 mm (the validation case), there is a favorable agreement between the experimental results and the CFD outputs which proves that the numerical model is an accurate and reliable model to predict the thermal performance of the vortex tube air separator. The previous 3D model is used to analyze and predict the energy and gas separations inside the air separator using other main tubes (with different length) including 95, 100, 110, 115, 120 and 125 mm. As the results of Figure 14, excluding the models with L=115 and 110 mm, all models with different main tube lengths provide a lower cold temperature difference ΔTc than the experimental results (or validation case L=106 mm), so, using these vortex tubes instead of optimum models (L=110 and 115mm) leads to a lower cooling performance. For example, the cold exhaust temperature difference for L=115 mm as the main tube is 48.85 K, in this way if L=110 mm and L=120 mm is applied in the structure of vortex tube, the cold temperature difference reduces around 3.6 and 8.7 K, respectively (for α=0.37). Figure 12 indicates that the minimum possible cold temperature or the maximum cold temperature difference corresponds to L= 115 mm as the optimum model. This means that there is the optimum value for the length of main tube (which is equal to 115 mm) which provides the maximum cooling capability. As seen in Figure 12, applying the vortex tube equipped with a main tube with length of 115mm improves the cooling effectiveness around 6.86 K (16.35 %). Figure 13 presents the behavior of the temperature curves regarding the hot gas which escapes from the hot exhaust (as a function of cold mass fraction) applying different main tube lengths.
As shown in Figure 13, all of vortex tubes (with different lengths) present a same general tendency at the hot exit at different cold flow fractions. Figure 13 shows that the hot exit temperature difference ΔTh (Th-Ti) enhances with increasing cold flow fraction in all models. Figure 13 indicates that if the vortex tube air separator is used as the heating system there is no major difference between the mentioned lengths. In the case of L=106 mm, the experimental and numerical hot temperature differences have an agreement together perfectly, so we can trust the numerical method to predict the hot temperatures as well as the cold exit temperature. The temperature range of the hot outlet for different vortex tubes that exit from the hot exhaust is found between 300 K and 378.86 K (the hot temperature difference is found between 5.87 and 84.68). Table 2 summarized the numerical results of the hot and cold exhaust temperatures (Tc and Th) and their differences (∆Tc and ∆Th) for all types of main tubes at the cold flow fraction of α=0.3. The results show that there are two different optimum lengths; one for the heating purposes and another for the cooling usages. As the results, the vortex tubes with L=110 mm and L= 115 mm provide the maximum cooling and heating effectiveness by Tc= 245.41 K for L=115 mm and Th=315.25 K for L=110 mm. so, for cooling usages the length of 115 mm in the optimum model and in the case of heating usages, the length of 110 mm is the optimum case. Another parameter that illustrates the air separator performance is the energy separation rate at the hot and cold exits ($\dot{Q}_{c}$ and $\dot{Q}_{h}$) which can be evaluated as follows:
$\dot{Q}_{c}=\dot{m}_{c} c_{p}\left(T_{i}-T_{c}\right)$ (9)
$\dot{Q}_{h}=\dot{m}_{h} c_{p}\left(T_{h}-T_{i}\right)$ (10)
Figure 12. Variation of the cold temperature difference for different lengths of main tube as a function of cold flow fraction (compared with the experimental results)
Figure 13. Variation of the hot exhaust temperature difference for different lengths of main tube as a function of cold flow fraction (compared with the experimental results)
Table 2. Numerical temperature separations regarding different lengths of main tubes at the cold mass fraction α = 0.3
|
Length of Main Tube (mm) |
Average Cold Exhaust Temperature (K) |
Average Hot Exhaust Temperature (K) |
$\Delta T_{c}$ (K) |
$\Delta T_{h}$ (K) |
$\Delta T_{t}$ (K) |
|
95 |
261.5 |
302.9 |
32.7 |
8.77 |
41.4 |
|
100 |
257.4 |
307.5 |
36.7 |
13.3 |
50.2 |
|
106 |
251.3 |
310.9 |
42.8 |
16.7 |
59.6 |
|
110 |
247.4 |
315.2 |
46.7 |
21.0 |
67.7 |
|
115 |
245.4 |
313.9 |
48.7 |
19.7 |
68.5 |
|
120 |
254.1 |
307.1 |
40.0 |
12.9 |
53.0 |
|
125 |
258.4 |
307.2 |
35.7 |
13.0 |
48.8 |
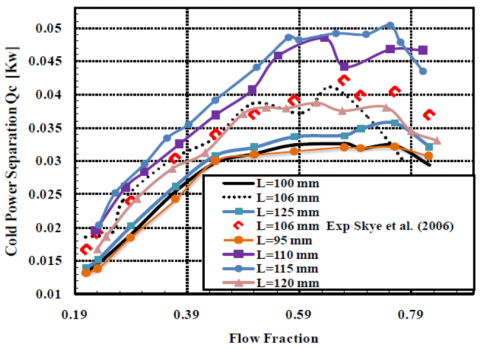
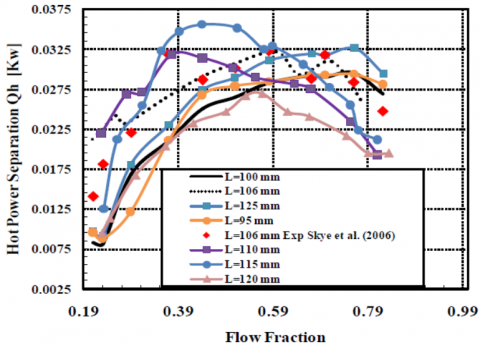
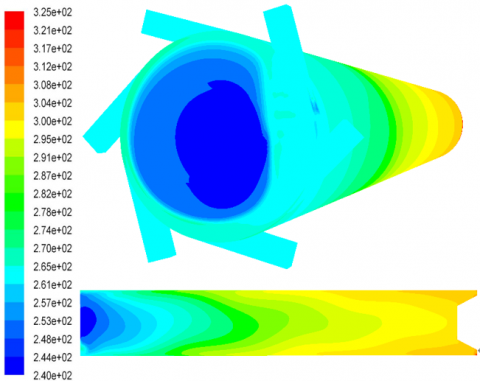
Figures. 14 and 15 depict the cold and hot power separation ($\dot{Q}_{c}$ and $\dot{Q}_{h}$) variations of the vortex tube air separator applying different lengths of main (hot) tube (in comparison with the experimental values). Both experimental results and CFD models show the maximum power separation occurs at the cold fraction about 0.65. The rate of the energy separation enhances with increasing cold flow fraction in the range of 0.21-0.65. For the cold flow fraction values greater than 0.7, the increasing trends of the power separations are stopped and the thermal rates decreases with the increase in the cold flow fraction. The resulted total temperature contours are plotted as seen in Figure 16 for L= 115mm. This Figure shows the cold core and the hot peripheral flow along the main tube of the vortex tube air separator. Following assumptions are made; the inlet mass flow rate of 8.34 g s-1, the inlet temperature of 294.2 K and the working fluid is air. The minimum and maximum total temperatures produced under these operating conditions are 240K and 325 K, respectively. The total temperature contour plotted in Figure 16 is related to α=0.3 (which is the optimum cold flow fraction); this means that the machine produces the maximum cooling capacity in this cold flow fraction.
Figure 14. Variation of the cold power separation for different lengths of main tubes as a function of cold flow fraction (compared with the experimental results)
Figure 15. Variation of the hot power separation for different lengths of main tubes as a function of cold flow fraction (compared with the experimental results)
Figure 16. Temperature distribution inside the vortex tube operating with compressed air, α=0.3, using optimum length for cooling usages (L=115 mm)
In this study, a 3D CFD model was improved to investigate the thermal and gas separations inside the vortex tube air separator (as a predictive tool). This is a developed 3D numerical model restricted by following considerations: (a) the operating fluid properties are constant; (b) the flow field regime is assumed full turbulent; (c) the steady state condition is considered .A commercial code (Fluent 6.3.26) is employed to simulate the turbulent patterns inside the air separator using different main tube lengths including L= 95, 100, 106, 110, 115, 120 and 125 mm. The study on the effects of using different main tube lengths (as the variable structural parameter) on the cooling and heating performance of an vortex tube air separator was the main objective of this research. The results of this study can help the researchers to choose the best length of the main tube for the cooling and heating usages to achieve the highest thermal performance. As a conclusion, for the cooling or heating the special zone by means of the vortex tube air separator, L=115 and 110mm are the best choice and provide the maximum thermal (heating and cooling) capabilities. A comprehensive comparison was performed in this article between two different types of boundary conditions for the hot and the cold exhausts i.e. Pressure-Far-Field and Pressure-Outlet. When the pressure values at the cold and hot exhausts are measured in the experiments, the scientists can use the Pressure-Outlet boundary condition to perform the computations. This method is applicable for those who have access to laboratory data. In this paper, we introduce a boundary condition method for use by researchers who do not have access to laboratory data, in other words, this article introduces a simple way to analyze a real model of air separator without even knowing the pressure values at the exhausts. There is no need for the pressure values when the model is created based on the pressure-far-field boundary condition. Also, the comparison between present numerical results and the available measured experimental data, revealed a good and reliable agreement.
[1] Ranque, G.J. (1933). Experiments on expansion in a vortex with simultaneous exhaust of hot air and cold air. Le Journal de Physique et le Radium, 4: 112-114.
[2] Hilsch, R. (1947). The use of expansion of gases in a centrifugal field as a cooling process. The Review of Scientific Instruments, 18: 108-113. https://doi.org/10.1063/1.1740893
[3] Dutta, T., Sinhamahapatra, K., Bandyopadhyay, S.S. (2011). Numerical investigation of gas species and energy separation in the Ranque–Hilsch vortex tube using real gas model. International Journal of Refrigeration, 34(8): 2118-2128. https://doi.org/10.1016/j.ijrefrig.2011.06.004
[4] Baghdad, M., Ouadha, A., Imine, O., Addad, Y. (2011). Numerical study of energy separation in a vortex tube with different RANS models. International Journal of Thermal Sciences, 50(12): 2377-2385. https://doi.org/10.1016/j.ijthermalsci.2011.07.011
[5] Rafiee, S.E., Sadeghiazad, M.M. (2016). Three-dimensional computational prediction of vortex separation phenomenon inside Ranque-Hilsch vortex tube. Aviation, 20(1): 21-31. https://doi.org/10.3846/16487788.2016.1139814.
[6] Rafiee, S.E., Ayenehpour, S., Sadeghiazad. M.M. (2016). A study on the optimization of the angle of curvature for a Ranque–Hilsch vortex tube, using both experimental and full Reynolds stress turbulence numerical modelling. Heat and Mass Transfer, 52(2): 337-350. https://doi.org/10.1007/s00231-015-1562-y
[7] Valipour, M.S., Niazi, N. (2011). Experimental modeling of a curved Ranque–Hilsch vortex tube refrigerator. International journal of refrigeration, 34(4): 1109-1116. https://doi.org/10.1016/j.ijrefrig.2011.02.013
[8] Skye, H.M., Nellis, G.F., Klein, S.A. (2006). Comparison of CFD analysis to empirical data in a commercial vortex tube. International journal of refrigeration, 29(1): 71-80. https://doi.org/10.1016/j.ijrefrig.2005.05.004
[9] Rahimi, M., Rafiee, S.E., Pourmahmoud, N. (2013). Numerical investigation of the effect of divergent hot tube on the energy separation in a vortex tube. International Journal of Heat and Technology, 31(2): 17-26.
[10] Rafiee, S.E., Rahimi, M., Pourmahmoud, N. (2013). Three-dimensional numerical investigation on a commercial vortex tube based on an experimental model- part I: Optimization of the working tube radius. International Journal of Heat and Technology, 31(1): 49-56, 2013.
[11] Rafiee, S.E., Sadeghiazad, M.M. (2015). 3D numerical analysis on the effect of rounding off edge radius on thermal separation inside a vortex tube. International Journal of Heat and Technology, 33(1): 83-90. https://doi.org/10.18280/ijht.330112
[12] Pourmahmoud, N., Hasanzadeh, A., Rafiee, S.E., Rahimi, M. (2012). Three dimensional numerical investigation of effect of convergent nozzles on the energy separation in a vortex tube. International Journal of Heat and Technology, 30(2): 133-140.
[13] Im, S.Y., Yu, S.S. (2012). Effects of geometric parameters on the separated air flow temperature of a vortex tube for design optimization. Energy, 37(1): 154-160. https://doi.org/10.1016/j.energy.2011.09.008
[14] Pourmahmoud, N., Rafiee, S.E., Rahimi, M., Hasanzadeh, A. (2013). Numerical energy separation analysis on the commercial Ranque-Hilsch vortex tube on basis of application of different gases. Scientia Iranica., 20(5): 1528-1537.
[15] Han, X., Li, M., Wu, K., Wang, Z., Tang, L., Chen, G., Xu, X. (2013). The influence of working gas characteristics on energy separation of vortex tube. Applied Thermal Engineering, 61(2): 171-177. https://doi.org/10.1016/j.applthermaleng.2013.07.027
[16] Mohammadi, S., Farhadi, F. (2013). Experimental analysis of a Ranque–Hilsch vortex tube for optimizing nozzle numbers and diameter. Applied Thermal Engineering, 61(2): 500-506. https://doi.org/10.1016/j.applthermaleng.2013.07.043
[17] Rafiee, S.E., Sadeghiazad, M.M. (2014). Effect of conical. valve angle on cold-exit temperature of vortex tube. Journal of Thermophysics and heat transfer, 28: 785-794. https://doi.org/10.2514/1.T4376.
[18] Rafiee, S.E., Sadeghiazad, M.M. (2014). Three-dimensional and experimental investigation on the effect of cone length of throttle valve on thermal performance of a vortex tube using k–ɛ turbulence model. Applied Thermal Engineering, 66(1-2): 65–74. https://doi.org/10.1016/j.applthermaleng.2014.01.073
[19] Rafiee, S.E., Rahimi, M. (2013). Experimental study and three-dimensional (3D) computational fluid dynamics (CFD) analysis on the effect of the convergence ratio, pressure inlet and number of nozzle intake on vortex tube performance-Validation and CFD optimization. Energy, 63: 195-204. https://doi.org/10.1016/j.energy.2013.09.060
[20] Rafiee, S.E., Sadeghiazad, M.M., Mostafavinia, N. (2015). Experimental and numerical investigation on effect of convergent angle and cold orifice diameter on thermal performance of convergent vortex tube. Journal of Thermal Science and Engineering Applications, 7(4): 041006. https://doi.org/10.1115/1.4030639
[21] Xue, Y., Arjomandi, M., Kelso, R. (2013). Energy analysis within a vortex tube. Experimental Thermal and Fluid Science, 52: 139-145. https://doi.org/10.1016/j.expthermflusci.2013.09.004
[22] Rafiee, S.E., Sadeghiazad, M.M. (2014). 3D CFD exergy analysis of the performance of a counter flow vortex tube. International Journal of Heat and Technology, 32 (1-2): 71-77. https://doi.org/10.18280/ijht.320111
[23] Rafiee, S.E., Rahimi, M. (2014). Three-Dimensional Simulation of Fluid Flow and Energy Separation Inside a Vortex tube. Journal of Thermophysics and Heat Transfer, 28(1): 87-99. https://doi.org/10.2514/1.T4198
[24] Lorenzini, E., Spiga, M. (1982). Aspetti fluidodinamici della separazione isotopica mediante tubi a vortice di Hilsch Ingegneria, (5-6): 121-126.
[25] Pourmahmoud, N., Rahimi, M., Rafiee, S.E., Hasanzadeh, A. (2014). A numerical simulation of the effect of inlet gas temperature on the energy separation in a vortex tube. Journal of Engineering Science and Technology, 9(1): 81-96.