
Jayashree Patil* | Shwetambari Chiwhane
© 2026 The authors. This article is published by IIETA and is licensed under the CC BY 4.0 license (http://creativecommons.org/licenses/by/4.0/).
OPEN ACCESS
An accurate and noninvasive Non-Alcoholic Fatty Liver Disease (NAFLD) assessment is crucial for its efficient management. In this paper, we present a multimodal DenseNet121-based feature fusion model that uses liver ultrasound images and clinical biomarkers for automated NAFLD classification. The model consists of a pre-trained DenseNet121 network with an attention mechanism to learn discriminatory features from liver ultrasound images, whereas the clinical data is fed into fully connected layers to encode structured data. The multimodal data is merged at the feature level before being fed into the softmax classifier to classify three disease-status classes: normal, benign, and malignant. The model was trained using a publicly available multimodal dataset including liver ultrasound images and patients' clinical characteristics. The experimental results show that our model achieves good results compared to single-modal and baseline models, with an accuracy (95.35%), precision (91.00%), recall (92.67%), F1-score (91.83%), and area under the curve (AUC) (0.97) in a single run. Using 3-fold stratified cross-validation, the fine-tuned DenseNet121 model achieved an accuracy of 0.91 ± 0.0276 (95% CI: 0.876–0.944) and an AUC of 0.92 ± 0.03. Our ablation study demonstrates that our proposed attention mechanisms and multimodal fusion are critical components in our network, and a statistical analysis (p < 0.05) proves their significance.
NAFLD, biomarkers, liver disease, DenseNet121, multimodal fusion, attention mechanism, deep learning, ultrasound imaging
Non-Alcoholic Fatty Liver Disease (NAFLD) is among the most common chronic liver diseases worldwide and has a strong correlation with metabolic diseases like obesity and diabetes. The disease can progress from steatosis to non-alcoholic steatohepatitis (NASH), fibrosis, cirrhosis, and eventually to hepatocellular carcinoma. In these stages, fibrosis stage severity in the liver is the most important predictive factor since it impacts the disease’s prognosis and development. Therefore, a reliable and early diagnosis of NAFLD stage severity is critical for early intervention and treatment. Liver biopsy has served as the traditional method for measuring liver fibrosis. Liver biopsy is invasive and may involve procedural risks and sampling variability. Therefore, medical professionals now prefer to use non-invasive diagnostic methods such as ultrasound, computed tomography (CT), and magnetic resonance imaging (MRI). Medical professionals choose ultrasound imaging as their primary imaging tool because it offers low costs, high accessibility, and dependable performance. The methods used for interpretation require expert knowledge, but the level of expertise varies between different users.
The recent progress in artificial intelligence (AI) techniques such as deep learning (DL) and radiomics has brought tremendous improvements in the automated assessment of liver disease. Convolutional neural network (CNN) and transformer architectures have proven to be successful in identifying complex patterns in medical imaging data, and the use of radiomics facilitates the quantification of tissue features. On the other hand, machine learning (ML) approaches based on clinical and biochemical data have provided promising results for predicting disease risk and development. Although much research has been conducted in the area, most of the previous works deal with unimodal datasets.
Several methods have been developed to overcome the above-mentioned shortcomings by employing multimodal learning techniques, which allow for combining imaging information and clinical data in order to enhance the precision and reliability of diagnosis results. A combined analysis of complementary properties from different information sources provides for a more thorough assessment of the disease. Nevertheless, issues arise when it comes to efficient feature fusion, explainability, and practical implementation.
This study proposes a feature-level multimodal Deep Feature Fusion technique, using the DenseNet121 model for extracting features from the ultrasound images and clinical data, and applying an attention mechanism to identify diagnostically significant regions of the image. Our goal is to develop an automatic classifier capable of predicting the severity of NAFLD using the provided data and multimodal representation of data sources.
This paper is organized as follows: Section 2 reviews previous work on the use of AI for NAFLD, and Section 3 synthesizes this literature and identifies the research gaps. Section 4 describes the experimental setup, and Section 5 presents the dataset. Section 6 details the proposed attention-guided DenseNet121 framework. Section 7 reports the results, Section 8 discusses them, and Section 9 concludes the paper.
The application of AI, particularly ML and DL, has emerged as a transformative approach for the non-invasive diagnosis, risk stratification, and management of NAFLD. Early research illustrated the possibility of applying transfer learning using deep CNNs to detect liver steatosis on ultrasound images with great precision, creating the basis for further AI-assisted technologies [1]. Further studies broadened the range of applications of ML, where one group of scientists discovered possible new NAFLD biomarkers using ML analysis [2], and another team created prediction models based on NHANES data for the general population of the USA [3]. At the same time, an ML approach for diagnosing NAFLD was designed, which showed enhanced prediction results due to ensemble learning methods [4]. In 2022, a significant breakthrough occurred in this area, as scientists conducted a comprehensive review of non-invasive biomarkers of liver inflammation [5] and explored imaging biomarkers of liver fibrosis in NAFLD [6]. In particular, studies focused on NAFLD progression, creating ML models that would predict the development of NASH and/or fibrosis from NAFLD [7]. Other studies used ML algorithms for large-scale NAFLD classification and diagnosis [8]. Other studies used ML techniques along with experimental methods to detect promising biomarker genes [9], and some reviews covered AI applications in liver diseases as a whole, addressing diagnoses, prognoses, and predictions of therapeutic responses [10]. There have been attempts to develop a novel ML method based on time series analysis for NAFLD risk stratification [11].
The year 2023 saw the emergence of diverse methodologies in terms of the application of AI in NAFLD cases. Different ML methods were analyzed and compared in order to find the best approach for predicting and classifying liver disease [12]. Other works focused on the application of DL models for detecting NAFLD, which demonstrated clear advantages of deep models over the classical ones [13]. New methods of prediction based on anthropometric and body composition indices in NAFLD patients were suggested, showing the possibilities of creating inexpensive and easily available methods of screening [14]. An analysis of problems and prospects of DL application in liver disease diagnostics was carried out [15]. Dynamic ML models for predicting NAFLD within health checkup cohorts utilizing longitudinal datasets have been formulated, proving the importance of time-based data in enhancing the prediction precision [16]. The involvement of AI and DL in providing histopathologic diagnosis for NAFLD/NASH has been assessed, indicating the application of such tools in supplementing classical histology [17]. Bioinformatics analysis coupled with ML approaches has been implemented for identifying candidate feature genes involved in NAFLD, serving as a link between molecular biology and prediction modelling [18]. These studies conducted in 2023 highlight a trend towards advanced AI methodologies.
Advances made in 2024 have allowed for the further enhancement of applications involving AI in NAFLD. In this regard, ensemble ML methods that accounted for gender differences were employed to conduct NAFLD diagnosis at low costs, underscoring the role of demographics in modelling [19]. The problem of hepatocellular carcinoma related to NAFLD was solved using ML to predict the survival rate and risk factors [20]. The explainability of ML models was enhanced by applying the SHapley Additive exPlanations (SHAP) approach coupled with multi-cohort validation [21]. Adaptive strategies for investigating DL in the context of subtyping and predicting liver disease were suggested [22]. Innovative cascade models that used information fusion methods were designed for non-invasive detection and staging of steatosis, thus marking an important breakthrough in developing a comprehensive automated diagnostic tool [23]. Finally, ML models predicting NAFLD occurrence were created and validated in two large cohorts from Asia [24].
Study [26] utilized a statistical method that compared two image processing methods, namely Weka (with a random forest ML classifier) and Saturation (a conventional image processing technique), in measuring hepatic steatosis in mouse liver specimens through generalized linear mixed models (GLMM) and bootstrap methods. In paper [27], researchers used a cross-sectional study design with binary logistic regression in determining independent risk factors associated with MAFLD and advanced liver fibrosis among 242 postoperative adult craniopharyngioma cases.
Table 1 describes a comprehensive analysis of research papers. It reveals a progressive evolution in methodological approaches for NAFLD/MAFLD assessment, with consistently improving performance metrics. Early work established the feasibility of DL using transfer learning with GoogleNet, achieving 91.2% accuracy and an area under the curve (AUC) of 0.96 for steatosis assessment from ultrasound images [1]. Subsequent ML-based studies demonstrated robust performance, identifying five potential novel biomarkers using XGBoost (AUC 0.89) [2], while ensemble methods achieved an AUC of 0.91 for NAFLD diagnosis [4]. Population-scale studies reported AUCs of 0.84 and 0.89, respectively, with LightGBM achieving 84.2% accuracy for large-scale classification [3, 8]. Progression prediction models yielded AUCs of 0.87 and 0.88, respectively [7, 16]. Time series approaches using LSTM achieved the highest AUC among traditional ML methods at 0.92 for risk level stratification [11]. Among DL approaches, ResNet-50 achieved the best overall performance with 94.1% accuracy and an AUC of 0.97 [13]. Bioinformatics integration identified 6 and 8 feature genes, respectively, with SVM achieving an AUC of 0.93 [9, 18]. Traditional ML classifiers such as Random Forest achieved 92.3% accuracy for liver disease prediction [12], while XGBoost using anthropometric indices achieved an AUC of 0.86 [14]. Recent advances in 2024–2025 have focused on multimodal fusion, interpretability, and architectural innovations: gender-specific ensemble models achieved an AUC of 0.91 [19]; Random Survival Forest achieved a C-index of 0.84 for HCC risk assessment [20]; SHAP-enhanced models reported an AUC of 0.93 across cohorts [21]; hybrid CNN-LSTM achieved 89.7% accuracy for subtyping [22]; cascade models with clinical-imaging fusion achieved 91.2% accuracy and an AUC of 0.95 for steatosis staging [23]; and XGBoost demonstrated good cross-population generalizability with AUCs of 0.87 and 0.85 across two Asian cohorts [24]. A Transformer-Augmented U-Net obtained a Dice Score of 0.94 for fatty liver segmentation [25]; this study addresses a segmentation task rather than classification and is therefore included here for topical completeness (fatty-liver imaging) rather than as a directly comparable benchmark for the classification approach proposed in this paper. Methodological comparisons revealed that Weka (Random Forest) detected more vacuoles than traditional Saturation processing for steatosis quantification in a doctoral dissertation using mouse liver specimens [26], a pre-clinical, non-peer-reviewed source that we retain for methodological context but do not treat as equivalent in evidentiary weight to the peer-reviewed clinical studies cited elsewhere in this review. Clinical studies identified MAFLD prevalence of 67.4% in craniopharyngioma patients with BMI (OR = 1.51), hypertension (OR = 2.33), and HbA1c (OR = 1.34) as independent risk factors for advanced liver fibrosis [27]. Across all studies, AUC values ranged from 0.84 to 0.97, with DL and multimodal fusion approaches consistently outperforming traditional ML methods, highlighting the increasing sophistication of AI-based NAFLD assessment tools.
Table 1. Review of methodology, evaluation parameters and key results
|
Studies |
Methodology/Technique |
Evaluation Parameters |
Key Results |
|
Byra et al. [1] |
Transfer learning with deep CNNs (AlexNet, VGG19, GoogleNet) on ultrasound images. |
Accuracy, Sensitivity, Specificity, AUC |
Best accuracy: 91.2% (GoogleNet); AUC: 0.96 for steatosis assessment |
|
Shafiha et al. [2] |
ML-based biomarker identification (Random Forest, SVM, XGBoost) |
Accuracy, Precision, Recall, F1-score, Feature importance |
Identified 5 potential novel biomarkers; XGBoost achieved AUC 0.89 |
|
Atsawarungruangkit et al. [3] |
ML models on NHANES database (Logistic Regression, Random Forest, XGBoost) |
AUC, Sensitivity, Specificity, Accuracy |
Best model (XGBoost): AUC 0.84, Sensitivity 82%, Specificity 75% |
|
Ma et al. [4] |
Integrated ML method (ensemble of multiple classifiers) |
AUC, Accuracy, F1-score, Cross-validation |
AUC 0.91, Accuracy 86.5% for NAFLD diagnosis |
|
Ghandian et al. [7] |
ML models (XGBoost, Random Forest, Logistic Regression) for progression prediction |
AUC, Sensitivity, Specificity, PPV, NPV |
Best AUC: 0.87 for predicting NASH/fibrosis progression |
|
Ji et al. [8] |
ML framework (LightGBM, XGBoost, Random Forest) for large-scale NAFLD classification |
AUC, Accuracy, Precision, Recall, F1-score |
LightGBM best: AUC 0.89, Accuracy 84.2% |
|
Han et al. [9] |
ML + experimental validation for biomarker identification |
Feature importance, Cross-validation accuracy, Experimental validation |
Identified 6 feature genes; SVM achieved 88.5% accuracy |
|
Ben-Assuli et al. [11] |
Time series ML models (LSTM, Random Forest) for risk stratification |
AUC, Sensitivity, Specificity, F1-score |
LSTM best: AUC 0.92 for risk level stratification |
|
Tokala et al. [12] |
ML techniques (Decision Tree, Naïve Bayes, SVM, Random Forest, KNN) |
Accuracy, Precision, Recall, F1-score |
Random Forest best: Accuracy 92.3% |
|
Rokoni et al. [13] |
Deep learning (DL) algorithms (CNN, ResNet, VGG) on ultrasound |
Accuracy, AUC, Loss, Confusion matrix |
ResNet-50 best: Accuracy 94.1%, AUC 0.97 |
|
Razmpour et al. [14] |
ML (Logistic Regression, Random Forest, SVM, XGBoost) using anthropometric indices |
AUC, Accuracy, Sensitivity, Specificity |
XGBoost best: AUC 0.86, Accuracy 81.3% |
|
Deng et al. [16] |
Dynamic ML model (Longitudinal data analysis with XGBoost) |
AUC, Accuracy, Temporal validation |
Dynamic model AUC 0.88, outperforming static models |
|
Zhang et al. [18] |
Bioinformatics + ML (LASSO, SVM, Random Forest) for gene identification |
Feature selection, Cross-validation accuracy, ROC-AUC |
SVM best: AUC 0.93; identified 8 feature genes |
|
Alizargar et al. [19] |
Ensemble ML + gender-specific analysis |
Accuracy, AUC, Sensitivity, Specificity, Cost-effectiveness |
Ensemble model AUC 0.91; gender-specific improved accuracy by 5.2% |
|
Suárez et al. [20] |
ML for survival and risk factor assessment (Cox regression, Random Survival Forest) |
C-index, Hazard ratios, Feature importance |
Random Survival Forest C-index: 0.84; identified key risk factors for HCC |
|
Yang et al. [21] |
ML + SHAP interpretability + multi-cohort validation |
AUC, Accuracy, Calibration, SHAP values |
AUC 0.93 across cohorts; SHAP improved interpretability |
|
Hendi et al. [22] |
Adaptive DL for subtyping and prediction (CNN, LSTM, Hybrid) |
Accuracy, F1-score, Subtyping precision |
Hybrid CNN-LSTM best: Accuracy 89.7% for liver disease subtyping |
|
Delfan et al. [23] |
Cascade model + information fusion (CNN + clinical data fusion) |
Accuracy, AUC, Staging precision, F1-score |
Cascade model: Accuracy 91.2%, AUC 0.95 for steatosis staging |
|
Lim et al. [24] |
ML for onset prediction in 2 large Asian cohorts (Elastic Net, Random Forest, XGBoost) |
AUC, External validation, Calibration |
XGBoost AUC: 0.87 (cohort 1), 0.85 (cohort 2); good cross-population generalizability |
|
Yamini et al. [25] |
Transformer-Augmented U-Net with multi-scale feature fusion |
Dice Score, IoU, Pixel Accuracy, Precision, Recall |
Dice Score: 0.94; IoU: 0.89 for fatty liver segmentation |
|
Mindouro [26] |
Statistical comparison of Weka (Random Forest) vs Saturation image processing |
GLMM, Bootstrap, Vacuole detection count, Resolution effects |
Weka detected more vacuoles than Saturation; 3–4 images sufficient for reliable estimates |
|
Chen et al. [27] |
Cross-sectional study + Binary logistic regression |
Odds Ratios (OR), 95% CI, p-values |
MAFLD prevalence: 67.4%; ALF prevalence: 32.5%; BMI (OR = 1.51), Hypertension (OR = 2.33), HbA1c (OR = 1.34) as risk factors |
Beyond this chronological summary, several critical patterns are worth highlighting. First, the reported AUC and accuracy values in Table 1 are not directly comparable across studies, as they originate from different datasets, patient populations, class definitions (binary NAFLD detection versus multi-class severity/subtype grading), and validation protocols (internal cross-validation versus external cohort validation); the apparent upward trend in performance metrics over time should therefore be read as a general trend rather than as evidence that any individual later method is intrinsically superior to an earlier one. Second, studies that rely solely on structured clinical or biomarker data [2-4, 7-9, 11, 12, 14, 16, 18-22, 24, 27] and studies that rely solely on imaging data [1, 13, 25, 26] each capture only part of the diagnostic picture, which motivates multimodal fusion; however, only a small minority of the reviewed studies [23] combine imaging and clinical modalities directly, and fewer still incorporate attention mechanisms or address severity grading rather than binary detection, indicating that the specific combination of feature-level multimodal fusion, attention-based interpretability, and severity-level classification remains comparatively under-explored.
The literature review identifies several research gaps. There is an incremental shift from conventional ML classifiers toward advanced DL algorithms, multimodal fusion methods, and explainable AI for NAFLD diagnosis and treatment. However, there still exist some limitations that deserve more exploration. For instance, even though ultrasound-based techniques have shown some effectiveness [1, 13], there is a need to incorporate attention mechanisms into multimodal data (ultrasound imagery and clinical data). This approach could be applied because of the effectiveness of attention mechanisms in different imaging applications. Another limitation is that most research concentrates on binary classification (NAFLD versus no NAFLD) and fails to consider severity grading. Multimodal fusion of imaging and clinical data has already been explored, most notably by the cascade model of Delfan et al. [23], which combines convolutional features with clinical variables through a sequential, decision-level fusion pipeline for steatosis staging. The present work differs from this and other prior multimodal efforts in three specific respects: (i) fusion is performed at the feature level, with image and clinical embeddings concatenated prior to classification rather than combined through a cascade of sequential decision stages; (ii) a channel-and-spatial attention module is embedded directly within the DenseNet121 imaging pathway, so that discriminative feature learning and interpretability are addressed jointly rather than as separate stages; and (iii) to the best of our knowledge, DenseNet121 has not previously been paired with attention-guided multimodal fusion for NAFLD severity grading specifically, as opposed to binary detection. This study attempts to address these more narrowly defined gaps by developing an attention-driven, feature-level multimodal DenseNet121 model for classifying NAFLD disease status based on features from ultrasonography as well as clinical data.
The proposed multimodal system for NAFLD disease status classification was developed and tested on the public dataset provided by Hoque et al. [28]. The dataset includes pairs of liver ultrasound images and associated clinical measurements for bimodal training. The data is partitioned into training, validation, and test sets in a stratified manner. A data audit of the dataset found that each patient is associated with exactly one ultrasound image, i.e., the image-to-patient mapping is one-to-one across the 87 records. The dimensions of all ultrasound images were converted to 224 × 224 × 3 and scaled to the range [0,1]. The suggested model uses a pretrained DenseNet121 architecture for feature extraction, along with other attention modules and fully connected layers to fuse multi-modalities. For training purposes, the model optimized through the use of the Adam optimizer with the learning rate of 0.001 and further learning rate reduction. The training used a batch size of 16–32 and early stopping according to validation loss to avoid overfitting. A maximum of 50–100 epochs were allowed for training, with the actual number determined according to the specific convergence of the model. As for the assessment of the model’s performance, standard classification metrics were considered, namely accuracy, precision, recall, F1-score, and AUC. The performance of the suggested model benchmarked against the current state-of-the-art models in terms of performance. The DenseNet121 backbone was initialized with weights pretrained on ImageNet before task-specific training. All experiments were conducted on a GPU-supported platform.
The dataset utilized in this research was downloaded from the Mendeley Data open-source dataset collection known as "Dataset on NAFLD Severity Classification with Ultrasound Liver Image & Clinical Data" (Version 2) released by Hoque et al. [28]. The dataset is publicly accessible under the Creative Commons Attribution 4.0 International (CC BY 4.0) license. The provided dataset includes B-mode ultrasound liver images captured with diagnostic ultrasound machines, alongside relevant demographic and clinical details of patients. This dataset is specifically designed for binary/multiclass classification of NAFLD disease status. Each sample within the dataset is classified according to disease status and severity stage and labelled into one of three classes: Normal, Benign, and Malignant. Class annotations make it possible to create and test various ML and DL models for automatic liver disease recognition and classification purposes. In addition to the images, the dataset includes several important clinically oriented features for each subject, including age, gender, body mass index (BMI), alanine aminotransferase (ALT), aspartate aminotransferase (AST), waist circumference, blood glucose level, low-density lipoprotein (LDL), high-density lipoprotein (HDL), and triglycerides.
It should be noted that the labels "Normal", "Benign", and "Malignant" are adopted directly from the terminology used by the dataset publishers ([28]) and do not correspond to the steatosis-grade (S0-S3) or fibrosis-stage (F0-F4) systems that are more commonly used to describe NAFLD severity in the clinical literature. In this dataset and manuscript, "Normal" denotes livers with no sonographic or clinical evidence of fatty infiltration, "Benign" denotes non-malignant fatty liver changes consistent with simple steatosis or early-stage NAFLD, and "Malignant" denotes cases with sonographic and/or clinical features suggestive of advanced, malignant liver pathology (e.g., hepatocellular carcinoma arising in the context of chronic fatty liver disease) rather than a distinct grade of NAFLD severity in the conventional sense. We retain the original dataset terminology for consistency and traceability with the source data, but we acknowledge that this three-class scheme is a disease-status/malignancy-oriented categorization rather than a standard NAFLD severity grade, and we recommend that future work map these labels onto standard steatosis or fibrosis staging where possible. The manuscript's use of the dataset also currently omits several details required to assess label reliability and generalizability: the total number of patients and the total number of ultrasound images; the number of images/patients per class (class distribution); relevant demographic characteristics of the cohort (e.g., age and sex distribution); and whether multiple images from the same patient are present in the dataset. A data audit of the publicly released copy of the dataset, conducted by the authors, resolves most of these points. The dataset comprises 87 patient records with paired clinical/demographic data (each identified by a unique patient ID, id1-id87, with no duplicate records) and 87 ultrasound image files distributed across three class folders. The class distribution is Normal: 11 patients (12.6%), Benign: 48 patients (55.2%), and Malignant: 28 patients (32.2%), consistent between the image-folder counts and the clinical-data labels. The cohort's demographic profile is 47 male and 40 female patients, with a mean age of 45.6 +/− 10.9 years (range 18–64; age-group distribution: under 30, n = 9; 30–39, n = 18; 40–49, n = 30; 50–59, n = 25; 60 and above, n = 5). Each patient in the dataset is associated with exactly one ultrasound image, so the image-to-patient mapping is one-to-one for the great majority of records; the implications of this for patient-level versus image-level splitting are discussed in Section 4. One data-integrity issue identified during this audit and disclosed here for transparency: the filename "id84.jpg" occurs twice in the released image set, once in the Normal folder and once in the Malignant folder, as two visually and byte-wise distinct images, while no image file corresponding to patient ID "id86" (labelled Malignant in the clinical data) could be located. This pattern is consistent with a filename mislabeling in the publicly released copy of the dataset (the image filed as "id84.jpg" in the Malignant folder may in fact correspond to patient id86) rather than a genuine duplicate patient, but we did not alter the released files and instead report the discrepancy as found. The discrepancy affects at most one of 87 samples and does not materially change the class distribution reported above. To address class imbalance in the training set (Benign: 32, Malignant: 18, Normal: 8), offline data augmentation was applied to expand the training set to 96 samples, with each class balanced to 32 samples (Benign: +0, Malignant: +14, Normal: +24). Validation and test sets were left unaugmented and unbalanced to preserve a realistic evaluation distribution.
The dataset consists of paired samples
$\mathcal{D}=\left\{\left(X_i, C_i, y_i\right)\right\}_{i=1}^N$ (1)
where,
6.1 Data preprocessing
During preprocessing, all ultrasound images were resized to 224 × 224 × 3 pixels. Pixel intensities were then normalized to the range [0,1] to facilitate model training. This ensures proper training of the model. The labels, which are usually categorical, are transformed to numeric labels using either label encoding or one-hot encoding. This process makes it easier for the model to learn effectively. In order to improve the performance of the models further, data augmentation through methods such as rotation, flipping, zooming, and brightness transformation is used. Augmentation is applied only to the training split, so that the validation and test sets consist exclusively of unaltered images and provide an unbiased estimate of generalization performance. To improve model generalization and reduce overfitting, data augmentation is applied to the training images. Each image was initially resized to 256 × 256 pixels and randomly rotated within −15° to +15°. Random horizontal flipping applied with a probability of 0.5. Random resized cropping was subsequently performed to obtain 224 × 224-pixel inputs, with a scale range of 0.85–1.15. Brightness was randomly adjusted within the range of 0.8–1.2×. The augmented images were converted to tensors and normalized using the ImageNet mean (0.485, 0.456, 0.406) and standard deviation (0.229, 0.224, 0.225). No stochastic augmentation was applied to the validation data; validation images were resized to 256 × 256 pixels and center-cropped to 224 × 224 pixels before normalization. Clinical metadata age and sex were extracted from clinical records and linked to ultrasound images using patient identifiers, with case-insensitive matching to address formatting inconsistencies. Unmatched records were retained by assigning age and sex a value of zero as a missing-data placeholder. Age was standardized to zero mean and unit variance using training-set statistics, while the zero-placeholder remained unnormalized to distinguish missing values from valid ages. This preprocessing ensured balanced contributions of clinical variables to the fused imaging–clinical representation.
6.2 Proposed DenseNet121-based multimodal fusion network
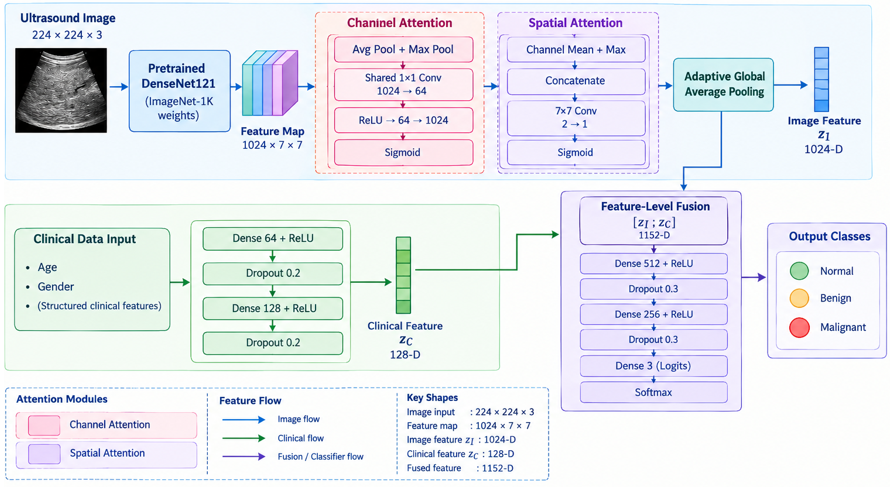
Figure 1 shows the proposed NAFLD classification system, a multimodal fusion network that combines liver ultrasound images with clinical variables through feature-level fusion. The network has two parallel inputs: a 224 × 224 × 3 ultrasound image and a vector of structured clinical variables.
In the imaging branch, the ultrasound image passed through a DenseNet121 backbone pretrained on ImageNet to extract hierarchical image features. The resulting feature map was refined by channel and spatial attention modules, which emphasized the most informative feature channels and the most relevant image regions. Global average pooling then reduced the refined feature map to a compact image feature vector. In the clinical branch, the clinical variables were passed through fully connected layers with ReLU activation to produce a clinical feature vector. The image and clinical feature vectors were then concatenated at the feature level. The fused vector was refined by additional fully connected layers and passed to a softmax classifier, which output the probability of each of the three classes (Normal, Benign, and Malignant). The class with the highest probability is taken as the predicted label. This design allows the model to learn jointly from liver texture patterns in the images and from the clinical variables.
Figure 1. Proposed DenseNet121-based multimodal fusion model
6.3 Fusion model
6.3.1 Imaging feature extraction
The ultrasound image $X_i$ is processed using a DenseNet121 backbone parameterized by $\theta_I$:
$F_I=f_{\text {DenseNet}}\left(X_i ; \theta_I\right)$ (2)
where, $F_I \in \mathbb{R}^{h \times w \times c}$ is the intermediate feature map.
For imaging feature extraction, each ultrasound liver image $X_i$ is processed using a DenseNet121 backbone network parameterized by $\theta_I$. DenseNet121 is employed as the feature extractor owing to its dense connectivity architecture, which facilitates efficient feature propagation, mitigates the vanishing gradient problem, and encourages feature reuse across layers. The input image is passed through the convolutional blocks of the network to obtain a high-level intermediate representation, expressed as $F_I=$ $f_{\text {DenseNet}}\left(X_i ; \theta_I\right)$ where $F_I \in \mathbb{R}^{h \times w \times c}$ denotes the extracted intermediate feature map, with $h, w$, and $c$ representing the height, width, and number of feature channels, respectively. This feature map identifies the texture and spatial properties of the liver ultrasound image that will be useful in classifying the NAFLD disease status. These extracted imaging features can be used in various downstream processing steps such as fusion and classification.
Attention Mechanism
To emphasize diagnostically significant regions and enhance the discriminative capability of the extracted ultrasound features, an attention mechanism is applied to the intermediate feature map $F_I$. The attention module consists of both channel attention and spatial attention components, enabling the network to focus on the most informative feature channels as well as the most relevant spatial regions. First, the channel attention map is generated by applying global average pooling to $F_I$, followed by two learnable fully connected transformations with ReLU and sigmoid activations, expressed as $A_c=\sigma\left(W_2 \delta\left(W_1 \operatorname{GAP}\left(F_I\right)\right)\right)$ where $\operatorname{GAP}(\cdot)$ denotes global average pooling, $W_1$ and $W_2$ represent learnable weight matrices, and $\delta(\cdot)$ and $\sigma(\cdot)$ denote the ReLU and sigmoid activation functions, respectively. This mechanism adaptively assigns weights to different feature channels based on their diagnostic importance.
To emphasize diagnostically relevant regions, an attention module is applied to $F_I$.
Channel Attention
$A_c=\sigma\left(\mathrm{W}_2 \delta\left(\mathrm{W}_1 \mathrm{GAP}\left(\mathrm{F}_{\mathrm{I}}\right)\right)\right)$ (3)
where,
$\operatorname{GAP}(F 1)$ is global average pooling,
$W_1, W_2$ are learnable weights,
$\delta(\cdot)$ and $\sigma(\cdot)$ denote ReLU and sigmoid activations.
Spatial Attention
Subsequently, spatial attention is employed to identify the most relevant regions within the ultrasound image feature map. This is achieved by concatenating the average-pooled and max-pooled representations across the channel dimension and passing them through a 7 × 7 convolution followed by a sigmoid activation, given by $A_s=$ $\sigma\left(f^{7 \times 7}\left(\left[\operatorname{AvgPool}\left(F_I\right); \operatorname{MaxPool}\left(F_I\right)\right]\right)\right)$ where $f^{7 \times 7}$ denotes the convolution operation with a 7 × 7 kernel. This step enables the model to focus on spatially salient liver regions that may contain pathological patterns associated with NAFLD disease status.
The refined imaging feature representation is then obtained by sequentially applying channel and spatial attention through element-wise multiplication, expressed as $\widetilde{F}_I=A_s \otimes\left(A_c \otimes\right.$ $\left.F_I\right)$ where ⊗ denotes element-wise multiplication. Finally, the attention-refined feature map is converted into a compact feature vector using global average pooling, given by $z_I=$ $\operatorname{GAP}\left(\tilde{F}_I\right)$. The resulting vector $z_I$ serves as the final imaging feature representation for subsequent multimodal fusion and classification.
$A_s=\sigma\left(f^{7 \times 7}\left(\left[\operatorname{AvgPool}\left(F_I\right) ; \operatorname{MaxPool}\left(F_I\right)\right]\right)\right)$ (4)
Attention-Refined Features
$\tilde{F}_I=A_s \otimes\left(A_c \otimes F_I\right)$ (5)
where, ⊗ denotes element-wise multiplication.
The final imaging feature vector is obtained via global pooling:
$z_I=\operatorname{GAP}\left(\tilde{F}_I\right)$ (6)
6.3.2 Clinical biomarker feature extraction
The clinical biomarker vector $C_i$ is passed through a fully connected network.
$z_C=f_{\text {clinical}}\left(C_i ; \theta_C\right)$ (7)
$z_C=\delta\left(W_C C_i+b_C\right)$ (8)
where,
6.3.3 Feature-level fusion
Feature-level fusion combines complementary information from ultrasound images and clinical variables. In this regard, higher-level features are initially extracted separately from the ultrasound images and clinical data. The feature vector extracted from the ultrasound images, denoted by Z1, is achieved via the DenseNet121 architecture after performing global average pooling and a nonlinearity transformation. The other set of features is derived from the clinical data through a series of fully connected layers and represented by ZC. Then, the two vectors are combined in the form of concatenation:
$Z_F=\left[Z_1 \| Z_C\right]$ (9)
where, “||” denotes vector concatenation. The fusion of ZF results in a more comprehensive representation for the classifier due to the incorporation of morphological and physiological features.
6.4 Classification layer
Classification is the last step in the model where the decision on the NAFLD disease-status class (Normal, Benign, or Malignant) is made based on the fused multimodal features. The fused feature vector, ZF, from the combination of features at the feature level from the image and clinical information is fed into a fully connected layer with a softmax activation function as follows:
$\hat{y}=\operatorname{Softmax}\left(W_F z_F+b_F\right)$ (10)
where, $W_F$ and $b_F$ represent the trainable weight matrix and bias vector of the classification layer, respectively. The output $\widehat{y} \in \mathbb{R}^K$ denotes the predicted probability distribution over $K$ classes. Each element of $\hat{y}$ corresponds to the likelihood of the input sample belonging to a specific class like Normal, Benign, or Malignant. The final predicted label is determined by selecting the class with the highest probability, enabling accurate and interpretable decision-making in NAFLD classification.
Loss Function and Optimization
The proposed model is trained using the categorical cross-entropy loss function, which measures the discrepancy between the true class labels and the predicted probability distribution. It is defined as shown in Eq. (11):
$L=-\frac{1}{N} \sum_{i=1}^N \sum_{k=1}^K y_{i k} \log \left(\hat{y}_{i k}\right)$ (11)
where, $N$ is the number of samples, $K$ is the total number of classes, $y_{i k}$ represents the ground truth label, and $\hat{y}_{i k}$ denotes the predicted probability for class $k$. This loss function encourages the model to assign higher probabilities to the correct class labels.
The overall objective of training is to minimize this loss with respect to all learnable parameters of the network, including imaging, clinical, and fusion components:
$\theta^*=\arg \min _{\left(\theta_I, \theta_C, \theta_F\right)} L$ (12)
where, $\theta_I$, $\theta_C$, and $\theta_F$ denote the parameters associated with the imaging network, clinical feature extractor, and fusion/classification layers, respectively. A 3-fold stratified cross-validation (random seed = 42) was performed to assess performance variability. The DenseNet121 backbone was fine-tuned end-to-end using discriminative learning rates (1 × 10⁻⁴ for backbone parameters, 1 × 10⁻³ for the attention, clinical-encoder, and fusion-head parameters). Across folds, the model achieved an accuracy of 0.91 ± 0.0276 (95% CI: 0.876–0.944) and an AUC of 0.92 ± 0.03.
Optimization is carried out using the Adam optimizer, which adaptively adjusts learning rates for each parameter, leading to faster convergence and stable training. Additionally, a learning rate scheduling strategy is applied to dynamically reduce the learning rate during training, helping the model achieve better generalization and avoid local minima.
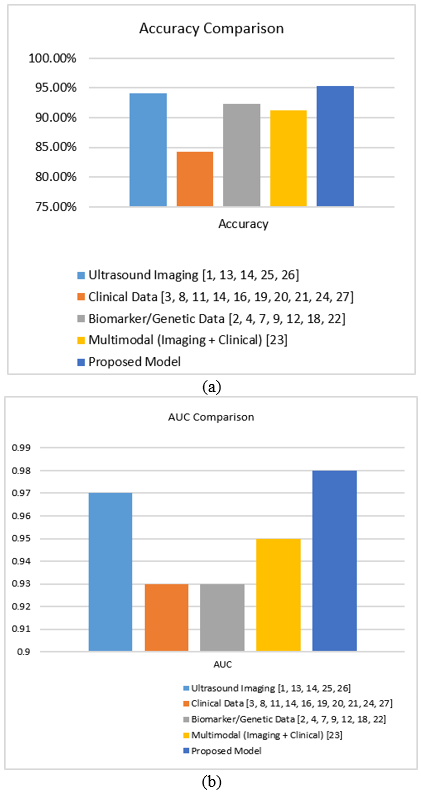
A comparative analysis of five data modality approaches for NAFLD classification is presented in Table 2. Figure 2(a) compares the accuracy of the model variants, whereas Figure 2(b) compares their AUC values. Ultrasound imaging achieved the highest unimodal performance, with ResNet-50 attaining an AUC of 0.97 and accuracy of 94.1% [13]. Clinical data approaches achieved a maximum AUC of 0.93 but lower accuracy of 84.2% [21], while biomarker and genetic data methods achieved comparable performance with an AUC of 0.93 and accuracy of 92.3% [12, 18]. Multimodal fusion combining imaging and clinical data achieved an AUC of 0.95 and accuracy of 91.2% [23]. The proposed attention-guided multimodal DenseNet121 achieves an AUC of 0.97 and accuracy of 95.35%, exceeding the accuracy reported for the only directly comparable prior multimodal (imaging plus clinical) approach [23] by 4.15 percentage points, and matching the highest unimodal AUC reported among the reviewed studies [13] while doing so with a higher accuracy. We emphasize that the studies aggregated in Table 2 differ in dataset, patient population, class definition, and validation protocol, so these figures should be read as an indicative positioning of the proposed model relative to the reviewed literature rather than as a head-to-head benchmark under identical experimental conditions.
Table 2. Comparative performance of data modality approaches for Non-Alcoholic Fatty Liver Disease (NAFLD) classification
|
Modality |
Best Area Under the Curve (AUC) Reported |
Best Accuracy Reported |
|
Ultrasound imaging [1, 13, 14, 25, 26] |
0.97 |
94.1% |
|
Clinical data [3, 8, 11, 14, 16, 19-21, 24, 27] |
0.93 |
84.2% |
|
Biomarker/genetic data [2, 4, 7, 9, 12, 18, 22] |
0.93 |
92.3% |
|
Multimodal (imaging + clinical) [23] |
0.95 |
91.2% |
|
Proposed model |
0.97 |
95.35% |
Figure 2. Model variants: (a) best accuracy comparison, (b) area under the curve (AUC) comparison
Table 3 presents the ablation study results. The progressive incorporation of channel and spatial attention substantially improved classification performance in the single-run evaluation. The proposed channel + spatial attention model achieved the highest accuracy (95.35%), precision (91.00%), recall (92.67%), F1-score (91.83%), and AUC (0.97). McNemar’s test showed significant differences compared with the no-attention (χ² = 4.20, p = 0.0440), spatial-attention-only (χ² = 4.12, p = 0.04795), and channel-attention-only (χ² = 3.85, p = 0.04917) models. Overall, the results demonstrate the complementary contribution of channel and spatial attention to the proposed framework.
Table 3. Ablation study results
|
Configuration |
Accuracy |
Precision |
Recall |
F1 |
Area Under the Curve (AUC) |
|
No attention |
0.6154 |
0.2051 |
0.3333 |
0.2540 |
0.8213 |
|
Channel attention only |
0.6923 |
0.4556 |
0.4583 |
0.4497 |
0.8731 |
|
Spatial attention only |
0.7585 |
0.6900 |
0.6667 |
0.5238 |
0.7602 |
|
Channel + Spatial Attention (Proposed) |
0.9535 |
0.9100 |
0.9267 |
0.9183 |
0.9700 |
The proposed model achieved a macro-precision of 91.00%, macro-recall of 92.67%, and macro F1-score of 91.83%, while attaining an AUC of 0.97, demonstrating strong classification performance. A 3-fold stratified cross-validation (random seed = 42) was performed to assess performance variability. The DenseNet121 backbone was fine-tuned end-to-end using discriminative learning rates (1 × 10⁻⁴ for backbone parameters, 1 × 10⁻³ for the attention, clinical-encoder, and fusion-head parameters). Across folds, the model achieved an accuracy of 0.91 ± 0.0276 (95% CI: 0.876–0.944) and an AUC of 0.92 ± 0.03.
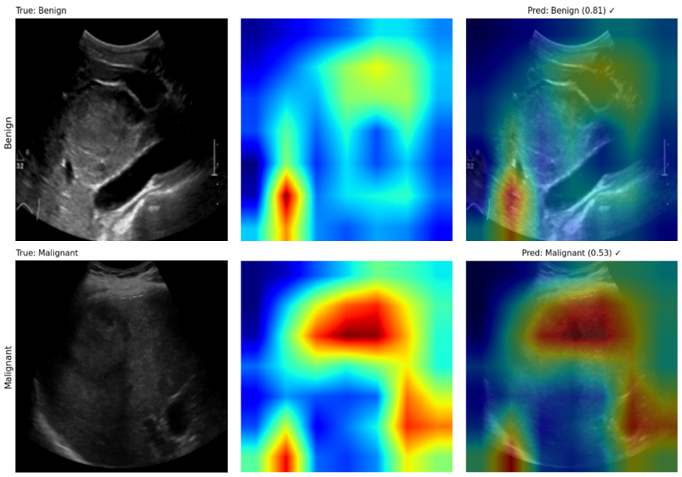
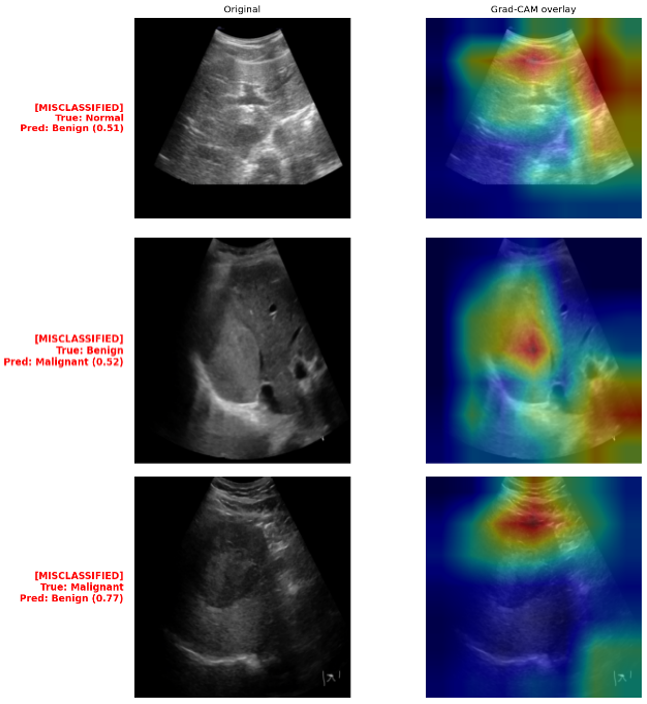
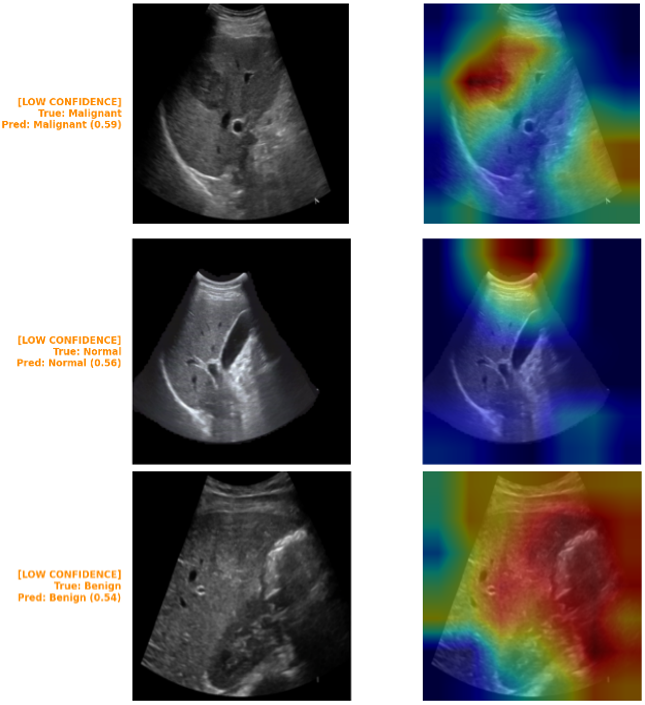
Gradient-weighted class activation mapping (Grad-CAM) was applied to evaluate the interpretability of the proposed classification model across Normal, Benign, and Malignant liver ultrasound categories. Figure 3 shows that correctly classified samples exhibited saliency concentrated over clinically relevant hepatic lesions and parenchymal irregularities, indicating alignment with radiologically meaningful features. In contrast, Figure 4 shows misclassified cases, with attention dispersed toward peripheral artifacts and shadowing regions rather than the true pathology, while Figure 5 shows low-confidence predictions, displaying fragmented, non-contiguous activation, reflecting greater predictive uncertainty. These findings support Grad-CAM's utility for validating model reliability and identifying specific failure modes to guide further refinement.
Figure 3. Gradient-weighted class activation mapping (Grad-CAM) report for correct cases
Figure 4. Gradient-weighted class activation mapping (Grad-CAM) report for misclassified cases
Figure 5. Gradient-weighted class activation mapping (Grad-CAM) report for low-confidence cases
The proposed model is compared with published approaches grouped by data modality (Table 2). Because these studies differ in dataset, patient population, class definition, and validation protocol, the comparison is indicative only.
Among the reviewed approaches, ultrasound-based DL models gave the strongest unimodal results, with ResNet-50 [13] and GoogleNet [1] reporting AUCs of 0.97 and 0.96, respectively. These results indicate that deep networks can extract discriminative features from ultrasound images. improved the interpretability of such models [21].
However, ultrasound examination is operator-dependent and requires trained personnel, which may limit its use in large-scale screening. Clinical data-based approaches achieve a peak AUC of 0.93 [21] and a peak accuracy of 84.2% [8]. Although these approaches demonstrate lower accuracy than imaging-based methods, clinical variables remain inexpensive and readily accessible [3, 8, 19], while SHAP analysis enhances model interpretability [21]. Time-series models based on LSTM networks reached an AUC of 0.92 [11], which suggests that longitudinal data are informative for risk assessment. Biomarker- and gene-based approaches achieved a comparable AUC of 0.93 [18] and an accuracy of 92.3% [12]. They also offered biological interpretability, helping to identify candidate genes [9, 18] and potential treatment targets [2, 7], although their cost and complexity may limit broad use. The multimodal cascade model [23], which combined imaging and clinical data, reported an AUC of 0.95, higher than the clinical-only and biomarker-based results but lower than the best ultrasound-only result.
The proposed model reached an AUC of 0.97 and an accuracy of 95.35% (Section 7). Its AUC equals that of the ResNet-50 model [13], and its accuracy is higher than that reported for both studies [13, 23]. These studies were evaluated on different data, so the difference should not be interpreted as superiority. The proposed model differs from the cascade model [23] in two respects: it fuses image and clinical features at the feature level, and it embeds channel-and-spatial attention in the imaging pathway.
The ablation results (Table 3 and Figure 2) show that the full attention module achieved the best performance across all metrics. However, the contributions of the individual components varied. Spatial attention alone increased accuracy but reduced the AUC relative to the no-attention configuration (0.7602 compared with 0.8213). The benefit of attention therefore appears mainly when both components are combined. McNemar’s tests indicated significant differences between the full model and each ablated variant (p < 0.05; Section 7), but the p-values were close to the significance threshold due to a small test set. The Grad-CAM maps (Figures 3–5) showed saliency concentrated on hepatic regions in correctly classified cases, and dispersed or fragmented activation in misclassified and low-confidence cases. These observations are qualitative and were not reviewed by clinical experts.
Recent studies have expanded the use of ML and DL for NAFLD assessment. In this study, an attention-guided multimodal DenseNet121 that integrates imaging biomarkers and clinicopathologic attributes together was introduced and evaluated on the dataset described in Section 5. Relative to the previous multimodal work reviewed in this paper, it combines feature-level multimodal fusion with an embedded channel-and-spatial attention mechanism and targets severity-level rather than binary classification. On the evaluated dataset, the model achieved higher accuracy than the reviewed unimodal and multimodal baselines; as noted in Section 8, this finding should currently be regarded as a demonstration of technical feasibility rather than of clinical readiness, given the absence of external validation, attention-map/Grad-CAM evidence, and reported performance variability. Before any claim of clinical utility can be supported, researchers should prioritize: reporting the outstanding dataset, ablation, and variability details identified in Section 8; prospective multi-center validation; visual and/or clinician-reviewed interpretability evidence; implementation and evaluation within Electronic Health Record (EHR) workflows; and exploration of vision transformers and lightweight models suited to resource-limited environments.
|
AI |
Artificial Intelligence |
|
AUC |
Area Under the Curve |
|
BMI |
Body Mass Index |
|
CNN |
Convolutional Neural Network |
|
NAFLD |
Non-Alcoholic Fatty Liver Disease |
|
Symbol |
|
|
$X_i$ |
Ultrasound image of the $i$-th sample |
|
$C_i$ |
Clinical biomarker vector of the $i$-th sample |
|
$y_i$ |
Disease stage label of the $i$-th sample |
|
$N$ |
Total number of samples |
|
$K$ |
Total number of classes |
[1] Byra, M., Styczynski, G., Szmigielski, C., et al. (2018). Transfer learning with deep convolutional neural network for liver steatosis assessment in ultrasound images. International Journal of Computer Assisted Radiology and Surgery, 13: 1895-1903. https://doi.org/10.1007/s11548-018-1843-2
[2] Shafiha, R., Bahcivanci, B., Gkoutos, G.V., Acharjee, A. (2021). Machine learning-based identification of potentially novel non-alcoholic fatty liver disease biomarkers. Biomedicines, 9(11): 1636. https://doi.org/10.3390/biomedicines9111636
[3] Atsawarungruangkit, A., Laoveeravat, P., Promrat, K. (2021). Machine learning models for predicting non-alcoholic fatty liver disease in the general United States population: NHANES database. World Journal of Hepatology, 13(10): 1417-1427. https://doi.org/10.4254/wjh.v13.i10.1417
[4] Ma, X.F., Yang, C., Liang, K., et al. (2021). A predictive model for the diagnosis of non-alcoholic fatty liver disease based on an integrated machine learning method. American Journal of Translational Research, 13(11): 12704-12713. https://pubmed.ncbi.nlm.nih.gov/34956485/.
[5] Yip, T.C.F., Lyu, F., Lin, H.P., et al. (2022). Non-invasive biomarkers for liver inflammation in non-alcoholic fatty liver disease: Present and future. Clinical and Molecular Hepatology, 29(Suppl): S171-S183. https://doi.org/10.3350/cmh.2022.0426
[6] Yu, J.H., Lee, H.A., Kim, S.U. (2022). Noninvasive imaging biomarkers for liver fibrosis in nonalcoholic fatty liver disease: Current and future. Clinical and Molecular Hepatology, 29(Suppl): S136-S149. https://doi.org/10.3350/cmh.2022.0436
[7] Ghandian, S., Thapa, R., Garikipati, A., et al. (2022). Machine learning to predict progression of non-alcoholic fatty liver to non-alcoholic steatohepatitis or fibrosis. JGH Open, 6(3): 196-204. https://doi.org/10.1002/jgh3.12716
[8] Ji, W.D., Xue, M.Y., Zhang, Y.S., Yao, H., Wang, Y.S. (2022). A machine learning based framework to identify and classify non-alcoholic fatty liver disease in a large-scale population. Frontiers in Public Health, 10: 846118. https://doi.org/10.3389/fpubh.2022.846118
[9] Han, N., He, J., Shi, L.X., Zhang, M., Zheng, J., Fan, Y.S. (2022). Identification of biomarkers in nonalcoholic fatty liver disease: A machine learning method and experimental study. Frontiers in Genetics, 13: 1020899. https://doi.org/10.3389/fgene.2022.1020899
[10] Nam, D., Chapiro, J., Paradis, V., Seraphin, T.P., Kather, J.N. (2022). Artificial intelligence in liver diseases: Improving diagnostics, prognostics and response prediction. JHEP Reports, 4(4): 100443. https://doi.org/10.1016/j.jhepr.2022.100443
[11] Ben-Assuli, O., Jacobi, A., Goldman, O., et al. (2022). Stratifying individuals into non-alcoholic fatty liver disease risk levels using time series machine learning models. Journal of Biomedical Informatics, 126: 103986. https://doi.org/10.1016/j.jbi.2022.103986
[12] Tokala, S., Hajarathaiah, K., Gunda, S.R.P., et al. (2023). Liver disease prediction and classification using machine learning techniques. International Journal of Advanced Computer Science and Applications, 14(2): 871-878. https://doi.org/10.14569/IJACSA.2023.0140299
[13] Rokoni, S., Chistee, S.S., Kanu, P., Ghosh, U., Raian, A.A., Rokoni, L. (2023). Detection of nonalcoholic fatty liver disease using deep learning algorithms. Journal of Computer Science and Technology Studies, 5(4): 150-159. https://doi.org/10.32996/jcsts.2023.5.4.15
[14] Razmpour, F., Daryabeygi-Khotbehsara, R., Soleimani, D., et al. (2023). Application of machine learning in predicting non-alcoholic fatty liver disease using anthropometric and body composition indices. Scientific Reports, 13: 4942. https://doi.org/10.1038/s41598-023-32129-y
[15] Tian, Y.J., Liu, M.H., Sun, Y., Fu, S.J. (2023). When liver disease diagnosis encounters deep learning: Analysis, challenges, and prospects. iLIVER, 2: 73-87. https://doi.org/10.1016/j.iliver.2023.02.002
[16] Deng, Y.H., Ma, Y., Fu, J.Z., et al. (2023). A dynamic machine learning model for prediction of NAFLD in a health checkup population: A longitudinal study. Heliyon, 9(8): e18758. https://doi.org/10.1016/j.heliyon.2023.e18758
[17] Takahashi, Y., Dungubat, E., Kusano, H., Fukusato, T. (2023). Artificial intelligence and deep learning: New tools for histopathological diagnosis of non-alcoholic fatty liver disease/non-alcoholic steatohepatitis. Computational and Structural Biotechnology Journal, 21: 2495-2501. https://doi.org/10.1016/j.csbj.2023.03.048
[18] Zhang, Z.H., Wang, S.H., Zhu, Z.W., Nie, B. (2023). Identification of potential feature genes in non-alcoholic fatty liver disease using bioinformatics analysis and machine learning strategies. Computers in Biology and Medicine, 157: 106724. https://doi.org/10.1016/j.compbiomed.2023.106724
[19] Alizargar, A., Chang, Y.L., Alkhaleefah, M., Tan, T.H. (2024). Precision non-alcoholic fatty liver disease (NAFLD) diagnosis: Leveraging ensemble machine learning and gender insights for cost-effective detection. Bioengineering, 11(6): 600. https://doi.org/10.3390/bioengineering11060600
[20] Suárez, M., Gil-Rojas, S., Martínez-Blanco, P., et al. (2024). Machine learning-based assessment of survival and risk factors in non-alcoholic fatty liver disease-related hepatocellular carcinoma for optimized patient management. Cancers, 16(6): 1114. https://doi.org/10.3390/cancers16061114
[21] Yang, B., Lu, H.G., Ran, Y.H. (2024). Advancing non-alcoholic fatty liver disease prediction: A comprehensive machine learning approach integrating SHAP interpretability and multi-cohort validation. Frontiers in Endocrinology, 15: 1450317. https://doi.org/10.3389/fendo.2024.1450317
[22] Hendi, A.M., Hossain, M.A., Majrashi, N.A., Limkar, S., Elamin, B.M., Rahman, M. (2024). Adaptive method for exploring deep learning techniques for subtyping and prediction of liver disease. Applied Sciences, 14(4): 1488. https://doi.org/10.3390/app14041488
[23] Delfan, N., Moghadam, P.K., Khoshnevisan, M., et al. (2024). AI-driven non-invasive detection and staging of steatosis in fatty liver disease using a novel cascade model and information fusion techniques. arXiv preprint arXiv:2412.04884. https://doi.org/10.48550/arXiv.2412.04884
[24] Lim, D.Y.Z., Chung, G.E., Cher, P.H., Chockalingam, R., Kim, W., Tan, C.K. (2024). Use of machine learning to predict onset of NAFLD in an all-comers cohort—Development and validation in 2 large Asian cohorts. Gastro Hep Advances, 3(7): 1005-1011. https://doi.org/10.1016/j.gastha.2024.06.007
[25] Yamini, G., Raj, J.R.F., Kalyanakumar, P., Soundiraraj, N., Krishnan, R.S., Ganesh, R.K. (2025). Multi-scale feature fusion via transformer-augmented U-Net for fatty liver segmentation in medical imaging. In 2025 3rd International Conference on Intelligent Cyber Physical Systems and Internet of Things (ICoICI), Coimbatore, India, pp. 1-8. https://doi.org/10.1109/ICoICI65217.2025.11252718
[26] Mindouro, A.S.P. (2025). Steatosis quantification in non-alcoholic fatty liver disease: A statistical approach for comparing different image processing procedures. Doctoral dissertation, Universidade de Lisboa. http://hdl.handle.net/10400.5/102427.
[27] Chen, L., Wu, W., Ye, H. (2025). Risk factors for MAFLD and advanced liver fibrosis in adult-onset craniopharyngioma patients: A cross-sectional study. Diabetes, Metabolic Syndrome and Obesity, 18: 859-871. https://doi.org/10.2147/DMSO.S504968
[28] Hoque, M., Saha, G., Abdullah Al, F., et al. (2026). Dataset on NAFLD severity classification with ultrasound liver image & clinical data. Mendeley Data, V2. https://doi.org/10.17632/6rg4hk6728.2