Raimonda Dervishi*![]() | Henri Buçka
| Henri Buçka![]() | Agbata Benedict Celestine
| Agbata Benedict Celestine![]() | Amit Kumar Awasthi
| Amit Kumar Awasthi![]() | Obeng-Denteh William
| Obeng-Denteh William![]() | Hambeer Singh
| Hambeer Singh![]() | Homan Emadifar
| Homan Emadifar![]() | Aseel Smerat
| Aseel Smerat![]()
© 2026 The authors. This article is published by IIETA and is licensed under the CC BY 4.0 license (http://creativecommons.org/licenses/by/4.0/).
OPEN ACCESS
Albania’s electricity system is heavily dependent on hydropower, making its electricity balance sensitive to hydrological variability and system inefficiencies. This paper asks whether Albania’s electricity-balance performance has strengthened over 2000–2024 and whether any improvement is statistically distinguishable and robust to reasonable index-design choices. We construct an electricity balance performance index (EBPI) from official electricity-balance statistics using three standardised components—self-sufficiency, import dependency, and network losses—so that higher values indicate a stronger balance. We analyse temporal dynamics using linear regression, a generalized additive model (GAM) to capture nonlinear trends, and segmented regression to detect structural changes. These analyses are complemented by moving-block bootstrap confidence intervals (CIs) for sub-period means and by weighting-sensitivity checks. We find a statistically significant long-run improvement in EBPI, with evidence of a post-2012 strengthening and the 2020–2024 sub-period mean lying entirely above zero. Results remain stable under alternative weighting schemes, indicating that the main temporal pattern is not an artefact of a specific composite specification. The findings support policies that sustain supply-side resilience and loss reduction while strengthening demand-side efficiency in buildings and other end-use sectors.
Albania, hydropower, electricity balance, composite indicator, energy security, network losses, structural break
The decarbonisation of power systems and the strengthening of energy security have become central pillars of European and global energy policy. The European Union has committed to climate neutrality by mid-century, with successive policy packages stressing the dual need to reduce energy imports and accelerate both renewable deployment and energy efficiency [1-4]. Buildings account for a large share of final energy use and energy-related CO₂ emissions, so the energy performance of the building stock—especially its electricity use—plays a key role in meeting climate and security-of-supply objectives [5]. Within this framework, the Energy Performance of Buildings Directive (EPBD) and its subsequent amendments, and its recast require Member States to move towards a highly efficient, decarbonised building stock and to ensure that new buildings are nearly zero-energy buildings (NZEBs), while progressively upgrading the existing stock [1-3].
Albania represents a particularly interesting case in this broader transition. Its electricity system is strongly hydro-dominated: hydropower plants account for 95–98% of domestic electricity generation and installed capacity, placing the country among the most hydro-dependent systems in Europe [6-8]. This configuration brings clear benefits in terms of low direct emissions, but it also exposes the power system to substantial hydrological risk and year-to-year variability in output. When hydrological conditions are unfavourable, Albania becomes a significant net importer of electricity, while in wet years it can export surpluses [9, 10]. Historically high transmission and distribution losses have further undermined the balance between domestic supply and demand, making the evolution of the electricity balance a central element of national energy security debates. This paper, therefore, focuses on a concrete analytical problem: how to track, in a transparent and statistically rigorous way, whether Albania’s electricity balance has strengthened over time and whether there is evidence of a structural shift in that trajectory. In such a hydro-dependent context, there is a clear need for quantitative, mathematically based indicators that can track the long-term evolution of the electricity balance using rigorous time-series modelling techniques.
A large literature has explored how to conceptualise and measure energy security through multi-dimensional indices and frameworks. A research [11] proposes a five-dimensional view—availability, affordability, technology development, sustainability, and regulation—and constructs composite indicators to assess national performance. Studies [12, 13] review and extend such work by mapping the diverse definitions and dimensions of energy security and proposing global and national energy security indices based on multiple indicators, including import dependence, diversification, environmental impact, and governance. These contributions underline the value of composite, yet interpretable, metrics for summarising complex energy-system dynamics.
However, most existing indices are designed for cross-country comparisons and whole energy systems, rather than for analysing the electricity balance of small, hydro-dominated systems like Albania’s, using a minimal set of directly observable indicators. In particular, they typically (i) combine dimensions that extend well beyond electricity-balance outcomes, (ii) target cross-sectional benchmarking more than long-run within-country monitoring, and (iii) seldom integrate structural-break detection or index-design sensitivity/uncertainty checks tailored to a single balance identity.
The electricity balance performance index (EBPI) proposed here addresses this specific gap by adopting a narrower construct—electricity-balance performance—operationalised through a parsimonious set of accounting-consistent indicators drawn directly from official balance statistics. Unlike broad energy security indices, the EBPI is built explicitly for dynamic, within-country time-series assessment and is paired with formal tools for trend smoothing and breakpoint detection, alongside transparent diagnostics of component dependence and index-design sensitivity.
In parallel, the building sector and its electrification attract growing attention in the Mediterranean region, where climate conditions and cooling needs pose specific challenges for NZEB implementation. Studies on nearly zero-energy concepts and deep renovation in Southern Europe and Mediterranean climates show that combining envelope upgrades, high-performance glazing, efficient heating, ventilation, and air conditioning (HVAC) systems, and on-site renewables can substantially reduce electricity demand and peak loads [5, 14, 15]. Case studies from Mediterranean countries also highlight that deep renovation and smart integration of rooftop photovoltaic systems and storage can contribute not only to decarbonisation, but also to improved energy security by reducing import needs and enhancing flexibility [16].
Recent research has begun to address these issues in the Albanian context. One study [17] quantifies the optimum insulation thickness of exterior walls for the Albanian building stock and assesses associated costs, demonstrating that cost-effective envelope improvements can yield large energy savings in residential buildings. At the household scale, another study [18] uses multivariable regression models and the RETScreen energy modelling tool to analyse a rooftop PV system combined with energy efficiency measures and solar water heating for a representative dwelling in Tirana, showing substantial potential reductions in grid electricity consumption and a significant solar contribution to hot-water demand. These micro-scale studies illustrate how Albanian households can support decarbonisation and system flexibility, but they do not directly examine how such measures connect to the long-term evolution of the national electricity balance or to energy-security-oriented performance metrics.
At the same time, official statistics from the Albanian Institute of Statistics (INSTAT) provide a consistent annual electricity balance for Albania from 2000 onwards, including domestic generation, imports, exports, network losses, and total final consumption, as well as a more recent breakdown of final electricity use into household and non-household sectors [19]. To date, these data have largely been used in descriptive reports and planning documents, rather than for constructing a quantitative index of electricity balance performance or applying modern statistical modelling to detect structural changes over time. Consequently, there remains a gap between (i) broad, multi-dimensional energy security indices that are often cross-sectional in design, (ii) detailed building-scale analyses of energy efficiency and rooftop PV, and (iii) a simple, electricity-specific composite indicator that tracks how a hydro-dominated power system like Albania’s is evolving over decades, using long, internally consistent official time series. Addressing this gap requires an electricity-balance-specific index that is directly interpretable in terms of balance identities, suitable for time-series trend and breakpoint modelling, and accompanied by basic checks on component dependence and index-design sensitivity.
This paper addresses these gaps by developing a mathematical modelling framework centred on an EBPI for Albania and analysing its evolution over the period 2000–2024. The EBPI combines three core indicators—self-sufficiency (domestic production as a share of total available electricity), import dependency, and the share of network losses—into a single standardised index, following the logic of multi-dimensional energy security metrics but using a deliberately parsimonious set of directly measurable variables [11, 13]. Although the empirical focus is on Albania, the proposed EBPI framework is generic and could be applied to other small, hydro-dependent electricity systems in South-Eastern Europe and beyond. Methodologically, the paper integrates composite-index construction with time-series modelling tools to track the dynamics of the electricity balance in a statistically rigorous way. To characterise long-term, potentially non-linear trends in EBPI, we employ a generalized additive model (GAM) with penalised regression splines, which is well suited to smoothing time-series patterns in relatively short samples [20]. We then complement this flexible representation with segmented linear regression to identify possible structural breakpoints in the EBPI trajectory [21], implemented using the R package segmented [22]. In line with composite-indicator good practice, we also report correlation diagnostics among the EBPI components: self-sufficiency (SS), import dependency (ID), and losses share (LS), and implement a sensitivity/uncertainty assessment based on alternative weighting schemes. In particular, we summarise index-design uncertainty using an annual p05–p95 band obtained by repeatedly re-weighting the three standardised components with 5,000 randomly generated, plausible weight vectors (centred on equal weighting).
In addition, we examine the robustness of the composite index to alternative weighting schemes by defining security-focused and efficiency-focused EBPI variants that put greater emphasis on supply security and on network efficiency, respectively. Finally, drawing on disaggregated data for 2018–2024, we examine the evolution of household and non-household electricity consumption levels and their shares in total final consumption, thereby linking macro-level electricity balance performance to the structure of final demand. Taken together, these elements yield three main contributions. First, the paper provides the first long-term, model-based assessment of Albania’s electricity balance using a composite performance index grounded in established energy security concepts. Second, it identifies statistically supported turning points in the EBPI and discusses their timing in relation to hydrological variability and demand dynamics in a hydro-dominated power system, without implying causal attribution. Third, by explicitly distinguishing household and non-household electricity use in recent years, it creates a bridge between macro-level electricity balance analysis and micro-level building and rooftop PV studies in Albania [17, 18], offering insights for energy-security-oriented building renovation and NZEB strategies in the wider Mediterranean context. The robustness checks using alternative EBPI specifications reinforce these contributions by showing that the main temporal patterns are stable under reasonable variations in the weighting scheme used to construct the index.
2.1 Data and indicators
The analysis is based on official electricity statistics published by the INSTAT [19]. We use annual electricity balance data for 2000–2024, which report gross and net domestic production, imports, exports, network losses, and total final consumption by main balance categories, expressed in gigawatt-hours (GWh). In addition, we draw on more detailed balance tables with quarterly information by consumer category to obtain the sectoral breakdown of final electricity consumption (households vs. non-households) for 2018–2024.
From these INSTAT series, we construct the following annual variables (all in GWh):
From these basic quantities, we derive several relative indicators that summarise the main components of the electricity balance, in line with common practice in energy statistics and security-of-supply assessments [23, 24]:
$S S_t=\frac{\mathrm{P}_t}{\mathrm{~A}_t}$
measuring the share of available electricity covered by domestic production (values above 1 indicate net exporter years).
$I D_t=\frac{\mathrm{N}_t}{\mathrm{~A}_t}$
measuring the share of available electricity covered by net imports (negative values correspond to net exporter years).
$L S_t=\frac{\mathrm{L}_t}{\mathrm{~A}_t}$
measuring the proportion of available electricity lost in the network.
$\mathrm{SH}_t^H=\frac{c_t^H}{c_t^H+c_t^{N H}}$
measuring the share of total final electricity consumption accounted for by households.
$\mathrm{SH}_t^{N H}=\frac{c_t^{N H}}{c_t^H+c_t^{N H}}$
measuring the corresponding share for non-household users.
These variables provide the empirical basis for constructing the composite index and for subsequent time-series modelling of electricity balance performance.
2.2 Construction of the electricity balance performance index
To provide a synthetic measure of the overall performance of the electricity balance, we constructed a composite EBPI that combines self-sufficiency, import dependency, and the losses share into a single standardised indicator, following the logic of composite energy security indices [11-13].
In line with the broader energy-security literature, we treat EBPI as a deliberately parsimonious measure focused on the electricity balance. It targets three core and consistently observable dimensions of supply performance over the 2000–2024 period: (i) domestic adequacy/coverage of availability (self-sufficiency), (ii) exposure to external supply conditions (import dependency), and (iii) technical efficiency of delivery (network losses). While this scope is narrower than “full-spectrum” energy security—which may also include diversification, affordability, and reliability/outage indicators—it is appropriate for long-run annual balance data, for which comparable time-consistent series are available for all components.
First, each of the three components was standardised across the 2000–2024 period using z-scores:
$\mathrm{SS}_t^*=\frac{S S_t-\overline{S S}}{\sigma_{S S}}, \mathrm{ID}_t^*=\frac{I D_t-\overline{I D}}{\sigma_{I D}}, \mathrm{LS}_t^*=\frac{L S_t-\overline{L S}}{\sigma_{L S}}$
where, $\overline{S S}, \overline{I D}, \overline{L S}$ denote sample means and σSS, σID, σLS the corresponding standard deviations. Since higher import dependency and higher losses represent worse performance, their standardised values were multiplied by -1 so that larger values consistently correspond to more favourable outcomes:
$\mathrm{ID}_t^{*-}=-\mathrm{ID}_t^*, \mathrm{LS}_t^*=-\mathrm{LS}_t^*$
The EBPI is constructed as the simple arithmetic mean of the three standardised components after reorienting them so that larger values consistently represent more favourable outcomes:
$\mathrm{EBPI}_t=\frac{S S_t^*+I D_t^{* n e g}+L S_t^{* n e g}}{3}$
By construction, EBPI has (approximately) zero mean over the sample period, with positive values indicating years in which the overall electricity balance—characterized by high self-sufficiency, low import dependency, and low losses—is better than the long-term average, while negative values indicate weaker performance. This composite index serves as the main dependent variable in the subsequent statistical modelling of temporal trends.
To address the concern that composite indicators can be influenced by mechanical or statistical dependence among inputs, we also implement two transparency and robustness diagnostics. First, we compute pairwise Pearson correlations among SSt, IDt and LSt over the 2000–2024 period. This analysis documents the co-movement of the components and verifies that the import-dependency measure does not create mechanical redundancy with self-sufficiency. The resulting correlation matrix is reported and discussed in the Results section. Second, we quantify uncertainty in EBPI summaries through two approaches: (i) Sub-period mean EBPI values are accompanied by 95% confidence intervals (CIs), computed using a within-subperiod moving block bootstrap (block length = 3; B = 4,000), and (ii) Index-design sensitivity is assessed by recomputing EBPI under alternative weighting schemes, including a simulation-based annual p05–p95 band obtained from 5,000 plausible weight vectors (centred on equal weighting), as described in Section 2.5.
2.3 Descriptive statistics and graphical analysis
As a preliminary step for the modelling, we conduct a descriptive analysis of the electricity balance indicators. For the 2000–2024 period, we compute summary statistics (mean, minimum, maximum) for available electricity, domestic production, net imports, network losses, total final consumption, and the three relative indicators (self-sufficiency, import dependency, losses share).
To gain insight into medium-term changes, we compute sub-period averages for four blocks: 2000–2007, 2008–2013, 2014–2019, and 2020–2024. Time-series plots are used to visualise the evolution of key indicators. In particular, we plot domestic production, net imports, and available electricity; self-sufficiency and import dependency; and the losses share over 2000–2024.
For the period 2018–2024, we construct stacked bar charts of final electricity consumption by combining levels (GWh) and shares (%) to represent the structure of final demand by households and non-households. All descriptive analyses and plots are produced in R [25-27]. This exploratory stage supports the specification and interpretation of the subsequent regression models.
2.4 Statistical modelling of electricity balance performance index trends
To quantify the temporal evolution of the composite EBPI and to test for non-linear trends and structural changes, we apply three complementary regression specifications, all defined on the annual values EBPIt over the period 2000–2024. In combination, these three specifications provide a statistically rigorous framework for analysing the time evolution of the EBPI.
2.4.1 Linear trend model
First, we fitted a simple linear regression model of EBPI on the calendar year
$\mathrm{EBPI}_t=\beta_0+\beta_1\text{year}_t+\varepsilon_t$
where, β1 captures the average annual change in EBPI and εt is an error term. This model provides a baseline measure of whether the composite index exhibits a statistically significant monotonic trend over time [28]. For this specification, we report the estimated slope and the adjusted R2 as a descriptive measure of goodness-of-fit.
2.4.2 Generalized additive model
Second, to allow for smooth non-linear temporal patterns, we estimated a one-dimensional GAM of the form
$\mathrm{EBPI}_t=\beta_0+\mathrm{f}\left(\right.\text{year}_t)+\varepsilon_t$
where, $\mathrm{f}(\cdot)$ is a smooth function of year represented by a penalised thin-plate regression spline [20]. We used a Gaussian family with identity link, as EBPI is a continuous index centred around zero, and set the basis dimension for the smooth term to k = 5. Model adequacy was assessed using the approximate significance of the smooth term, effective degrees of freedom, adjusted R2, and deviance explained. In the empirical results, we report the estimated smooth trend together with the adjusted R2 (and, where relevant, summary measures such as effective degrees of freedom and deviance explained).
2.4.3 Segmented linear regression
Finally, to investigate potential structural changes in the EBPI time series, we fitted a segmented linear regression model with an unknown breakpoint in calendar year. Starting from the simple linear model above, we applied the segmented regression procedure [21, 22] to estimate the breakpoint ψ and the piecewise slopes before and after it. The segmented model can be written as
$\mathrm{EBPI}_t=\beta_0+\beta_1 \mathrm{year}_t+\beta_2\left(\operatorname{year}_t-\psi\right)_{+}+\varepsilon_t$
where, (yeart−ψ)+ = max(0, yeart−ψ). In this specification, β1 represents the slope of EBPI with respect to the year before the breakpoint, whereas β1+β2 represents the slope after the breakpoint. The breakpoint ψ and its standard error were estimated iteratively. The estimated breakpoint and associated slopes are presented together with the adjusted R2 for this specification.
Given the relatively short sample (25 annual observations), all models were kept deliberately parsimonious and applied only to the composite index, avoiding over-parameterisation. All statistical analyses were carried out in R [25], using standard implementations of linear, generalized additive, and segmented regression [20-22].
2.5 Sensitivity and uncertainty analysis of the electricity balance performance index specification
To assess the robustness of the EBPI to alternative design choices, we compute two additional variants of the index alongside the baseline specification with equal weights on self-sufficiency, import dependency, and the share of network losses, in line with good practice for composite indicators and sensitivity analysis [29, 30].
As a transparency check in composite-index construction, we compute pairwise Pearson correlations among SSt, DIt, and LSt over 2000–2024. This diagnostic does not alter the EBPI mechanically; rather, it documents whether components tend to move together, which can influence composite-index behaviour and the interpretation of changes over time [29, 30] and helps verify that the selected import measure does not introduce mechanical redundancy with self-sufficiency.
A security-focused specification puts greater weight on self-sufficiency and import dependency, reflecting the importance of domestic coverage of demand and reduced reliance on imports, while an efficiency-focused variant assigns a higher weight to network losses, emphasising grid performance and loss reduction. For comparability, all three versions of the index are expressed on the same standardised scale as the baseline EBPI, so that higher values consistently indicate a stronger electricity balance. Specifically, we implement (i) a baseline equal-weight index (1/3,1/3,1/3), (ii) a security-focused variant with higher weights on self-sufficiency and reduced import dependency (0.50, 0.30, 0.20), and (iii) an efficiency-focused variant with higher weight on loss reduction (0.20, 0.30, 0.50). The security-focused and efficiency-focused weightings are illustrative, non-extreme alternatives chosen to reflect two plausible policy emphases (security of supply versus loss reduction).
Comparing their time profiles allows us to evaluate whether the main conclusions about the timing and magnitude of improvements in Albania’s electricity balance are sensitive to reasonable variations in the weighting scheme [11, 13]. This sensitivity analysis complements the main regression results and strengthens the modelling framework from the perspective of composite indicator design. Finally, to characterise index-design uncertainty more continuously, we construct a simulation-based p05–p95 uncertainty band for annual EBPI values by repeatedly re-weighting the three standardised components using a large set of randomly generated weight vectors (centred on equal weighting), following composite-indicator sensitivity practice [29, 30] (we summarise this index-design uncertainty using the annual p05–p95 range across re-weighted EBPI values).
This section describes the long-term evolution of Albania’s electricity balance over 2000–2024, focusing first on levels and relative indicators and then on how improvements are distributed across self-sufficiency, import dependency, and network losses.
3.1 Levels and relative indicators
Descriptive statistics for the main electricity balance indicators over 2000–2024 are reported in Table 1. Total available electricity averages 6,968.2 GWh per year, with values ranging from 5,348.9 to 8,414.8 GWh, highlighting substantial interannual variability. Domestic net production shows even greater variability (2898.7–8962.7 GWh), while net imports range from sizeable net import positions to years of net exports (–919.8 to 3,174.4 GWh). Network losses remain a non-trivial component of the balance, averaging 2,139.8 GWh per year (1,614.3–3,305.6 GWh), and total final consumption ranges from 3,350.6 to 6,629.9 GWh (mean 4,828.4 GWh).
Table 1. Summary statistics for Albania’s electricity balance indicators, 2000–2024
|
Variable |
Mean |
Min |
Max |
|
Available electricity |
6,968.2 |
5,348.9 |
8,414.8 |
|
Domestic net production |
5,710.6 |
2,898.7 |
8,962.7 |
|
Net import |
1,247.6 |
-919.8 |
3,174.4 |
|
Losses |
2,139.8 |
1,614.3 |
3,305.6 |
|
Total final consumption |
4,828.4 |
3,350.6 |
6,629.9 |
|
Self-sufficiency |
0.812 |
0.506 |
1.133 |
|
Import dependency |
0.188 |
-0.133 |
0.494 |
|
Losses share |
0.314 |
0.198 |
0.427 |
Time-series plots of domestic net production, net imports, and available electricity (Figure 1) confirm the strong year-to-year fluctuations and the tight inverse co-movement between production and net imports. Years with relatively low domestic output are characterised by high net imports, while years with relatively high domestic output show the opposite pattern, with some years exhibiting negative net imports (i.e., net exports) and self-sufficiency above unity. Despite this volatility, a gradual upward shift in available electricity is evident in the most recent decade. The average values of self-sufficiency, import dependency, and the losses share are consistent with an electricity system that is structurally dependent on hydropower and subject to sizeable year-to-year fluctuations in domestic output and net imports.

Figure 1. Domestic electricity production, net imports and total available electricity in 2000–2024
Table 2. Sub-period averages of self-sufficiency, import dependency and losses share
|
Sub-Period |
Self-Sufficiency |
Import Dependency |
Losses Share |
|
2000–2007 |
0.792 |
0.230 |
0.390 |
|
2008–2013 |
0.765 |
0.235 |
0.360 |
|
2014–2019 |
0.805 |
0.195 |
0.274 |
|
2020–2024 |
0.945 |
0.055 |
0.209 |
Source: Author calculations based on a previous study [19].

Figure 2. Shares of available electricity for self-sufficiency, import dependency, and losses in 2000–2024
Network losses, measured as a share of available electricity, represent a substantial component of the balance, particularly in the early 2000s. Table 2 summarizes how Albania’s electricity balance indicators—self-sufficiency, import dependency, and the losses share—have evolved across four sub-periods (2000–2007, 2008–2013, 2014–2019, 2020–2024), all expressed as fractions of available electricity. When averaged by these sub-periods, self-sufficiency increases from 0.792 in the first block to 0.945 in the last, while import dependency declines from 0.230 to 0.055. This trend indicates that Albania has progressively strengthened its electricity balance over time, despite persistent short-term variability in domestic output and net imports. Over the same intervals, the mean losses share falls from 0.390 in 2000–2007 to 0.209 in 2020–2024, suggesting that grid improvements and loss-reduction measures have materially enhanced system efficiency.
Figure 2 illustrates these dynamics, with all three indicators expressed as shares of available electricity. Over the full period, domestic production covers on average about 81% of available electricity (mean self-sufficiency = 0.812), while net imports account for the remaining 19% (mean import dependency = 0.188). Both indicators exhibit wide variation (self-sufficiency ranges from 0.506 to 1.133; import dependency from –0.133 to 0.494).
Before constructing EBPI, we first assess whether its inputs are strongly interdependent. The correlation analysis among SSt, DIt, and LSt shows that the strongest relationship is the expected negative association between domestic coverage and import exposure (corr(SSt, DIt) = −0.832), implying that years with higher domestic production relative to availability tend to coincide with lower import exposure. In contrast, correlations involving the loss shares are noticeably weaker (corr(SSt, LSt) = −0.299 and corr(DIt, LSt) = −0.161), suggesting that loss dynamics are not merely a mechanical transformation of either the production or import shares. Overall, these patterns support interpreting EBPI as a multi-component balance indicator, rather than a redundant re-expression of a single underlying ratio.
3.2 Decomposition of the improvements in balance indicators by sub-period
The sub-period averages reported in Table 2 help clarify how the observed strengthening of the electricity balance is distributed across its three main components. In the early 2000s (2000–2007), self-sufficiency averaged about 0.79, import dependency about 0.23, and the share of network losses about 0.39. This configuration reflects a system heavily reliant on net imports and is characterised by exceptionally high network losses compared with typical transmission and distribution loss levels reported for European grids [31] and with previous assessments of Albania’s loss levels based on INSTAT data.
In the subsequent block (2008–2013), self-sufficiency declines slightly to around 0.77 and import dependency rises marginally to about 0.24, while the losses share falls to roughly 0.36. This pattern is consistent with a period in which improvements in network performance start to materialise, but are not yet accompanied by a clear strengthening of the overall balance, as increased loss efficiency is partly offset by weaker self-sufficiency and somewhat higher reliance on imports.
From 2014–2019, all three indicators moved in a more favourable direction. Average self-sufficiency rises to about 0.81, import dependency falls to around 0.20, and the losses share drops more sharply to roughly 0.27. The most recent period, 2020–2024, marks a further step change: self-sufficiency increases to about 0.95 on average, import dependency falls to around 0.06, and the losses share declines to roughly 0.21. Comparing the first and last blocks, self-sufficiency thus increases by about 0.15 points, import dependency falls by around 0.18 points, and the losses share is reduced by about 0.18 points. In absolute terms, this indicates that reductions in import dependency and in network losses are at least as important as the increase in self-sufficiency in driving the improvement in the configuration of the electricity balance.
Taken together, the block averages show that the transition from a weaker to a stronger electricity balance is not driven by a single component, but by the joint evolution of all three indicators. The early 2000s are characterised by high losses and substantial import reliance; the late 2000s and early 2010s represent a mixed phase in which loss reduction progresses, but self-sufficiency does not yet improve; and the mid-2010s and early 2020s are associated with simultaneous gains in domestic coverage of demand, reduced dependence on imports, and markedly lower losses. This decomposition is consistent with, and complements, the EBPI-based results presented later in the paper, which summarise these multidimensional changes into a single composite index. This decomposition is consistent with, and complements, the EBPI-based results presented later in the paper, which summarise these multidimensional changes into a single composite index.
The sectoral breakdown of final electricity consumption for 2018–2024 is summarised in Table 3. Over this period, total final consumption oscillates between approximately 5855.8 and 6,629.9 GWh per year. Household consumption ranges from 2,681.9 to 3,408.9 GWh, while non-household consumption lies between 2,992.5 and 3,540.4 GWh. Figure 3 displays the evolution of household and non-household demand, both in absolute terms (GWh) and as shares of total final consumption, providing a compact visual summary of levels and structure.
In absolute terms, household consumption exhibits a moderate increasing trend, particularly towards the end of the period, with a noticeable rise in 2024 [5]. Non-household consumption is somewhat more volatile, peaking in 2021 and then declining slightly in subsequent years, but remaining in the 3000–3500 GWh range.
In relative terms, the household share of total final consumption remains close to 50% throughout 2018–2024. The annual household share varies between about 0.458 and 0.520, with households dominating slightly in some years (e.g., 2020, 2023, 2024) and non-households dominating in others (e.g., 2018, 2019, 2021–2022). The corresponding non-household shares range from 0.480 to 0.542. Taken together, Table 3 and Figure 3 indicate a relatively stable and nearly balanced distribution of final electricity consumption between household and non-household users in the recent period, with no pronounced structural shift in sectoral dominance [5].
Table 3. Final electricity consumption by sector in 2018–2024: Annual levels (GWh) and shares (%)
|
Year |
Households (GWh) |
Non-Households (GWh) |
Households Share (%) |
Non-Households Share (%) |
|
2018 |
2,681.9 |
3,173.9 |
45.8 |
54.2 |
|
2019 |
2,750.2 |
3,210.3 |
46.1 |
53.9 |
|
2020 |
2,965.5 |
2,992.5 |
49.8 |
50.2 |
|
2021 |
3,089.5 |
3,540.4 |
46.6 |
53.4 |
|
2022 |
3,074.8 |
3,191.0 |
49.1 |
50.9 |
|
2023 |
3,116.8 |
3,104.5 |
50.1 |
49.9 |
|
2024 |
3,408.9 |
3,147.4 |
52.0 |
48.0 |
Source: Author calculations based on a previous study [19].

Figure 3. Sectoral composition of final electricity consumption in 2018–2024: Levels (GWh) and shares (%)
To synthesise the joint behaviour of self-sufficiency, import dependency and the share of network losses, we construct a composite EBPI. Each component is first standardised over 2000–2024, and the EBPI is then defined as the simple arithmetic mean of standardised self-sufficiency and the negated, standardised values of import dependency and the loss shares. By construction, higher EBPI values correspond to a more favourable configuration of the electricity balance, characterised by higher self-sufficiency, lower import dependency, and lower network losses.
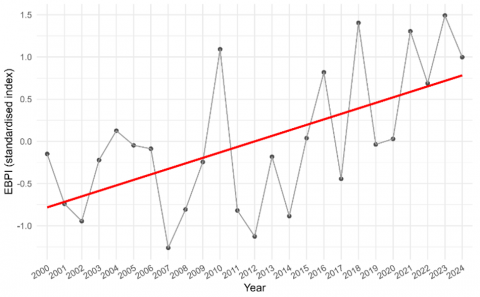
Over 2000–2024, EBPI spans from approximately 1.26 to +1.49 standard deviation units, with a mean close to zero and a slightly right-skewed distribution, indicating that a non-negligible number of years achieve substantially better-than-average performance. The lowest EBPI values in the sample are observed in 2007 (–1.26), 2012 (–1.13), and 2002 (–0.95), all of which lie in the lower tail of the distribution and reflect combinations of relatively low self-sufficiency, high import dependency, and elevated network losses. By contrast, the highest EBPI values occur in 2023 (1.49), 2018 (1.40), and 2021 (1.30), which occupy the upper tail of the distribution and correspond to years in which high domestic coverage of demand, markedly reduced reliance on imports and substantially lower losses jointly produce a much stronger electricity balance. These extreme years provide concrete illustrations of the transition from weaker to stronger configurations of the electricity balance over time.
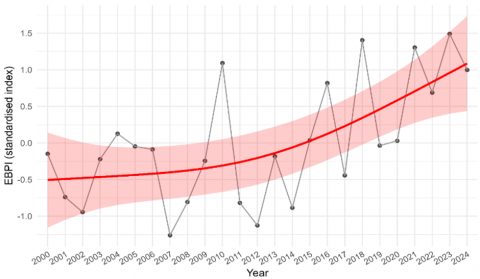
The fitted linear trend model, shown in Figure 4, exhibits a statistically significant positive slope of about 0.065 (p ≈ 0.002; adjusted R² ≈ 0.32), implying a clear improvement in EBPI over the study period. Allowing for a flexible, non-linear trajectory via a GAM with a smooth function of year yields a better fit, as illustrated in Figure 5. The GAM explains around 43% of the deviance (adjusted R² ≈ 0.38), and the smooth term is statistically significant (effective degrees of freedom ≈ 1.9, p ≈ 0.004). The smoothed curve indicates relatively low and fluctuating EBPI values in the early 2000s, followed by a marked and sustained improvement beginning in the early 2010s.
Figure 4. Electricity balance performance index (EBPI) with linear trend in 2000–2024
Figure 5. EBPI with a generalized additive model-smoothed trend in 2000–2024
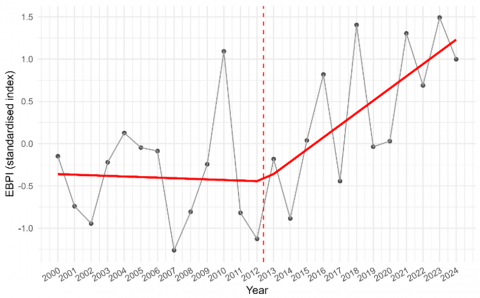
Figure 6. EBPI with segmented linear trend in 2000–2024
Segmented linear regression further refines this picture by identifying a structural break. The estimated breakpoint occurs around 2012 (≈ 2012.4, standard error ≈ 3.4), with a near-zero slope before the breakpoint and a positive slope of about 0.145 thereafter (Figure 6). The segmented model attains a higher adjusted R² than the simple linear model (≈ 0.38 vs. 0.32), suggesting that a two-phase representation provides a more appropriate description of the EBPI series. Overall, these model-based results indicate that the performance of Albania’s electricity balance has improved significantly over time, with a distinct shift to a steeper upward trajectory in the early 2010s.
Table 4 reports the mean EBPI for four sub-periods (2000–2007, 2008–2013, 2014–2019, and 2020–2024), together with 95% CIs obtained from a within-subperiod moving block bootstrap (block length = 3; B = 4,000). Average EBPI is negative in the first two sub-periods and turns positive thereafter. Notably, the 2020–2024 CI lies entirely above zero, indicating a statistically distinguishable strengthening of electricity-balance performance relative to earlier periods, whereas the 2014–2019 interval still overlaps zero, consistent with transitional dynamics and substantial year-to-year variability. The corresponding estimates are −0.219 (95% CI: [−0.468, 0.226]) for 2000–2007, −0.346 (95% CI: [−0.740, 0.048]) for 2008–2013, 0.078 (95% CI: [−0.042, 0.457]) for 2014–2019, and 0.672 (95% CI: [0.472, 0.861]) for 2020–2024.
Table 4. Sub-period mean values of the EBPI, with 95% CIs estimated via a within-subperiod moving block bootstrap
|
Sub-Period |
Mean Electricity Balance Performance Index (EBPI) |
95% Confidence Interval (CIs) |
|
2000–2007 |
−0.219 |
[−0.468, 0.226] |
|
2008–2013 |
−0.346 |
[−0.740, 0.048] |
|
2014–2019 |
0.078 |
[−0.042, 0.457] |
|
2020–2024 |
0.672 |
[0.472, 0.861] |
Source: Author calculations based on a previous study [19]
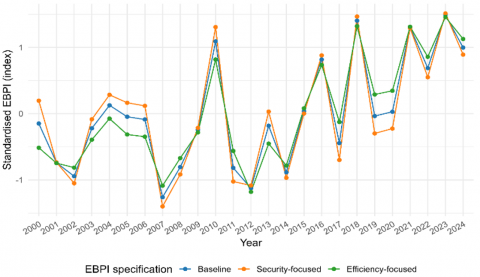
The robustness analysis reported in Figure 7 confirms that these conclusions do not hinge on the specific weighting scheme used to construct the EBPI. The baseline index and the two alternative specifications—a security-focused variant that places greater weight on self-sufficiency and reduced import dependency, and an efficiency-focused variant that gives greater weight to lower network losses—move very closely together over 2000–2024. All three series display relatively low and volatile values in the early 2000s, followed by a gradual improvement and a more pronounced upward trajectory from the early 2010s onwards. While the alternative indices differ slightly in levels in some years, the timing and magnitude of the post-2012 strengthening of the electricity balance are essentially unchanged. This suggests that the observed transition from a weaker to a stronger configuration of the electricity balance is a robust feature of the data, rather than an artefact of a particular index design.
Beyond sampling uncertainty (Table 4), EBPI also depends on the weighting scheme used to aggregate its components. To assess index-design sensitivity, we recomputed EBPI under 5,000 plausible weighting schemes and summarised the resulting annual p05–p95 range. These ranges capture index-design uncertainty rather than sampling variability. Across years, the p05–p95 band has a median width of 0.377 and a maximum width of 0.584 (standardised EBPI units). Importantly, the upward long-run profile and the ordering of sub-period means remain stable under alternative weights, indicating that the main conclusions are robust to reasonable weighting variation.
Figure 7. Robustness of the EBPI to alternative weighting of its components (Albania, 2000–2024)
The results of this study provide a coherent picture of how Albania’s electricity balance has evolved over 2000–2024 and how these dynamics relate to broader debates on energy security and the energy transition. Combining traditional balance indicators with the EBPI, we document a gradual strengthening of the electricity balance—higher self-sufficiency, lower import dependency, and markedly lower network losses—while the system remains exposed to hydrological variability and substantial year-to-year fluctuations [19].
A key implication is that Albania’s trajectory is broadly aligned with international objectives to strengthen security of supply through domestic low-carbon generation and efficiency improvements [1-3, 11-13]. The rise in self-sufficiency and reduced reliance on imports is consistent with energy-security frameworks that emphasise availability and external vulnerability, while the pronounced inter-annual swings in production and imports underline the continued relevance of resilience and flexibility in hydro-dependent systems [11, 12]. The contribution of this study is to operationalise an electricity-balance “slice” of energy security—centred on coverage, import exposure, and losses—using a deliberately parsimonious set of directly observable balance variables, prioritising transparency and reproducibility for long-run tracking.
The decline in network losses is particularly noteworthy. Losses in the early 2000s were exceptionally high, whereas recent levels—around one-fifth of available electricity—represent a substantial improvement, although they remain above the internationally reported range of 4–15% for total transmission and distribution losses [31]. From a policy perspective, loss reduction is powerful because each percentage-point reduction effectively increases usable electricity without new generation, amplifying the benefits of domestic supply improvements. At the same time, remaining loss levels indicate scope for further gains through continued technical upgrades and sustained efforts to reduce non-technical losses [32]. We interpret year-specific changes cautiously, given hydrological volatility and potential measurement or definition differences in loss reporting.
The EBPI offers a useful lens through which to interpret these parallel developments. By combining self-sufficiency, import dependency, and losses into a single standardised index, it reflects the multi-dimensional nature of energy security highlighted in composite index frameworks [11, 13]. The significant upward trend in EBPI and the structural break identified in the early 2010s suggest a transition from a regime of chronic vulnerability to one of gradual consolidation. Before the breakpoint, the system oscillated around a relatively weak configuration of indicators; afterwards, improvements in domestic production, import dependence, and losses moved in the same direction, resulting in a systematically stronger electricity balance. Although the analysis cannot attribute this shift to specific interventions, the timing coincides with a period of accelerated investment in generation and grid infrastructure and with the implementation of key market and regulatory reforms, as reflected in regional and EU-level energy policy documents.
A natural concern is whether conclusions depend on the composite design. The robustness checks suggest they do not. Alternative weighting schemes that prioritise supply security (higher weights on self-sufficiency and reduced import dependency) or network efficiency (higher weights on loss reduction) closely track the baseline index over 2000–2024, and the broader improvement pattern remains stable. To further distinguish persistent shifts from short-run volatility, we report both uncertainty for sub-period means (block-bootstrap CIs) and index-design uncertainty (p05–p95 bands across 5,000 plausible weighting schemes), reinforcing that the main temporal ordering is robust to reasonable design variation.
On the demand side, the finding that households and non-households each account for roughly half of final electricity consumption (2018–2024) implies that progress toward national and EU climate objectives cannot rely solely on decarbonising supply; it must also address end-use efficiency across both sectors [1, 2]. The building sector is central in European decarbonisation strategies, with particular relevance in Southern Europe, including deep renovation and NZEB policies [33, 34]. Evidence from the broader literature indicates that deep retrofits and NZEB-oriented standards can substantially reduce energy demand in both residential and non-residential buildings, including in Mediterranean climates comparable to parts of Albania [5, 14, 35-37]. In Albania’s hydro-sensitive context, demand-side efficiency and flexibility measures (e.g., retrofits, efficient non-residential upgrades, and demand response) can help contain demand growth and reduce exposure during low-hydrology years [24]. These implications are indicative rather than evaluative: they identify leverage points suggested by balance constraints rather than quantify policy impacts.
At the same time, several limitations of this study should be underlined. The analysis relies on aggregate annual data at the national level and cannot establish causal links between policies, investments, and the observed trends. As with any composite index, the EBPI is, in principle, sensitive to the choice of indicators, weights, and standardisation method. The sensitivity checks with alternative weighting schemes implemented here mitigate this concern to some extent by showing that the main temporal patterns are stable under reasonable variations in weights, but the index still does not capture all dimensions of energy security identified in the broader literature, such as affordability or technological innovation [11, 12]. The sectoral breakdown of final consumption is limited to a short recent window and to a coarse household/non-household distinction, precluding more granular analysis by subsector, income group, or building typology. Finally, the focus on electricity excludes interactions with other energy carriers, notably fuels used for space heating and transport, which are central to the NZEB and deep-retrofit debate and to the overall energy transition.
Despite these caveats, the study demonstrates that relatively simple indicators derived from official statistics can be combined into a composite index and analysed with standard time-series models to generate policy-relevant insights into the long-term performance of a national electricity system. In the case of Albania, the evidence points to measurable improvements in security of supply and network efficiency, but also to the need for continued diversification of the generation mix, deeper regional integration, and ambitious demand-side measures in both the residential and non-residential building stock. As NZEB and deep-renovation agendas advance across Europe and the Mediterranean, such integrated, data-driven assessments can help ensure that supply-side and demand-side policies are designed in a mutually reinforcing way, and that observed improvements in electricity balance performance are robust to alternative perspectives on what should be prioritised in energy security. Recent contributions highlight the practical value of transparent time-series modelling for electricity-system planning, consistent with our emphasis on statistically grounded trend assessment and structural-change detection [38].
This paper contributes a parsimonious, electricity-balance–focused framework for tracking performance in a hydropower-dominated system using official annual accounts. Using this framework, we provide an integrated assessment of the evolution of Albania’s electricity balance over the period 2000–2024, combining traditional indicators of domestic generation, net imports, network losses, and final consumption with a composite EBPI. The results show that the electricity balance has strengthened over time: self-sufficiency has increased, import dependency has declined, and the share of network losses in available electricity has fallen substantially, even though the system remains exposed to hydrological variability and inter-annual fluctuations in supply. By summarising these developments into a single measure, the EBPI reveals a statistically significant upward trend and a structural break in the early 2010s. Before this breakpoint, the overall configuration of the electricity balance stagnated around a relatively vulnerable state, whereas afterwards the index exhibits a clearly positive slope. This pattern suggests a transition from a phase of chronic vulnerability to one of gradual consolidation, plausibly supported by investments in domestic generation, network modernisation, and regulatory reforms. Importantly, alternative security-focused and efficiency-focused versions of the index, which put greater weight on supply security or on network efficiency, yield very similar temporal profiles. This robustness indicates that the observed post-2012 strengthening of the electricity balance is not an artefact of a particular weighting scheme but a stable feature of the underlying data. In parallel, the sectoral analysis of final electricity consumption for 2018–2024 shows that households and non-households each account for roughly half of total demand.
Beyond these empirical patterns, the paper’s core contribution is methodological: it operationalises a transparent composite index from official statistics and combines it with complementary time-series tools (linear trend, GAM smoothing, and segmented regression) to characterise long-run change and detect structural shifts, while adding uncertainty quantification (sub-period CIs and index-design uncertainty). Together, these elements provide a reproducible template for diagnosing whether a hydro-dependent electricity system is moving toward a stronger balance configuration, and whether that diagnosis is robust to reasonable index-design choices.
Crucially, the analysis is descriptive and non-causal: EBPI should be interpreted as a performance-tracking indicator rather than as an evaluation of the causal impact of particular reforms or investments. Accordingly, the policy relevance is to highlight leverage points suggested by the balance dynamics, especially loss reduction, flexibility/diversification to manage hydrological volatility, and demand-side efficiency, rather than to attribute observed improvements to specific interventions.
The study’s limitations motivate targeted extensions. Because the evidence is based on aggregate annual data and a limited indicator set, it cannot cleanly disentangle hydrology-driven volatility from underlying structural change, nor fully capture the affordability and reliability/resilience dimensions of energy security. Direct extensions grounded in these limitations include: (i) incorporating hydrological covariates to separate weather-driven variability from medium-run change; (ii) adding affordability and reliability/resilience metrics (e.g., prices, SAIDI/SAIFI); (iii) benchmarking EBPI against neighbouring hydro-influenced systems using harmonised definitions; and (iv) using higher-frequency balance data, where available, to study seasonality and periods of system stress, such as drought-driven import spikes or peak-demand shortfalls.
The authors acknowledge the Polytechnic University of Tirana for financially supporting the publication of this article.
[1] Kulovesi, K., Oberthür, S., van Asselt, H., Savaresi, A. (2024). The European climate law: Strengthening EU procedural climate governance? Journal of Environmental Law, 36(1): 23-42. https://doi.org/10.1093/jel/eqad034
[2] Schlacke, S., Wentzien, H., Thierjung, E.M., Köster, M. (2022). Implementing the EU Climate Law via the ‘Fit for 55’ package. Oxford Open Energy, 1: oiab002. https://doi.org/10.1093/ooenergy/oiab002
[3] Ah-Voun, D., Chyong, C.K., Li, C. (2024). Europe’s energy security: From Russian dependence to renewable reliance. Energy Policy, 184: 113856. https://doi.org/10.1016/j.enpol.2023.113856
[4] Olasolo-Alonso, P., López-Ochoa, L.M., Las-Heras-Casas, J., López-González, L.M. (2023). Energy performance of buildings directive implementation in southern European countries: A review. Energy and Buildings, 281: 112751. https://doi.org/10.1016/j.enbuild.2022.112751
[5] Belussi, L., Barozzi, B., Bellazzi, A., Danza, L., et al. (2019). A review of performance of zero energy buildings and energy efficiency solutions. Journal of Building Engineering, 25: 100772. https://doi.org/10.1016/j.jobe.2019.100772
[6] Mehmeti, A., Elezi, E., Xhebraj, A., Andoni, M., Bezo, Y. (2025). Is green hydrogen a strategic opportunity for Albania? A Techno-economic, environmental, and SWOT analysis. Clean Technologies, 7(4): 86. https://doi.org/10.3390/cleantechnol7040086
[7] Malka, L., Daci, A., Kuriqi, A., Bartocci, P., Rrapaj, E. (2022). Energy storage benefits assessment using multiple-choice criteria: The case of Drini River Cascade, Albania. Energies, 15(11): 4032. https://doi.org/10.3390/en15114032
[8] Dhoska, K., Bebi, E., Markja, I., Milo, P., Sita, E., Qosja, S. (2024). Modelling the wind potential energy for metallurgical sector in Albania. Scientific Reports, 14: 1302. https://doi.org/10.1038/s41598-024-51841-x
[9] Gebremedhin, A., Zhuri, M. (2020). Power system analysis: The case of Albania. International Journal of Innovative Technology and Interdisciplinary Sciences, 3(4): 501-512. https://doi.org/10.15157/IJITIS.2020.3.4.501-512
[10] Bidaj, F., Alushaj, R., Prifti, L., Chittum, A. (2015). Evaluation of the heating share of household electricity consumption using statistical analysis: A case study of Tirana, Albania. International Journal of Sustainable Energy Planning and Management, 5: 3-14. https://doi.org/10.5278/ijsepm.2015.5.2
[11] Sovacool, B.K., Mukherjee, I. (2011). Conceptualizing and measuring energy security: A synthesized approach. Energy, 36(8): 5343-5355. https://doi.org/10.1016/j.energy.2011.06.043
[12] Azzuni, A., Breyer, C. (2018). Definitions and dimensions of energy security: A literature review. Wiley Interdisciplinary Reviews: Energy and Environment, 7(1): e268. https://doi.org/10.1002/wene.268
[13] Azzuni, A., Breyer, C. (2020). Global energy security index and its application on national level. Energies, 13(10): 2502. https://doi.org/10.3390/en13102502
[14] Tsoutsos, T., Tournaki, S., Karteris, M., Agoris, D. (2013). Nearly zero energy buildings application in Mediterranean hotels. Energy and Buildings, 60: 234-244. https://doi.org/10.1016/j.enbuild.2013.03.031
[15] López-Ochoa, L.M., Las-Heras-Casas, J., López-González, L.M., Olasolo-Alonso, P. (2019). Towards nearly zero-energy buildings in Mediterranean countries: Energy performance of buildings directive evolution and the energy rehabilitation challenge in the Spanish residential sector. Energy, 176: 335-352. https://doi.org/10.1016/j.energy.2019.03.122
[16] Gatt, D., Caruana, C., Yousif, C. (2020). Building energy renovation and smart integration of renewables in a social housing block toward nearly-zero energy status. Frontiers in Energy Research, 8: 560892. https://doi.org/10.3389/fenrg.2020.560892
[17] Malka, L., Kuriqi, A., Haxhimusa, A. (2022). Optimum insulation thickness design of exterior walls and overhauling cost to enhance the energy efficiency of Albanian’s buildings stock. Journal of Cleaner Production, 381(Part 1): 135160. https://doi.org/10.1016/j.jclepro.2022.135160
[18] Dervishi, R., Cenaj, E., Malka, L. (2024). An approach to multivariable regression analysis of a rooftop PV system in households’ sector in Tirana: A novel approach using energy modeling tool. WSEAS Transactions on Environment and Development, 20: 530-545. https://doi.org/10.37394/232015.2024.20.52
[19] Institute of Statistics (INSTAT). (2024). Balance of electric power, 2024. https://www.instat.gov.al/en/themes/environment-and-energy/energy/publication/2024/balance-of-electric-power-2024/.
[20] Wood, S.N. (2017). Generalized Additive Models: An Introduction with R (2nd ed.). CRC Press. https://doi.org/10.1201/9781315370279
[21] Muggeo, V.M.R. (2003). Estimating regression models with unknown break-points. Statistics in Medicine, 22(19): 3055-3071. https://doi.org/10.1002/sim.1545
[22] Muggeo, V.M.R. (2008). Segmented: An R package to fit regression models with broken-line relationships. R News, 8(1): 20-25. https://journal.r-project.org/articles/RN-2008-004.
[23] Ang, B.W., Choong, W.L., Ng, T.S. (2015). Energy security: Definitions, dimensions and indexes. Renewable and Sustainable Energy Reviews, 42: 1077-1093. https://doi.org/10.1016/j.rser.2014.10.064
[24] Dranka, G.G., Ferreira, P., Vaz, A.I.F. (2022). Co-benefits between energy efficiency and demand-response on renewable-based energy systems. Renewable and Sustainable Energy Reviews, 169: 112936. https://doi.org/10.1016/j.rser.2022.112936
[25] The R Core Team. (2016). R: A language and environment for statistical computing. R Foundation for Statistical Computing, Vienna, Austria. https://cran.r-project.org/doc/manuals/r-release/fullrefman.pdf.
[26] Wickham, H. (2016). Data analysis. In Ggplot2: Elegant Graphics for Data Analysis, pp. 189-201. https://doi.org/10.1007/978-3-319-24277-4_9
[27] Wickham, H., Averick, M., Bryan, J., Chang, W., et al. (2019). Welcome to the Tidyverse. Journal of Open Source Software, 4(43): 1686. https://doi.org/10.21105/joss.01686
[28] Kutner, M.H., Nachtsheim, C.J., Neter, J., Li, W. (2005). Applied Linear Statistical Models (Fifth edition). http://thuvienso.thanglong.edu.vn//handle/TLU/12233.
[29] Joint Research Centre. (2008). Handbook on Constructing Composite Indicators: Methodology and User Guide. OECD Publishing. https://doi.org/10.1787/9789264043466-en
[30] Saltelli, A., Ratto, M., Andres, T., Campolongo, F., Cariboni, J., Gatelli, D., Saisana, M., Tarantola, S. (2008). Global Sensitivity Analysis. The Primer. John Wiley & Sons, Ltd. https://doi.org/10.1002/9780470725184
[31] Sadovskaia, K., Bogdanov, D., Honkapuro, S., Breyer, C. (2019). Power transmission and distribution losses – A model based on available empirical data and future trends for all countries globally. International Journal of Electrical Power & Energy Systems, 107: 98-109. https://doi.org/10.1016/j.ijepes.2018.11.012
[32] Viegas, J.L., Esteves, P.R., Melício, R., Mendes, V.M.F., Vieira, S.M. (2017). Solutions for detection of non-technical losses in the electricity grid: A review. Renewable and Sustainable Energy Reviews, 80: 1256-1268. https://doi.org/10.1016/j.rser.2017.05.193
[33] Attia, S., Eleftheriou, P., Xeni, F., Morlot, R., et al. (2017). Overview and future challenges of nearly zero energy buildings (nZEB) design in Southern Europe. Energy and Buildings, 155: 439-458. https://doi.org/10.1016/j.enbuild.2017.09.043
[34] Zangheri, P., Armani, R., Pietrobon, M., Pagliano, L. (2018). Identification of cost-optimal and NZEB refurbishment levels for representative climates and building typologies across Europe. Energy Efficiency, 11: 337-369. https://doi.org/10.1007/s12053-017-9566-8
[35] López-Ochoa, L.M., Las-Heras-Casas, J., Olasolo-Alonso, P., López-González, L.M. (2021). Towards nearly zero-energy buildings in Mediterranean countries: Fifteen years of implementing the energy performance of buildings directive in Spain (2006-2020). Journal of Building Engineering, 44: 102962. https://doi.org/10.1016/j.jobe.2021.102962
[36] Ibrahim, H.S.S., Khan, A.Z., Mahar, W.A., Attia, S., Serag, Y. (2021). Assessment of passive retrofitting scenarios in heritage residential buildings in hot, dry climates. Energies, 14(11): 3359. https://doi.org/10.3390/en14113359
[37] Magrini, A., Lentini, G., Cuman, S., Bodrato, A., Marenco, L. (2020). From nearly zero energy buildings (NZEB) to positive energy buildings (PEB): The next challenge - The most recent European trends with some notes on the energy analysis of a forerunner PEB example. Developments in the Built Environment, 3: 100019. https://doi.org/10.1016/j.dibe.2020.100019
[38] Abubakar, R., Acakpovi, A., Agyare, M., Afoakwa, S. (2024). Application of classical multiplicative decomposition time series predictive model for the forecast of domestic electricity demand and supply: A Ghanaian context. Mathematical Modelling of Engineering Problems, 11(12): 3333-3347. https://doi.org/10.18280/mmep.111213