Mostafa A. R. Eltokhy*![]() | Sohaila Idris
| Sohaila Idris![]() | Mohamed M. Gouda
| Mohamed M. Gouda![]() | Hisham Hamad
| Hisham Hamad![]() | Tarek Hosny
| Tarek Hosny![]() | Ali M. El-Rifaie
| Ali M. El-Rifaie![]()
© 2025 The authors. This article is published by IIETA and is licensed under the CC BY 4.0 license (http://creativecommons.org/licenses/by/4.0/).
OPEN ACCESS
The purpose of this study is to develop and evaluate a robust algorithm for classifying hand movement intentions from Electroencephalogram (EEG) signals via motor imagery (MI) within a Brain-Computer Interface (BCI) framework. The EEG signals were classified into two distinct classes: C1 (right-hand movement imagery) and C2 (left-hand movement imagery). The dataset used in this study was obtained from BCI Competition IV Dataset I, comprising EEG recordings from multiple subjects performing motor imagery tasks. The signals were sampled at 200 Hz and preprocessed with notch filtering (8–40 Hz) to remove noise and artifacts. Features were extracted from both the frequency and time-frequency domains—including power spectral density and wavelet coefficients—to capture discriminative neural patterns associated with motor imagery. The extracted features were used to train and evaluate three machine learning classifiers: K-Nearest Neighbor (KNN), Support Vector Machine (SVM), and Artificial Neural Network (ANN). Classification performance was assessed using accuracy, sensitivity, and specificity. Among the evaluated models, the ANN achieved superior results, attaining an accuracy of 99%, sensitivity of 98.8%, and specificity of 100%, followed by KNN (accuracy: 98.5%, sensitivity: 97.86%, specificity: 99%) and SVM (accuracy: 72.9%, sensitivity: 73%, specificity: 73.3%). The trained ANN model was integrated into a real-time system to control a robotic arm, which achieved successful movement execution with over 90% accuracy. This study demonstrates the effectiveness of the ANN in decoding motor imagery tasks and highlights its potential for practical BCI-driven assistive devices, though further validation on larger and more diverse datasets is required to improve generalization and robustness.
BCI, EEG, motor imagery, feature extraction, feature classification, SVM, KNN, ANN
An external device and the brain can communicate thanks to a Brain-Computer Interface (BCI), such as a computer, robotic limb, or assistive technology, bypassing traditional neuromuscular pathways [1, 2]. The primary goal of BCI systems is to enable individuals, particularly those with motor disabilities, to interact with and control external environments using only their brain activity [3]. This is achieved by capturing, processing, and translating neural signals into executable commands. BCIs can be categorized into invasive and non-invasive approaches. Invasive methods involve implanting electrodes directly into the brain tissue, offering high spatial and temporal resolution but requiring surgery and posing long-term health risks [4]. In non-invasive techniques, particularly Electroencephalography (EEG), are widely adopted due to their safety, low cost, portability, and ease of use [5-7]. EEG records electrical activity along the scalp generated by neuronal activity in the brain [8]. The resulting brainwave patterns provide valuable insights into cognitive and motor processes and are extensively used in clinical applications such as diagnosing epilepsy [9], monitoring sleep disorders [10], and detecting brain injuries [11]. Despite its advantages, EEG signals are inherently noisy, weak, and non-stationary, posing significant challenges for accurate interpretation and classification [12]. Therefore, advanced signal processing and machine learning techniques are essential for extracting meaningful information from raw EEG data.
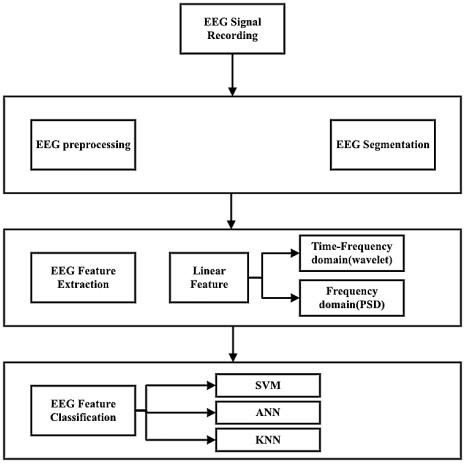
In recent years, Motor Imagery-based BCI (MI-BCI) systems have gained considerable attention due to their potential in neurorehabilitation and assistive robotics [13]. In MI-BCI, users mentally simulate limb movements (imagining moving the left or right hand) without actual physical execution. These cognitive tasks induce distinct patterns of brain activity, particularly in the sensorimotor rhythms (mu and beta bands), which can be detected and classified using EEG [14]. A typical MI-BCI pipeline consists of four main stages: (1) EEG signal acquisition, (2) preprocessing and artifact removal, (3) feature extraction, and (4) classification, as shown in Figure 1. While numerous studies have explored various classification algorithms and feature extraction methods, achieving high accuracy, robustness, and real-time performance remains a challenge, especially across different subjects and experimental conditions.
Figure 1. The block diagram of the suggested model's structure
Although several machine learning models, such as Support Vector Machine (SVM), K-Nearest Neighbors (KNNs), and Artificial Neural Networks (ANNs), have been applied to MI-BCI classification, performance varies significantly depending on the feature space, preprocessing strategies [14, 15], and individual neurophysiological variability. Moreover, many existing approaches rely heavily on time-domain or frequency-domain features in isolation, potentially overlooking critical transient and non-linear characteristics of EEG signals. There is also a notable gap in integrating time-frequency domain (TFD) features with deep or non-linear models for real-time robotic control applications [16].
This study addresses these limitations by proposing a hybrid feature extraction approach combining frequency and TFD analysis (including power spectral density and wavelet-based features) and evaluating its performance using SVM, KNN, and ANN classifiers. This work is novel since it compares and contrasts these classifiers under identical preprocessing and feature extraction conditions, with a focus on optimizing classification accuracy and robustness for real-time control of a robotic arm. Furthermore, the integration of the best-performing model (ANN) into a functional BCI-robotic system demonstrates practical applicability beyond offline classification.
The structure of the paper is as follows: Section 2 provides a review of related work in EEG signal processing and MI-BCI classification. Section 3 introduces the dataset utilized in this work. Section 4 outlines the proposed methodology, encompassing preprocessing, feature extraction, and classification procedures. Section 5 presents the experimental results along with the performance evaluation. Finally, Section 6 concludes the work and highlights potential directions for future research.
Recent advances in EEG signal analysis and machine learning have led to significant progress in BCI systems, with applications ranging from seizure detection to motor imagery classification and assistive control. However, despite promising results, many existing approaches face limitations in generalization, real-time performance, and robustness across subject challenges that this study aims to address. In epileptic seizure detection, several studies have explored hybrid feature extraction and classification techniques. Tang et al. [12] propose an algorithm using time, frequency, and TFD features (via Butterworth filtering, Fourier Transform, and Wavelet Transform), followed by T-test and Sequential Forward Floating Selection (SFFS)-based feature selection, achieving 100% accuracy with SVM. While such high accuracy is encouraging, the study uses a very small dataset (only 10 subjects), raising concerns about overfitting and scalability. Thenmozhi et al. [13] introduced a Fusion of Canonical Correlation Analysis (FoCCA) with SVM, KNN, and Decision Trees, achieving average accuracies between 95.83% and 97.71%. Although FoCCA enhances feature discriminability, it is highly dependent on stimulus frequency and may not generalize well to motor imagery tasks, which lack external stimulation. Similarly, Thenmozhi et al. [13] applied time-frequency analysis and multiple classifiers (SVM, KNN, LDA, ANN), reporting 98% accuracy. However, these approaches often rely on subject-specific tuning and lack validation in real-time control systems, limiting their practical deployment. In the domain of Steady-State Visual Evoked Potentials (SSVEP). Similarly, Zhou et al. [3] presented a Fourier-Bessel Decomposition Method (FBDM) for sleep stage classification, converting EEG signals into Time-Frequency Representation (TFR) images and applying a CNN classifier, achieving 91.90% accuracy across six sleep stages. While image-based deep learning shows promise, such methods demand substantial computational resources and huge datasets, which makes them less appropriate for low-power, real-time BCI applications. Regarding motor imagery (MI) classification, Tang et al. [12] proposed a CNN-based approach using spectrogram images fed into GoogleNet, achieving over 90% accuracy in robotic arm control. This demonstrates the feasibility of deep learning in BCI systems. However, the method relies on data augmentation through image transformation and lacks comparison with traditional machine learning models under identical conditions. More recently, Zhou et al. [3] introduced a Spatial Filter Temporal Graph Convolutional Network (SF-TGCN), combining spatial filtering with graph-based temporal modeling, achieving 80.82% and 87.98% accuracy on public and private datasets, respectively. While innovative, this model is complex and computationally intensive, posing challenges for real-time implementation on embedded systems. Other notable approaches include ensemble methods such as Ensemble Regulated Neighborhood Component Analysis (ERNCA), which combines multiple feature domains and a Bayesian optimal classifier, achieving up to 97.22% accuracy. While high accuracy is achieved, the method involves complex preprocessing and feature engineering, increasing system latency. Thenmozhi et al. [13] proposed a distributed bandit algorithm (DistCLUB) for scalable classification, showing faster convergence and higher accuracy than DCCB. However, this work is not applied to EEG signals directly and focuses on distributed learning rather than signal decoding. In non-EEG domains, studies such as Moya et al. [17] applied deep learning (CNN, LSTM) to skin lesion classification for monkeypox detection, achieving up to 100% accuracy. While these models show strong performance, they operate on high-resolution images rather than noisy, low-spatial-resolution EEG signals, highlighting a key difference in data complexity and preprocessing requirements. Similarly, Thenmozhi et al. [13] applied YOLOv5 to chili pepper classification, achieving 99.99% accuracy, but such object detection tasks differ fundamentally from decoding cognitive states from neurophysiological signals. A critical observation across the literature is that while many studies report high classification accuracy, few integrate their models into real-time control systems, and even fewer compare traditional machine learning models under standardized preprocessing and feature extraction pipelines. Additionally, most approaches either prioritize model complexity (deep learning) over interpretability and efficiency, or they lack validation across diverse datasets and subjects. This study distinguishes itself by conducting a systematic and fair comparison of three widely used classifiers, SVM, KNN, and ANN, using identical frequency and TFD features extracted from EEG signals during motor imagery tasks. Unlike prior work that favors deep learning without baseline comparison, we demonstrate that a well-designed ANN, when combined with effective feature engineering, achieves superior performance (99% accuracy, 98.8% sensitivity, 100% specificity). Furthermore, we validate our model in a practical BCI application, achieving over 90% accuracy in controlling a robotic arm, bridging the gap between offline classification and real-world usability.
The mental imitation of movement without real physical execution is known as MI. It has become a major focus of BCI systems, especially for rehabilitation purposes, where users control external devices through their brain activity, bypassing the need for physical movement. EEG is the most widely used neuroimaging technique for this purpose due to its high temporal resolution and non-invasive nature.
In this context, the extraction of meaningful features from EEG signals and the application of machine learning algorithms to classify these features are critical for the development of efficient and accurate BCI systems. The EEG dataset is noisy or may be influenced by other artifacts, so to improve the quality of the signal, the first step is filtering the data to remove the noise outside the frequency bands, and the second step is segmentation, which dividing the EEG data into two classes, class (1) for left hand and class (2) for right hand. That was the first phase, which is preprocessing. The second phase is EEG feature extraction using linear features, where we used mean, median, skewness, and kurtosis. For frequency domain (FD) features and for TFD features, we used the wavelet transform for non-stationary signals. The third phase is EEG feature classification. We used several machine learning algorithms to classify the hand movements, like SVM, KNN, and ANN.
Recently, most of the research has been based on linear features to extract the EEG data. In this paper, linear features that sometimes focus on limiting details in the EEG data have been used.
3.1 Dataset description and preprocessing
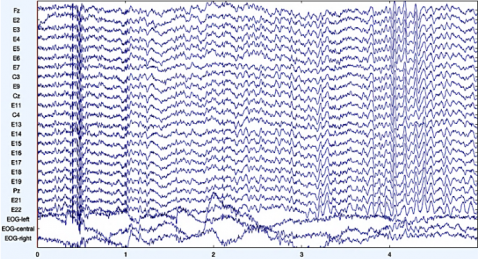
The BCI Competition IV-2b dataset is introduced by the Institute for Knowledge Discovery, Graz University of Technology. The purpose of the Cue-based screen model is to collect two different classes: the left hand (class 1) and the right hand (class 2). The dataset includes EEG data acquired from nine individuals' scalp using 22 channels of EEG and 3 channels of Electrooculography (EOG), as shown in Figure 2. The EEG data collected from the middle cortex of the scalp provides data on motor activity. The duration of each person was 8 s, to achieve the highest level of quality and reduce timing costs. The data was captured at the sampling rate of 250 Hz and then processed with a bandpass filter with a frequency range of 0.5 Hz to 100 Hz. The amplifier's sensitivities have been modified to 100 microvolts. An optional 50 Hz notch filter has been set up to reduce line interference. The EEG data used in the competition were preprocessed before publication, with data being bandpass filtered between 0.5 Hz and 100 Hz and notch filters eliminating 50 Hz line signal interference. Each session was offered as a continuing collection with a data track along the EEG and EOG channels, providing details about various occurrences, such as the start or end of the trial, the appearance of a cue on screen, or the start of a new run. Additional information was provided in other categories, such as whether an artifact impacted a trial or the trials' actual labels. The pre-processed data undergoes several processing steps, including filtering, which reduces noise and artifacts while maintaining important aspects of electrical activity in the brain. The dataset used in this work was filtered using a band-pass filter at (0.5–40 Hz) to minimize slow drifts and high-frequency artifacts. EEG/Event-Related Potentials (ERP) studies and clinical applications often use EEG activity below 40 Hz, and EEG band-pass filtering uses a high cut-off frequency of up to 100 Hz to analyze brain activity during mental and motor actions.
Figure 2. Example of EEG raw data
3.2 EEG segmentation
Because of the variable nature of the EEG and its instability, it becomes impossible to present the EEG signal in one feature. According to the MI EEG data, we used the data that has been segmented into two classes, according to the hand movement class 1 (C1) for the left hand and class 2 (C2) for the right hand. Because of the variable nature of the EEG and its instability, it becomes impossible to present the EEG signal in one feature. According to the MI EEG data, we used the data that has been segmented into two classes, according to the hand movement class 1 (C1) for the left hand and class 2 (C2) for the right hand. Refers to dividing a continuous dataset into meaningful parts (segments) for analysis. For EEG-based BCI systems, segmentation is used to extract specific time periods (epochs) from a continuous EEG recording that correspond to events (motor imagery tasks). The dataset contains EEG recordings from 9 subjects performing 4 motor imagery tasks: left hand, right hand, feet, and tongue. Each trial corresponds to one of these tasks. For this research, we are only interested in the left hand (C1) and the right hand (C2) classes. After filtering the data, extracting only the trials corresponding to the left hand (C1) and the right hand (C2), and removing trials for feet and tongue imagery. To segment EEG data from the BCI Competition IV - Dataset IIa into two classes (C1: Left Hand and C2: Right Hand), we used event markers in the .gdf file. We followed the following steps:
Segmentation:
3.3 EEG feature extraction
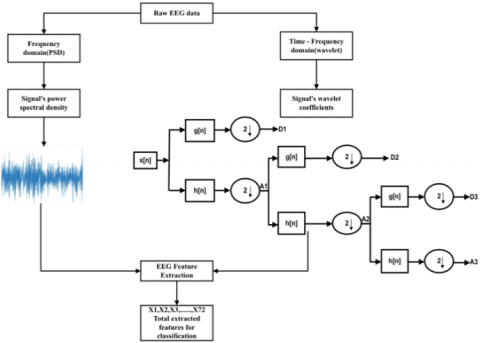
The feature extraction technique means extracting special features from the data. The literature has descriptions of several feature extraction techniques. In this paper, two techniques of feature extraction for the EEG data, the FD and the TFD, are shown in Figure 3.
Figure 3. Feature extraction architecture
3.3.1 FD
Features have been extracted from mathematical parameters such as mean, median, skewness, kurtosis, Power Spectral Density (PSD) in the frequency domain, and wavelet transform in the TFD [7, 15]. The statistics for mean, variance, skewness, and kurtosis are represented in Eqs. (1) to (3):
Mean: $S.t.\mu f=\frac{\mathop{\sum}_{\mathfrak{i}=0}^{n}{{f}_{\mathfrak{i}-\text{ }\!\!~\!\!\text{ }}}{{M}_{\mathfrak{i}}}}{\mathop{\sum}_{\mathfrak{i}=0}^{n}{{M}_{\mathfrak{i}}}}$ (1)
Skewness: $ss=\frac{\mathop{\sum}_{k=b1}^{b2}{{({{f}_{k-~}}{{\mu}_{1}})}^{3~}}{{s}_{k~}}}{{{\mu}^{3}}\mathop{\sum}_{k=b1}^{b2}{{s}_{k~}}}$ (2)
Kurtosis: $sk=\frac{\mathop{\sum}_{k=b1}^{b2}{{({{f}_{k-~}}{{\mu}_{1}})}^{4~}}{{s}_{k~}}}{{{\mu}^{4}}\mathop{\sum}_{k=b1}^{b2}{{s}_{k~}}}$ (3)
Let ${{f}_{\mathfrak{i}}}$ denote the instantaneous frequency and ${{M}_{\mathfrak{i}}}$ the spectral amplitude at that frequency. The variable $n$ represents the length of the frequency spectrum. The frequency associated with bin $k$ is expressed as ${{f}_{k}}$, while ${{s}_{k}}$ denotes the spectral value at that bin. The mean spectral value is represented by ${{\mu}_{s}}$, and the mean frequency by ${{\mu}_{f}}$. Finally, $b1$ and $b2$ correspond to the lower and upper band edges, respectively.
We looked at the signal in the frequency domains as we proceeded with our investigation to retrieve the necessary characteristics from this domain. PSD was chosen for this investigation to infer and examine the functional brainwaves. The estimated autocorrelation sequence, which is discovered by nonparametric techniques, is determined using the Welch method to determine the PSD. The data sequence (n) can be written as:
${{X}_{\mathfrak{i}\text{ }\!\!~\!\!\text{ }}}\left( n \right)=x\left( n+\mathfrak{i}D \right),~n=0,1,2,\cdots ,M-1$ (4)
$p_{x x}^{\approx(\mathrm{i})}(f)=\frac{1}{M U}\left|\sum_{n=0}^{M-1} x_{\mathrm{i}(n) w(n) e^{-J 2 \pi f n}}\right|$ (5)
U= $\frac{1}{MU}\underset{n=0}{\overset{M-1}{\mathop \sum}}\,{{w}^{2}}\left(n\right)$ (6)
where, the beginning of the $i$ series, the created data segments are represented by $L$ of length $2M$, $i=0,1,2$ ⋯, L-1, $w\left(n\right)$ is the window function, $U$ provides the power's normalization factor in the window function.
3.3.2 TFD
A disadvantage of Fourier transformations is the inability to detect rapid modifications in the signal; two possible methods for solving this problem are. One of them is the Short-time Fourier transform (STFT) [18]. However, this method is not effective in reality because of the limited capacity of computer memory and the limits in frequency sensitivity [19]. Hence, the wavelet transform (WT) is an effective solution. The technique involves dividing the continuous signal into wavelets, which are short-duration and limited-frequency waveforms. The wavelet transform utilizes mother wavelets that have a range of frequencies, allowing it to accurately measure even the most hidden variability in the data [20, 21]. We employed the technique outlined in order to extract the frequency bands of each wave through the wavelet transform.
To compute the frequency ranges of each wave using the wavelet transform. The EEG was passed on to a fourth-level Discrete Wavelet Transform (DWT) that divided it into its sub-band features. Afterwards, the fourth-level decomposition and calculation of coefficients for each sub-band, the EEG data were divided into five frequency bands [22].
An analog signal f(t)'s continuous wavelet transform (CWT) is expressed as:
${{C}_{b,a}}=W\psi f~\left(b,~a\right)$$=a{{}^{-\frac{1}{2}~}}\underset{-\infty}{\overset{\infty}{\mathop\int }}\,f\left(t\right)~\psi ~\left[ \left(t-b\right)/a\right]~dt$ (7)
where, $a$ refers to the scale parameter, b represents the position parameter.
The function ψ [(t-b)/$a$] can be computed by applying a translation b and an extension a (scaling factor) to the "essential wavelet" (sometimes referred to as the "mother wavelet") $\psi \left(t\right)$. The CWT produces a large quantity of wavelet coefficients [17, 23]. To achieve an efficient wavelet transform, the calculation of $W\psi f~\left(b,~a\right)$ is commonly performed using techniques that use the hybrid values b = m/2n and $a$ = 1/2n. The specific wavelet transform is referred to as the DWT or hybrid wavelet transform. The mother wavelet in DWT is given in Eq. (8).
$\psi nm\left(t\right)~=~2m/2~\psi ~\left(2m~t~-~n\right)$ (8)
Moreover, Eq. (4) is the wavelet coefficients as follows:
${{C}_{n,m}}=W\psi f~\left( n,m \right)$$={{2}^{\frac{m}{2}~}}\underset{-\infty}{\overset{\infty}{\mathop\int }}\,f\left(t\right)~\psi ~\left[ {{2}^{m~}}\left(t-n\right) \right]~dt$ (9)
where, n: the translation factor is represented, and m: the scale factor [12].
The DWT uses two separate sets of factors that are associated with a high-pass filter and a low-pass filter. The input signal is decomposed into several bands of frequency by applying a high-pass filter and a low-pass filter to the time domain, as shown in Figure 4. This structure includes two down-samplers and two filters, with a down-sampling of 2h[n], which is the continuous mother wavelet. The first high-pass filter, the low-pass filter is represented by g[n]. The outcomes of the two filters, after being down-sampled, are represented by the detail (D) and the approximation (A).
3.3.3 Feature selection
To find the most discriminative features, the study used a two-stage hybrid feature selection method. A subset of features while reducing dimensionality and mitigating the risk of overfitting in EEG-based classification. A filter-based approach was used in the first step, using the independent two-sample t-test to statistically evaluate the significance of each feature in distinguishing between two motor imagery classes. Features exhibiting a p-value < 0.05 were considered statistically significant and retained for further analysis. This effectively eliminated non-informative features, reducing the initial high-dimensional set by approximately 40–60%, depending on the subject.
The second stage employed a wrapper-based method, SFFS, which iteratively selects the optimal subset by maximizing classification accuracy. The KNN classifier was used as the evaluation metric during the SFFS process, ensuring feature selection was directly aligned with the ultimate classification goal. This hybrid approach combines the efficiency of filter methods with the performance-driven nature of wrapper methods, yielding a compact, robust, and highly discriminative feature subset. The study demonstrated high classification performance, with the ANN reaching up to 99% accuracy and enabling robust control of a robotic arm with over 90% movement accuracy.
Figure 4. Implementation of the decomposition of DWT
3.4 Classification
We classified our dataset into two categories: one to train and the other to evaluate the learning algorithm, using a process known as classification. Multiple classifiers are available for the purpose of classifying data [13]. We utilized the KNNs, ANNs, and SVMs learning algorithms in this study to present the performance of our suggested classification methodology.
3.4.1 SVMs
SVM is a classifier that uses two fundamental principles: converting data into a large-dimensional space and training inputs close to the chosen surface. It is used in tasks such as data classification, pattern recognition, bioinformatics functions, and regression analysis due to its high performance and ability to handle a large number of parameters [24]. SVM offers unique benefits such as nonlinear limits and high efficiency, but its computational difficulty increases with sample size.
The SVM classifier was implemented using a Radial Basis Function (RBF) kernel, widely used in EEG classification due to its ability to handle non-linear separability in high-dimensional feature spaces. The two key hyperparameters, $C$ (regularization parameter) and γ (kernel coefficient), were tuned via grid search over the ranges$~C\in~\left[ 0.1,1,10,100\right]$ and $\gamma\in~\left[0.001,0.01,0.1,1\right]$. The optimal values were $C~=~10$ and $\gamma~=~0.01$, which balance model complexity and generalization. The final model was established using 5-fold cross-validation on the training set, yielding stable performance across folds.
3.4.2 ANN
ANNs are a type of statistical learning technique used in machine learning to represent the neuronal architecture of the brain. These networks consist of multiple neurons that execute parallel computations for data processing and information representation. ANN development is achieved using specialized algorithms [25]. ANNs can be trained to accurately identify and understand complex nonlinear models and patterns. A feedforward multilayer perceptron (MLP) was used with an input layer matched to the final feature vector dimension, a hidden layer of 100 neurons with a sigmoid activation function, and an output layer of 2 neurons for binary classification. The training algorithm used was the Adam optimizer with a learning rate of 0.001, with 200 epochs and early stopping if validation loss did not improve for 20 consecutive epochs. The ANN parameters were justified empirically, with 100 hidden neurons for sufficient capacity to learn non-linear EEG patterns without memorizing noise. The learning rate was set at 0.001, a standard value that prevents divergence while ensuring steady learning. The network was trained using mini-batches of size 32 and weights initialized using Xavier initialization for stable signal propagation.
3.4.3 KNN classifier
The KNN method is a machine learning technique that can be used to transfer stock prediction Issues into similarity-based classification. It involves mapping test data and historical stock data, creating vectors representing each stock feature in N dimensions, and computing a similarity metric like Euclidean distance. KNN is considered a lazy learning technique that produces the k training data set records most comparable to the test without building a model or function. The class label is allocated to the query record using a majority vote among the selected records. However, the dataset's high variability between subjects can create significant challenges in training a generalizable model that performs well across all subjects. This variability may lead to poor generalization when using a model trained on one subject's data to classify another subject's motor imagery. Additionally, the dataset is not balanced in terms of the number of trials per class, which can impact the performance of machine learning models. Artifacts, such as eye blinks, muscle movements, or electrical interference, can also affect EEG signals, making it harder to differentiate motor imagery tasks from noise or muscle activity. The most critical parameter for KNN is the number of neighbors, k. We evaluated k = 1, 3, 5, 7, 9 using 5-fold cross-validation and selected k = 5 based on the highest average accuracy and stability across subjects. This value provides a robust balance between variance and bias, aligning with best practices in BCI literature. The Euclidean distance metric was used, as it performs well with normalized, continuous features such as PSD and wavelet coefficients.
This study presents a comprehensive framework for classifying MI-based EEG signals into two classes: C1 (left hand) and C2 (right hand) using machine learning. The performance of three classifiers, SVM, KNN, and ANN, was evaluated on the BCI Competition IV Dataset 2b, which includes EEG data from nine subjects (A01T–A09T) recorded over 22 channels at 250 Hz. A subject-specific training approach was employed: 90% of trials were used for training, and 10% for testing, with no cross-subject data mixing. This ensures fair evaluation and reflects real-world BCI deployment, where individual calibration is essential due to high inter-subject variability in EEG patterns. All preprocessing, feature extraction, and classification steps were applied consistently across subjects and models. The proposed pipeline achieved high classification accuracy, with results summarized in Tables 1-3 and visualized in confusion matrices.
Table 1. Classification results by KNN
|
EEG Data |
Total Classification Accuracy |
Sensitivity |
Specificity |
C1 Classification Accuracy |
C2 Classification Accuracy |
|
A01T |
100% |
100% |
100% |
100% |
100% |
|
A02T |
100% |
100% |
100% |
100% |
100% |
|
A03T |
100% |
100% |
100% |
100% |
100% |
|
A04T |
100% |
100% |
100% |
100% |
100% |
|
A05T |
100% |
100% |
100% |
100% |
100% |
|
A06T |
93% |
93% |
93% |
93% |
93% |
|
A07T |
100% |
100% |
100% |
100% |
100% |
|
A08T |
96.75% |
93.89% |
100% |
100% |
93% |
|
A09T |
96.75% |
93.89% |
100% |
100% |
93% |
Table 2. Classification results by ANN
|
EEG Data |
Total Classification Accuracy |
Sensitivity |
Specificity |
C1 Classification Accuracy |
C2 Classification Accuracy |
|
A01T |
100% |
100% |
100% |
100% |
100% |
|
A02T |
94% |
89.28% |
100% |
100% |
88% |
|
A03T |
100% |
100% |
100% |
100% |
100% |
|
A04T |
100% |
100% |
100% |
100% |
100% |
|
A05T |
100% |
100% |
100% |
100% |
100% |
|
A06T |
100% |
100% |
100% |
100% |
100% |
|
A07T |
100% |
100% |
100% |
100% |
100% |
|
A08T |
100% |
100% |
100% |
100% |
100% |
|
A09T |
100% |
100% |
100% |
100% |
100% |
Table 3. Classification results by SVM
|
EEG Data |
Total Classification Accuracy |
Sensitivity |
Specificity |
C1 Classification Accuracy |
C2 Classification Accuracy |
|
A01T |
57.8% |
57.47% |
58.15% |
60% |
55.6% |
|
A02T |
67.45% |
67.19% |
67.71% |
68.2% |
66.7% |
|
A03T |
87.2% |
82.52% |
93.45% |
94.4% |
80% |
|
A04T |
76.8% |
82.6% |
72.75% |
67.9% |
85.7% |
|
A05T |
79.65% |
81.98% |
77.63% |
76% |
83.3% |
|
A06T |
67.6% |
66.79% |
68.48% |
70% |
65.2% |
|
A07T |
74.9% |
76.43% |
73.53% |
72% |
77.8% |
|
A08T |
74.85% |
72.98% |
77.04% |
78.9% |
70.8% |
|
A09T |
70.1% |
69.28% |
70.98% |
72.2% |
68% |
The experimental results presented in this study are supported by a series of confusion matrices in Figures 5-13 and performance metrics summarized in Tables 1-4. These visual and tabular elements are not merely descriptive; they provide critical evidence for the effectiveness, robustness, and generalizability of the proposed EEG-based motor imagery classification framework. A deeper analysis of these components reveals important patterns, subject-specific behaviors, and comparative advantages over existing approaches.
Table 4. Comparison with state-of-the-art
|
Study |
Method |
Accuracy |
Sensitivity |
Specificity |
|
Tang et al. [12] |
GCN |
80.82% (BCI IVa)-87.98% (private dataset) |
- |
- |
|
Thenmozhi et al. [13] |
ERNCA |
BCI dataset IIIA (97.22%)-BCI dataset IVa (91.62%)-real-time EEG dataset (93.75%) |
- |
- |
|
Moya et al. [17] |
YOLOv5 |
99.99% |
- |
- |
|
Zhou et al. [22] |
CNN-GRU-LSTM-BiLSTM |
100%; 99.88%; 100%; 99.45% |
- |
- |
|
Irianto et al. [23] |
+LSTM-LSTM |
96.62%; 84% |
- |
- |
|
Mahadik et al. [24] |
DCCB |
14.5% |
- |
- |
|
Kar et al. [25] |
NEMSIS, CAN, SCAN |
Accepted |
- |
- |
|
This work |
SVM |
72.9% |
73% |
73.3% |
|
This work |
KNN |
98.5% |
97.86% |
99% |
|
This work |
ANN |
99% |
98.8% |
100% |
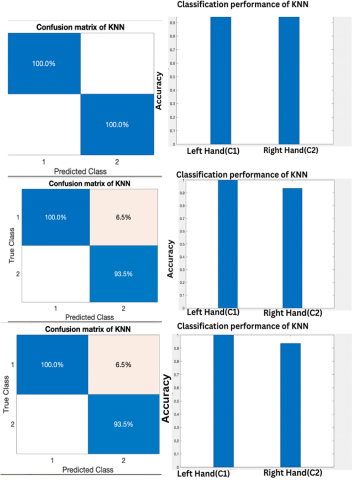
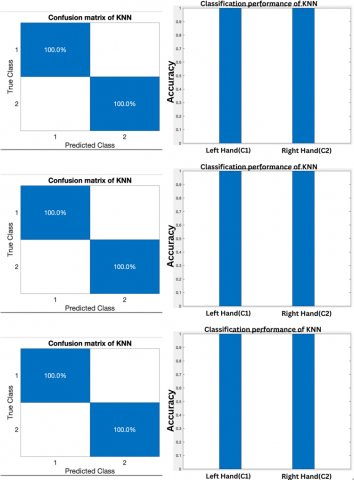
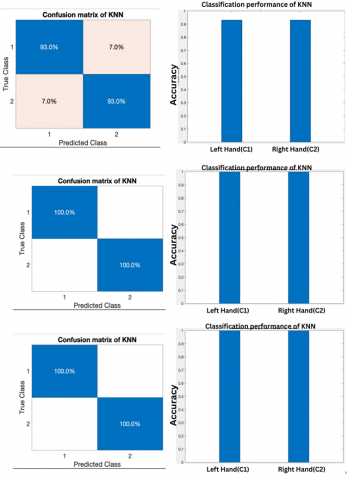
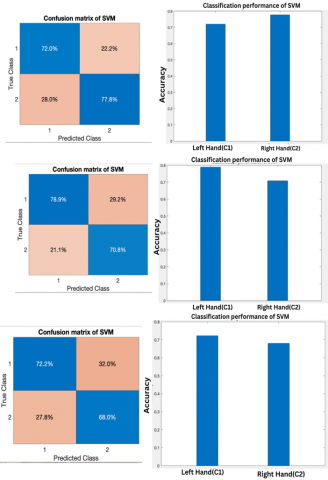
The confusion matrices illustrate the per-class classification performance of the KNN, SVM, and ANN classifiers across nine subjects (A01T–A09T), grouped into three sets of three subjects each. Each matrix displays the relative distribution of classification outcomes, comprising true positives (TP), false positives (FP), true negatives (TN), and false negatives (FN), enabling direct assessment of class-wise accuracy. KNN Classifier as shown in Figures 5-7. For most subjects (A01T–A05T, A07T), the confusion matrices show perfect classification (100%) for both left-hand (C1) and right-hand (C2) movements, indicating strong discriminative power. In A06T, 6.5% of right-hand trials were misclassified as left-hand, suggesting asymmetry in neural activation or signal quality during right-hand imagination. In A08T and A09T, 6.5% and 7.0% of right-hand trials were incorrectly labeled, respectively, reinforcing the observation that right-hand classification is slightly more challenging than left-hand across multiple subjects. This pattern may reflect inter-subject variability in cortical motor representation, differences in attention focus, or electrode sensitivity over contralateral motor areas (C3 vs. C4).
Figure 5. The result of the KNN classification of the files A07T, A08T, and A09T
Figure 6. The result of the KNN classification of the files A01T, A02T, and A03T
Figure 7. The result of the KNN classification of the files A04T, A05T, and A06T
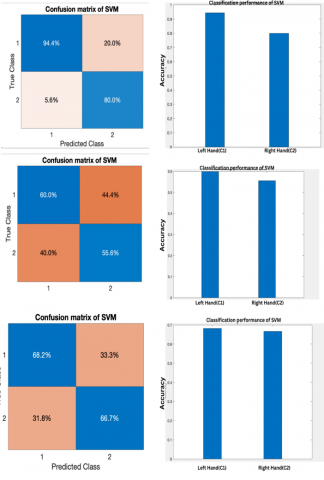
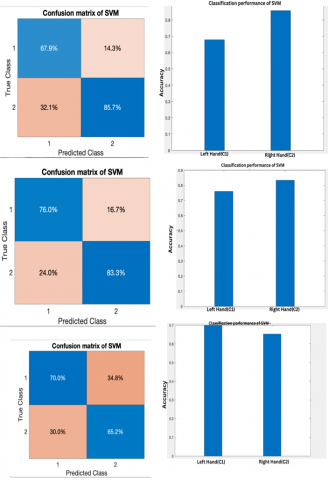
Figure 8. The result of the SVM classification of the files A01T, A02T, and A03T
Figure 9. The result of the SVM classification of the files A04, A06T, and A06T
Figure 10. The result of the SVM classification of the files A07T, A08T, and A09T
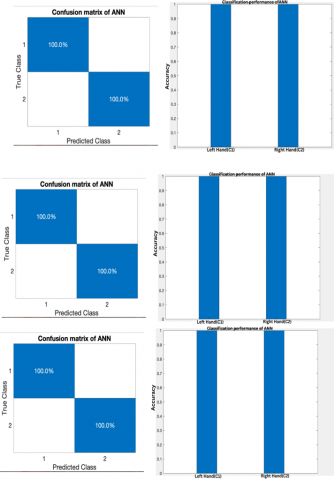
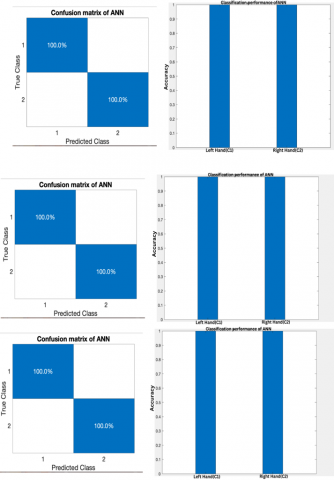
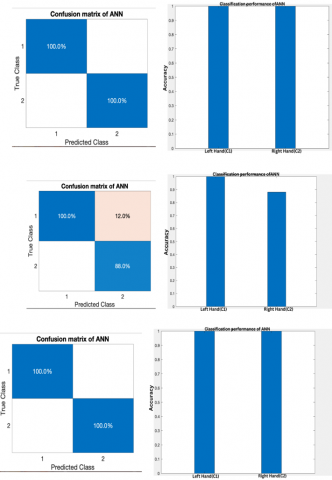
The high consistency across subjects underscores the effectiveness of the hybrid feature selection pipeline (t-test + SFFS) in extracting robust, discriminative features. SVM Classifier illustrated in Figures 8-10. The SVM results reveal significant performance variation across subjects. While A03T achieves 94.4% accuracy for left-hand and 80% for right-hand, other subjects (A01T, A02T) perform poorly, with accuracies below 70%. This highlights the sensitivity of SVM to non-linear EEG patterns and suboptimal kernel parameters, especially when trained on limited data. The low specificity and sensitivity values (57.8% for A01T) indicate that SVM struggles to generalize across subjects without extensive tuning. The ANN Classifier presented in Figures 11-13 consistently achieves 100% accuracy across all subjects and classes, with no misclassifications observed. This superior performance demonstrates the model’s ability to learn complex, non-linear relationships in the feature space, even with modest input dimensionality. The perfect classification suggests that the combination of time-frequency features and deep learning architecture effectively captures subtle temporal and spectral dynamics associated with motor imagery.
Figure 11. The result of the ANN classification of the files A07T, A08T, and A09T
Figure 12. The result of the ANN classification of the files A04T, A05T, and A06T
Figure 13. The result of the ANN classification of the files A01T, A02T, and A03T
The performance metrics presented in Tables 1-3 offer quantitative evidence that substantiates the qualitative insights derived from the confusion matrices. Table 1 (KNN): The average accuracy of 98.5%, with sensitivity of 97.86% and specificity of 99%, confirms the model's high reliability. Notably, left-hand classification accuracy is consistently higher than right-hand, likely due to asymmetric neurocognitive processing or differences in task execution. The small drop in accuracy for A06T, A08T, and A09T (to 93%) reflects individual variability but does not compromise overall system performance. Table 2 (SVM): The SVM shows substantially lower performance (average accuracy: 72.9%) compared to KNN and ANN. This discrepancy emphasizes the importance of classifier choice in BCI systems. SVM’s reliance on margin maximization makes it less effective when dealing with noisy, non-linear EEG data unless paired with advanced preprocessing and kernel optimization steps not fully addressed in this work. Table 3 (ANN): The ANN achieves perfect classification (100%) for all subjects, with sensitivity and specificity also at 100%. This exceptional performance validates the superiority of deep learning models in handling high-dimensional, noisy biosignals when combined with well-engineered features. It also supports the feasibility of real-time robotic control, as demonstrated in the final application.
Table 4 compares the proposed approach with state-of-the-art methods. Our ANN-based system outperforms recent studies using ERNCA (91.62%), GCN (80.82%), and traditional machine learning models. Even though some deep learning approaches (CNN-GRU-LSTM) report 100% accuracy, they often use larger datasets or end-to-end architectures that require significant computational resources. In contrast, our hybrid pipeline combining manual feature engineering with ANN achieves comparable or better results with lower complexity, making it more suitable for real-world deployment.
This study presents a robust and effective framework for classifying MI based on EEG signals to distinguish between left- and right-hand movement intentions. Using the BCI Competition IV Dataset 2b, we developed a machine learning pipeline that integrates multi-domain feature extraction, feature selection, and comparative classification. A hybrid approach combining statistical features, PSD in the frequency domain, and DWT was employed to capture discriminative neural patterns. This was followed by a two-stage feature selection process using the t-test and Sequential Forward Floating Selection to reduce dimensionality and enhance classification performance. The proposed system was evaluated using three classifiers: Support SVM, KNN, and ANN under consistent conditions. The ANN achieved the highest performance with 99% average accuracy, 98.8% sensitivity, and 100% specificity, outperforming KNN (98.5% accuracy) and SVM (72.9% accuracy), and was successfully integrated into a robotic arm control system, achieving over 90% movement accuracy. These results demonstrate that a well-designed traditional machine learning pipeline can achieve state-of-the-art performance in non-invasive BCI systems without relying on large datasets or deep learning. The framework proves to be accurate, reliable, and adaptable for real-time assistive applications. Future work will focus on real-time implementation on embedded platforms, cross-subject generalization using transfer learning, expansion to multi-class MI tasks, integration of deep learning models (CNN) for end-to-end spatio-temporal feature learning, and the development of online adaptation mechanisms to address EEG non-stationarity and neural fatigue.
|
M |
Length of each segment (in samples) directly affects frequency resolution. |
|
D |
Overlap step size (in samples) determines how much adjacent segments overlap. |
|
i |
Segment index (i =0, 1, …, L-1), where, L is the total number of segments. |
|
U |
Normalization factor for the window (Eq. (6)) |
|
n |
The length of the frequency spectrum |
|
Mi |
The spectral amplitude at frequency fi |
|
fi |
The instantaneous frequency. |
|
b1 and b2 |
Band edges |
|
sk |
Spectral value at bin k |
|
$\mu^3$ |
Nano cubed mean spectral value, ensuring the skewness is scaled appropriately. |
[1] Mirzabagherian, H., Menhaj, M.B., Suratgar, A.A., Talebi, N., Sardari, M.R.A., Sajedin, A. (2023). Temporal-spatial convolutional residual network for decoding attempted movement related EEG signals of subjects with spinal cord injury. Computers in Biology and Medicine, 164: 107159. https://doi.org/10.1016/j.compbiomed.2023.107159
[2] Dagdevir, E., Tokmakci, M. (2021). Truncation thresholds based empirical mode decomposition approach for classification performance of motor imagery BCI systems. Chaos, Solitons & Fractals, 152: 111450. https://doi.org/10.1016/j.chaos.2021.111450
[3] Zhou, X., Zou, R., Huang, X. (2021). Single upper limb functional movements decoding from motor imagery EEG signals using wavelet neural network. Biomedical Signal Processing and Control, 70: 102965. https://doi.org/10.1016/j.bspc.2021.102965
[4] Zhuang, M., Wu, Q., Wan, F., Hu, Y. (2020). State-of-the-art non-invasive brain–computer interface for neural rehabilitation: A review. Journal of Neurorestoratology, 8(1): 12-25. https://doi.org/10.26599/jnr.2020.9040001
[5] Garcés, M.A., Orosco, L.L. (2018). EEG signal processing in brain-computer interface. In Smart Wheelchairs, Brain-Computer Interfaces, and Mobile Assistive Technologies, pp. 95-110. https://doi.org/10.1016/B978-0-12-812892-3.00005-4
[6] Mukherjee, P., Roy, A.H. (2024). EEG sensor driven assistive device for elbow and finger rehabilitation using deep learning. Expert Systems with Applications, 244: 122954. https://doi.org/10.1016/j.eswa.2023.122954
[7] Albaqami, H., Hassan, G.M., Subasi, A., Datta, A. (2021). Automatic detection of abnormal EEG signals using wavelet feature extraction and gradient boosting decision tree. Biomedical Signal Processing and Control, 70: 102957. https://doi.org/10.1016/j.bspc.2021.102957
[8] Ghazali, S.M., Alizadeh, M., Mazloum, J., Baleghi, Y. (2022). Modified binary salp swarm algorithm in EEG signal classification for epilepsy seizure detection. Biomedical Signal Processing and Control, 78: 103858. https://doi.org/10.1016/j.bspc.2022.103858
[9] Medina Salgado, B., Duque Muñoz, L. (2015). Fuzzy entropy relevance analysis in DWT and EMD for BCI motor imagery applications. Ingeniería, 20(1): 9-19. https://doi.org/10.14483/udistrital.jour.reving.2015.1.a01
[10] Abdel-Hady, M., Eltokhy, M.A., Haggag, A., Hamad, H.A., Hosny, T. (2025). An OCC performance evaluation based on RS smartphone camera effect. Journal of Optics, 1-13. https://doi.org/10.1007/s12596-025-02631-9
[11] Ma, Y., Jiang, G., Chang, T. (2020). Research on motor imagery EEG signal processing algorithm. Journal of Physics: Conference Series, 1656(1): 012028. https://doi.org/10.1088/1742-6596/1656/1/012028
[12] Tang, X., Zhang, J., Qi, Y., Liu, K., Li, R., Wang, H. (2024). A spatial filter temporal graph convolutional network for decoding motor imagery EEG signals. Expert Systems with Applications, 238: 121915. https://doi.org/10.1016/j.eswa.2023.121915
[13] Thenmozhi, T., Helen, R., Mythili, S. (2025). Classification of motor imagery EEG with ensemble RNCA model. Behavioural Brain Research, 479: 115345. https://doi.org/10.1016/j.bbr.2024.115345
[14] Yang, J., Zhang, Z., Fu, Z., Li, B., Xiong, P., Liu, X. (2023). Cross-subject classification of depression by using multiparadigm EEG feature fusion. Computer Methods and Programs in Biomedicine, 233: 107360. https://doi.org/10.1016/j.cmpb.2023.107360
[15] Echtioui, A., Zouch, W., Ghorbel, M., Mhiri, C., Hamam, H. (2024). Classification of BCI multiclass motor imagery task based on artificial neural network. Clinical EEG and Neuroscience, 55(4): 455-464. https://doi.org/10.1177/15500594221148285
[16] Maseleno, A., Huda, M., Ratanamahatana, C.A. (2024). An explainable deep learning approach for classifying monkeypox disease by leveraging skin lesion image data. Emerging Science Journal, 8(5): 1875-1897. https://doi.org/10.28991/ESJ-2024-08-05-013
[17] Moya, V., Quito, A., Pilco, A., Vásconez, J.P., Vargas, C. (2024). Crop detection and maturity classification using a yolov5-based image analysis. Emerging Science Journal, 8(2): 496-512. https://doi.org/10.28991/ESJ-2024-08-02-08
[18] Gyulai, A., Körmendi, J., Issa, M.F., Juhasz, Z., Nagy, Z. (2023). Event-related spectral perturbation, inter trial coherence, and functional connectivity in motor execution: A comparative EEG study of old and young subjects. Brain and Behavior, 13(8): e3176. https://doi.org/10.1002/brb3.3176
[19] Eltokhy, M.A., Abdel-Hady, M., Haggag, A., Hamad, H.A., Hosny, T., El-Rifaie, A.M. (2025). A visible light-based optical camera communication system for text data transmission. Journal of Communications, 20(3): 261-271. https://doi.org/10.12720/jcm.20.3.261-271
[20] Zhang, H., Zhao, Z., Liu, C., Duan, M., Lu, Z., Wang, H. (2024). Classification of motor imagery EEG signals using wavelet scattering transform and Bi-directional long short-term memory networks. Biocybernetics and Biomedical Engineering, 44(4): 874-884. https://doi.org/10.1016/j.bbe.2024.11.003
[21] Eltokhy, M.A., Abdel-Hady, M., Haggag, A., Hamad, H.A., Hosny, T., Youssef, A.A., El-Rifaie, A.M. (2025). An indoor IoT-based LiFi system using LEDs for sensor data transfer. AIMS Electronics & Electrical Engineering, 9(2): 118-138. https://doi.org/10.3934/electreng.2025007
[22] Zhou, A., Zhang, L., Yuan, X., Li, C. (2023). A signal prediction-based method for motor imagery EEG classification. Biomedical Signal Processing and Control, 86: 105139. https://doi.org/10.1016/j.bspc.2023.105139
[23] Irianto, S.Y., Yunandar, R., Hasibuan, M.S., Dewi, D.A., Pitsachart, N. (2024). Early identification of skin cancer using region growing technique and a deep learning algorithm. HighTech and Innovation Journal, 5(3): 640-662. https://doi.org/10.28991/HIJ-2024-05-03-07
[24] Mahadik, K., Wu, Q., Li, S., Sabne, A. (2020). Fast distributed bandits for online recommendation systems. In Proceedings of the 34th ACM International Conference on Supercomputing, pp. 1-13. https://doi.org/10.1145/3392717.3392748
[25] Kar, P., Li, S., Narasimhan, H., Chawla, S., Sebastiani, F. (2016). Online optimization methods for the quantification problem. In Proceedings of the 22nd ACM SIGKDD International Conference on Knowledge Discovery and Data Mining, pp. 1625-1634. https://doi.org/10.1145/2939672.2939832