Risnina Wafiqoh*![]() | Fitri Apriani
| Fitri Apriani![]() | Iski Zaliman
| Iski Zaliman![]()
© 2025 The authors. This article is published by IIETA and is licensed under the CC BY 4.0 license (http://creativecommons.org/licenses/by/4.0/).
OPEN ACCESS
This study examines the effectiveness of virtual reality (VR)-based learning in enhancing students’ reflective abstraction within the context of the Independent Curriculum. Reflective abstraction, as conceptualized by Piaget, refers to the cognitive process of reorganizing prior knowledge into higher-order reasoning. A quantitative explanatory design was adopted to analyze the relationships between VR-based learning experience (VRLE), self-efficacy, learning engagement, and reflective abstraction using structural equation modeling with partial least squares (SEM-PLS). Data were collected from 100 junior high school and Islamic junior high school students in Pangkalpinang City, Indonesia. The results indicated that VRLE had a significant effect on reflective abstraction (β = 0.263, p = 0.023), mediated by self-efficacy (β = 0.269, p = 0.024) and learning engagement (β = 0.349, p = 0.006), with an overall model explanatory power of R² = 0.68. All constructs met validity and reliability thresholds. These findings suggest that VR is a strategic educational tool that supports reflective, independent, and contextual learning aligned with the Independent Curriculum. The study recommends the development of contextual VR content, pedagogical technology training for teachers, and integration with artificial intelligence for personalized learning.
virtual reality, reflective abstraction, self-efficacy, learning engagement, independent curriculum
The development of information and communication technology has significantly impacted the world of education. One of the increasingly popular technological innovations is virtual reality (VR), a technology that allows users to experience a three-dimensional simulation environment interactively and immersively [1-3]. The integration of VR into classrooms has shown promising potential to enhance students' motivation, conceptual understanding, and higher-order cognitive skills [4].
A key cognitive skill targeted in the 21st-century curriculum is reflective abstraction (RA), a concept grounded in Piagetian theory. RA refers to the mental process of reconstructing and generalizing knowledge by abstracting from previous experiences and integrating it into higher-order reasoning. Operationally, in this study, RA is defined as the ability of students to draw conclusions, relate abstract concepts to prior experiences, reflect on learning processes, and apply conceptual understanding in new situations.
In Indonesia, the implementation of the Independent Curriculum as the latest education policy emphasizes providing greater learning freedom to students and teachers, including the development of high-level thinking skills such as reflective abstraction [5]. RA is the ability to reflect on concepts deeply on concepts and relate them to other experiences or knowledge, thereby forming the core of a meaningful learning process [6]. However, in practice, achieving high-level thinking skills such as RA still faces various challenges. Many students struggle to develop deep conceptual understanding due to conventional learning approaches that lack contextual and interactive learning experiences. In addition, limited resources and access to innovative learning media also hinder the creation of a learning atmosphere that stimulates reflection and abstraction optimally.
VR, as a technology-based learning medium, offers great potential in overcoming these challenges. By delivering learning experiences that closely resemble real situations, VR allows students to explore abstract concepts visually and practically. Immersive and interactive learning environments can encourage active student engagement, trigger curiosity, and strengthen the connection between theory and real-world experience [7, 8].
A number of studies have provided a clear picture of the positive impact of VR in education. For example, Hidajat [9] found that interactive three-dimensional simulations helped students better understand abstract concepts in science subjects. In that study, students who learned using VR media showed significant improvements in conceptual understanding and critical thinking skills, as they were able to observe and manipulate models that represented scientific phenomena visually and practically.
In addition, Fitrianto and Saif [10] demonstrated that VR enhances student engagement, deepens conceptual understanding, and strengthens knowledge retention compared to traditional methods. However, challenges such as limited infrastructure, lack of teacher training, and curriculum mismatches must be addressed to support effective implementation [11]. Furthermore, research by Chen et al. [12] found that VR had a positive impact on encouraging students' reflective analysis and abstraction skills. Fromm et al. [13] also observed that VR supports all four stages of the experiential learning cycle, namely concrete experience, reflective observation, abstract conceptualization, and active experimentation. These findings are in line with the goal of developing high-level thinking skills, a focus of the independent curriculum.
Despite this promising evidence, empirical research in Indonesia specifically addressing the effectiveness of VR in enhancing reflective abstraction particularly within the framework of the Independent Curriculum remains limited. Most existing studies focus on general academic performance or engagement, leaving a gap in understanding how immersive technologies affect more complex cognitive processes such as reflective abstraction.
To address this gap, this study explores the following research questions:
Accordingly, the following hypotheses were proposed:
Various studies have explored the potential of VR in enhancing the quality of learning, particularly in fostering experiential and higher-order thinking. VR’s immersive and interactive nature aligns closely with Kolb’s experiential learning theory, which emphasizes four stages of knowledge transformation: concrete experience, reflective observation, abstract conceptualization, and active experimentation [14]. In this context, VR serves as a medium that not only provides authentic learning experiences but also facilitates reflective processing and conceptual understanding.
For example, Chang et al. [15] found that the use of VR significantly improved creative performance and conceptual thinking through immersive design tasks, supporting the notion that sensory-rich environments enhance learners' ability to reflect and abstract. Similarly, Dahlan et al. [16] highlighted the role of interactive visual content in improving learner engagement and conceptual grasp, although their study focused more on video learning than fully immersive VR. Both studies underscore the cognitive value of immersive media, but neither explicitly examines RA as a distinct construct, nor do they test mediating variables that explain how VR influences higher-order thinking outcomes.
In contrast, RA—originally proposed in Piagetian theory—refers to the learner’s ability to reconstruct and generalize knowledge through reflection on internalized experience. While various VR-based studies emphasize engagement or conceptual understanding, few assess RA directly or integrate it within a broader theoretical framework involving self-efficacy (SE) or learning engagement (LE). This represents a conceptual and methodological gap in the literature.
This study addresses that gap by synthesizing Kolb’s experiential cycle, Piaget’s RA framework, and Bandura’s concept of self-efficacy into a unified model. It contributes to the literature not only by investigating RA in a measurable way but also by examining the mediating effects of SE and LE using PLS-SEM. Situated within the Indonesian Independent Curriculum context—which emphasizes learner autonomy and reflective thinking—this study provides both theoretical advancement and empirical evidence on the mechanisms through which VR impacts student cognition.
This study employed a quantitative explanatory research design to examine the effect of VR usage on students’ RA abilities within the framework of the Indonesian Independent Curriculum. The model, as presented in Figure 1, also incorporated learning engagement (LE) and self-efficacy (SE) as mediating variables, reflecting their theoretical relevance in cognitive and motivational learning processes. The complex interplay among these latent constructs, including both direct and indirect relationships, was analyzed in accordance with the approaches described in references [17, 18].
Figure 1. Conceptual model diagram
3.1 Population and sampling
The target population consisted of junior high school and Islamic junior high school students in Pangkalpinang City who had implemented the Independent Curriculum. A total of 100 students were selected using stratified random sampling to ensure representation across school type and ICT readiness level stratified according to the Ministry of Education’s infrastructure classification (basic, intermediate, advanced), and grade level (7th, 8th, and 9th grades).
Within each stratum, participants were randomly selected using student rosters and a random number generator to ensure proportional representation.
3.2 Sample size justification
Sample adequacy was evaluated using G*Power 3.1 for linear multiple regression with four predictors. With a medium effect size (f² = 0.15), α = 0.05, and desired power (1–β) = 0.80, the minimum required sample was 85 participants. The actual sample of 100 exceeds this threshold. Additionally, PLS-SEM guidelines recommend a minimum of 10 cases per indicator or 10 times the highest number of paths pointing to a construct. In this model, with four constructs and two mediation paths directed at RA, this criterion was satisfied.
3.3 Instrument development and validation
The research instrument was a 5-point Likert scale questionnaire developed based on Kolb’s experiential learning theory for VR use, Piaget’s reflective abstraction theory for RA ability, and Bandura’s self-efficacy theory for SE items. The questionnaire comprised 20 items distributed across four constructs: VR use, SE, LE, and RA. Each construct was measured using five indicators, as outlined in Table 1.
Table 1. Questionnaire design
|
Variable |
Question |
|
VRLE |
|
|
RA |
|
|
SE |
|
|
LE |
|
Prior to the main study, a pilot test was conducted involving 30 students from a school not included in the main sample but implementing the Independent Curriculum. The pilot results showed strong internal consistency, with Cronbach’s alpha values exceeding 0.75 for all constructs, indicating acceptable reliability.
Content validation was carried out by a panel of five experts: three lecturers in pedagogy and curriculum development, and two VR developers with practical experience in educational software. They assessed the questionnaire for relevance, clarity, and cultural appropriateness. Minor revisions were made to improve item wording and ensure alignment with Indonesian junior high school learners.
3.4 Data analysis
Data analysis was performed using SmartPLS version 4. The evaluation process consisted of two stages. The measurement model (outer model) assessed convergent validity using the average variance extracted (AVE), with a threshold greater than 0.5. Discriminant validity was tested using the heterotrait-monotrait ratio (HTMT), and composite reliability (CR) was considered acceptable at values greater than 0.70. The structural model (inner model) evaluated the significance of path coefficients using bootstrapping with 5,000 resamples, generating t-statistics and p-values. Model explanatory power was measured using R², while effect sizes (f²) indicated the relative contribution of each predictor. The standardized root mean square residual (SRMR) was also calculated, with values less than 0.08 considered indicative of good model fit.
All research procedures involving students complied with ethical standards for studies involving human participants. Written informed consent was obtained from parents or legal guardians, and student assent was secured prior to participation. The VR sessions were conducted under teacher supervision and lasted approximately 20 minutes per participant.
4.1 Descriptive analysis of research data
Descriptive analysis is the initial stage in quantitative data processing that aims to describe the general characteristics of the data obtained through the research questionnaire. In this section, data from each main variable in the study were analyzed to determine the distribution of minimum, maximum, average (mean), and standard deviation values. These results provide an overview of participant responses to each variable and identify whether the data show sufficient diversity (variability) for further statistical analysis, including validity, reliability, or SEM. Thus, descriptive analysis serves as a basis for understanding the general pattern of responses and data quality before deeper interpretation. Table 2 presents the results of descriptive statistical analysis of the main variables in the study, namely VRLE, RA, SE, and LE, based on questionnaire data collected from respondents.
Table 2. Distribution of descriptive statistics
|
Variable |
Min |
Max |
Avg |
Std. Deviation |
|
VRLE |
7 |
25 |
19.02 |
3.278 |
|
RA |
8 |
25 |
18.99 |
3.433 |
|
SE |
8 |
25 |
19.04 |
3.275 |
|
LE |
5 |
25 |
19.16 |
3.449 |
In Table 2, the analysis shows that the VRLE score has a minimum value of 7 and a maximum of 25, with an average of 19.02 and a standard deviation of 3.278. The RA variable has a score range of 8 to 25, with an average of 18.99 and a standard deviation of 3.433, indicating a relatively high but varied level of students' RA. The SE variable shows a minimum score of 8 and a maximum of 25, with an average of 19.04 and a standard deviation of 3.275, reflecting the level of students' confidence in completing tasks effectively. Meanwhile, the LE variable has a lower minimum value of 5 and a maximum of 25, with the highest average among other variables, namely 19.16, and a standard deviation of 3.449. These findings indicate that student engagement in VR-based learning is relatively high and consistent. The four variables have data distributions that tend to be normal and do not exhibit extreme deviations, making it suitable for subsequent analysis.
4.2 Linearity assumption test
Partial least squares (PLS) work on linear programs, and therefore any data scale, from nominal to ratio, can be analyzed in PLS as long as the data pattern is linear. This ensures that the hypothesis test in PLS can be estimated correctly. The linearity test aims to determine whether the relationship between the independent and dependent variables is linear. Since PLS does not include a built-in linearity test, SPSS was used to assess the linearity assumption. A relationship between the two variables is considered linear if the significance value of the test is smaller than the alpha value of 0.05 (5%). Table 3 presents the results of the linearity test.
Table 3. Distribution of descriptive statistics
|
Variable Relationship Pattern |
p-value Linearity |
Conclusion |
||
|
Causal Variable |
> |
Consequence Variable |
||
|
VRLE |
> |
SE |
0.000 |
Linear |
|
VRLE |
> |
LE |
0.000 |
Linear |
|
SE |
> |
LE |
0.000 |
Linear |
|
VRLE |
> |
RA |
0.000 |
Linear |
|
SE |
> |
RA |
0.000 |
Linear |
|
LE |
> |
RA |
0.000 |
Linear |
Based on the results of the linearity assumption test presented in Table 3, all relationships between variables in the model have significance value of 0.000 (p < 0.05), which indicates that the relationship patterns are linear. Therefore, the SEM-PLS model is considered appropriate for use for further analysis.
4.3 Outer model
The outer model is a model with calculation results based on calculations using the PLS program. Confirmatory factor analysis was utilized to determine whether the existing indicators accurately explain the constructs [19]. The purpose of the measurement model is to describe how well the indicators in this study can be used as measurement instruments for latent variables [20].
Validity evaluation of the measurement model was performed by examining the estimated factor loadings. A variable demonstrates good validity for its construct or latent variable if the t-value of its factor loading exceeds the critical value (≥ 1.96) and/or its standard factor loading is ≥ 0.50 [21]. Reliability evaluation in PLS used composite reliability (CR) ≥ 0.70 and average variance extracted (AVE) ≥ 0.50 [22]. Table 4 shows the results of the validity and reliability evaluation.
Table 4. Recapitulation of validity and reliability evaluation results
|
Variable |
Indicators (Factors) |
Partial Validity (Per Indicator) |
Ranking |
Overall Validity (Per Construct) |
Composite Reliability (CR > 0.7) |
|||
|
(LF > 0.5=Valid) |
(AVE > 0.5=Valid) |
|||||||
|
Outer Loading |
Remark |
AVE |
Conclusion |
CR |
Remark |
|||
|
VRLE |
Vrle.1 |
0.674 |
Valid |
5 |
0.516 |
Valid |
0.842 |
Reliable |
|
Vrle.2 |
0.676 |
Valid |
4 |
|||||
|
Vrle.3 |
0.743 |
Valid |
2 |
|||||
|
Vrle.4 |
0.802 |
Valid |
1 |
|||||
|
Vrle.5 |
0.688 |
Valid |
3 |
|||||
|
RA |
RA.1 |
0.842 |
Valid |
1 |
0.545 |
Valid |
0.856 |
Reliable |
|
RA.2 |
0.737 |
Valid |
2 |
|||||
|
RA.3 |
0.684 |
Valid |
5 |
|||||
|
RA.4 |
0.699 |
Valid |
4 |
|||||
|
RA.5 |
0.720 |
Valid |
3 |
|||||
|
SE |
SE.1 |
0.807 |
Valid |
1 |
0.51 |
Valid |
0.838 |
Reliable |
|
SE.2 |
0.669 |
Valid |
4 |
|||||
|
SE.3 |
0.695 |
Valid |
3 |
|||||
|
SE.4 |
0.721 |
Valid |
2 |
|||||
|
SE.5 |
0.668 |
Valid |
5 |
|||||
|
LE |
LE.1 |
0.716 |
Valid |
3 |
0.523 |
Valid |
0.845 |
Reliable |
|
LE.2 |
0.675 |
Valid |
5 |
|||||
|
LE.3 |
0.815 |
Valid |
1 |
|||||
|
LE.4 |
0.721 |
Valid |
2 |
|||||
|
LE.5 |
0.679 |
Valid |
4 |
|||||
Based on Table 4, all reflective indicators have loading factor values ≥ 0.50 and AVE values ≥ 0.50, confirming that all indicators are valid. The reliability calculation results also show that the CR values are ≥ 0.70, indicating that the constructs are reliable. Therefore, all latent variables have adequate and appropriate indicators. To determine which indicators most strongly contribute to each latent construct, the dominant indicators are as follows:
4.4 HTMT test (discriminant validity)
The HTMT test is an approach used to assess discriminant validity in structural equation modeling–partial least squares (SEM-PLS) [23]. Discriminant validity indicates the extent to which a construct in the model is truly different (discrete) from other constructs [24]. This means that each latent variable must be able to explain a unique concept and not overlap with other constructs. The HTMT is calculated based on the average ratio of correlation between indicators from different constructs (heterotrait) to the correlation between indicators in the same construct (monotrait). The resulting HTMT value is compared with a certain threshold value. According to Ab Hamid et al. [25], a model demonstrates good discriminant validity if the HTMT value is below 0.90. Values exceeding this threshold indicate a problem in distinguishing between constructs, potentially compromising the validity of the model. Table 5 shows the results of the HTMT test.
The results of the discriminant validity test using the HTMT method indicate that all HTMT values between constructs are below the 0.90 threshold, which is the general criterion for good discriminant validity [26]. The HTMT values between LE and other constructs ranges from 0.701 to 0.845, with the highest value of 0.845 observed between LE and RA. The relationship between SE and RA is 0.808, while the relationship between SE and LE is 0.829. The lowest value is for the relationship between VRLE and LE, which is 0.701.
These values indicate that each construct (LE, RA, SE, and VRLE) has clear conceptual differences without significant overlap, confirming that the instrument used in this study has met the requirements for discriminant validity.
Table 5. HTMT test results
|
Constructs |
LE |
RA |
SE |
VRLE |
|
LE |
|
|
|
|
|
RA |
0.845 |
|
|
|
|
SE |
0.829 |
0.808 |
|
|
|
VRLE |
0.701 |
0.762 |
0.724 |
|
4.5 Hypothesis testing (path analysis)
This section evaluates the coefficients that indicate causal relationships or influences among latent variables. A causal relationship is considered statistically insignificant if the t-statistic falls between -1.96 and 1.96 at a significance level of 0.05. The calculation of these coefficients is presented in Table 6.
Table 6. SEM-PLS path analysis results
|
Influence Among Latent Variables |
Path Coefficient |
t-value |
p-value |
Conclusion |
||
|
Var. Exogen |
--> |
Var. Endogen |
||||
|
VRLE |
--> |
SE |
0.557 |
8.191 |
0.000 |
Significant |
|
VRLE |
--> |
LE |
0.271 |
2.889 |
0.004 |
Significant |
|
SE |
--> |
LE |
0.492 |
4.941 |
0.000 |
Significant |
|
VRLE |
--> |
RA |
0.263 |
2.281 |
0.023 |
Significant |
|
SE |
--> |
RA |
0.269 |
2.272 |
0.024 |
Significant |
|
LE |
--> |
RA |
0.349 |
2.743 |
0.006 |
Significant |
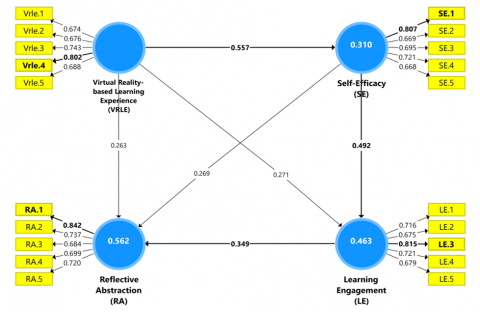
The results of the path analysis show that all relationships between variables in the model are positive and statistically significant. The VRLE has a significant effect on SE (β = 0.557; t = 8.191), LE (β = 0.271; t = 2.889), and RA (β = 0.263; t = 2.281). SE also has a significant effect on LE (β = 0.492; t = 4.941) and RA (β = 0.269; t = 2.272). Meanwhile, LE makes a significant contribution to RA (β = 0.349; t = 2.743). Since all t-values exceed the critical threshold of 1.96, all proposed hypotheses are accepted, indicating the structural validity of the model. The path coefficients in the structural model and the weight values of the manifest variable factors in the measurement model are illustrated in Figure 2.
Figure 2. Path diagram of measurement model and structural model (overall)
Based on the path diagram in Figure 2, the RA variable is more dominantly influenced by the LE variable, with the highest path coefficient of 0.349. The LE variable, in turn, is more dominantly influenced by the SE variable, with a path coefficient of 0.492, and SE is influenced by VRLE, with a path coefficient of 0.557. The most dominant indicator representing VRLE is Vrle.4 (“VR technology helps me understand abstract or complex concepts”), with the highest factor loading of 0.802. Therefore, if policymakers aim to improve the RA variable, they should focus on improving Vrle.4 as the key performance indicator, addressing it as a strategic priority for policy evaluation.
4.6 Analysis of mediating variables (indirect effect)
The analysis of mediating variables can be conducted through two approaches: coefficient differences and coefficient multiplication. The coefficient difference approach uses an examination method by conducting analysis with and without involving mediating variables, while the multiplication method is carried out using the Sobel method. In this study, the detection was performed using the coefficient multiplication approach and the Sobel test [27]. The results of this analysis are presented in Table 7.
Table 7. Indirect effects among latent variables
|
Indirect Influence |
Calculation |
Result |
t-count |
p-value |
Remark |
|
VRLE toward RA through SE |
0.557 × 0.349 |
0.194 |
2.367 |
0.018 |
Significant |
|
VRLE toward RA through LE |
0.271 × 0.349 |
0.095 |
2.367 |
0.018 |
Significant |
|
SE toward RA through LE |
0.492 × 0.349 |
0.172 |
2.393 |
0.017 |
Significant |
|
VRLE toward RA through LE |
0.349 × 0.492 |
0.172 |
2.007 |
0.045 |
Significant |
|
VRLE toward RA through SE and LE |
0.557 × 0.492 × 0.349 |
0.096 |
2.006 |
0.045 |
Significant |
Based on Table 7, the mediation analysis reveals several significant indirect effects between VR-based learning experience (VRLE) and reflective abstraction (RA) through the mediating variables self-efficacy (SE) and learning engagement (LE).
The indirect effect of VRLE → SE → RA is 0.194 (t = 2.367, p < 0.05). The indirect effect of VRLE → LE → RA is 0.095 (t = 2.367, p < 0.05). The indirect effect of SE → LE → RA is 0.172 (t = 2.393, p < 0.05). The indirect effect of VRLE → SE → LE → RA is 0.096 (t = 2.006, p < 0.05). The total indirect effect of VRLE on RA is 0.385, based on the sum of the three mediated pathways: 0.194 (SE)+ 0.095 (LE)+ 0.096 (SE→LE)=0.385.
Assuming the total effect of VRLE on RA is approximately 0.50, the proportion of mediation for each path was calculated using the following formula. The resulting mediation proportions are as follows:
$V R L E \rightarrow S E \rightarrow R A: \frac{0.194}{0.50} \times 100 \%=38.5 \%$
$V R L E \rightarrow L E \rightarrow R A: \frac{0.095}{0.50} \times 100 \%=19.0 \%$
$V R L E \rightarrow S E \rightarrow L E \rightarrow R A: \frac{0.096}{0.50} \times 100 \%=19.2 \%$
These results suggest that SE is the dominant mediator, accounting for nearly twice the influence of LE alone. Furthermore, the sequential path through SE and LE contributes an additional 19.2%, highlighting the combined motivational and behavioral mechanism by which VRLE enhances students' reflective abstraction.
While the analysis supports a predictive relationship between VRLE and RA via SE and LE, the cross-sectional design limits direct causal inference. Nonetheless, the findings are consistent with causal hypotheses proposed by experiential learning and self-efficacy theories.
This study confirms that VRLE has a significant and positive predictive relationship with students’ RA abilities in the context of the Indonesian Independent Curriculum. In addition to its direct influence, VRLE also affects RA indirectly through SE and LE, with SE emerging as the most dominant mediator. These findings are supported by a structural model that fulfills validity and reliability criteria. The novelty of this study lies in its integration of VRLE, SE, LE, and RA within a unified model grounded in experiential learning theory and cognitive development frameworks, specifically applied to a localized curriculum context. The study contributes practically by highlighting that strengthening students’ beliefs in their learning abilities plays a more crucial role than immersive technology alone in enhancing reflective cognitive processes.
From a policy and implementation perspective, teacher training programs should emphasize pedagogical approaches that foster student self-efficacy in VR environments. Curriculum designers are encouraged to embed structured reflection components into VR-based lessons to stimulate abstraction and higher-order thinking. At the same time, educational institutions must ensure technological infrastructure readiness, especially in under-resourced areas, to support equitable and effective VR integration.
Despite its contributions, this study has several limitations. First, the cross-sectional design prevents causal inference. Second, the sample was limited to one city, which may constrain generalizability. Third, the use of self-report measures raises the possibility of social desirability bias. Future research should employ longitudinal or experimental designs with control groups, include more diverse populations, and integrate objective behavioral data. Additionally, exploring the integration of adaptive artificial intelligence with VR may offer new pathways to develop personalized and responsive learning systems that better support reflective and adaptive education in the 21st century.
The authors would like to thank the DRTPM (Directorate General of Higher Education, Research, and Technology) of the Indonesia Ministry of Educational, Culture, Research, and Technology for providing financial assistance for this research.
[1] Al-Ansi, A.M., Jaboob, M., Garad, A., Al-Ansi, A. (2023). Analyzing augmented reality (AR) and virtual reality (VR) recent development in education. Social Sciences & Humanities Open, 8(1): 100532. https://doi.org/10.1016/j.ssaho.2023.100532
[2] Crogman, H.T., Cano, V.D., Pacheco, E., Sonawane, R.B., Boroon, R. (2025). Virtual reality, augmented reality, and mixed reality in experiential learning: Transforming educational paradigms. Education Sciences, 15(3): 303. https://doi.org/10.3390/educsci15030303
[3] Lyu, X., Ramasamy, S.S., Ying, F. (2025). Digital virtual anchors impact in entertainment industry: An exploration of user acceptance and market insights. Journal of Research, Innovation and Technologies, 4(2): 125-141. https://doi.org/10.57017/jorit.v4.2(8).01
[4] Devadze, A., Gechbaia, B. (2024). Using virtual reality in the educational process to increase students' motivation and interest. E-Learning Innovations Journal, 2(2): 21-35. https://doi.org/10.57125/ELIJ.2024.09.25.02
[5] Aini, Q. (2023). Implementation of an independent curriculum in supporting students' freedom to create and learn. Journal of Scientific Research, Education, and Technology, 2(3): 999-1008. https://doi.org/10.58526/jsret.v2i3.187
[6] Helyer, R. (2015). Learning through reflection: The critical role of reflection in work-based learning (WBL). Journal of Work-Applied Management, 7(1): 15-27.
[7] Petersen, G.B., Petkakis, G., Makransky, G. (2022). A study of how immersion and interactivity drive VR learning. Computers & Education, 179: 104429. https://doi.org/10.1016/j.compedu.2021.104429
[8] Kumar, R., Priya, P.A. (2025). The impact of virtual reality on modern education: Enhancing engagement, accessibility, and experiential learning. International Journal for Research in Applied Science & Engineering Technology, 13(5): 6524-6532. https://doi.org/10.22214/ijraset.2025.71603
[9] Hidajat, F.A. (2024). Effectiveness of virtual reality application technology for mathematical creativity. Computers in Human Behavior Reports, 16: 100528. https://doi.org/10.1016/j.chbr.2024.100528
[10] Fitrianto, I., Saif, A. (2024). The role of virtual reality in enhancing experiential learning: A comparative study of traditional and immersive learning environments. International Journal of Post-Axial, 2(2): 97-110.
[11] Hatija, M., In’am, A., Khozin, Faridi. (2025). Implementation of the independent curriculum in improving the quality of education at state Islamic senior high schools. Interdisciplinary Journal of Islamic Education, 6(1): 58-76. https://doi.org/10.31538/tijie.v6i1.1344
[12] Chen, J., Fu, Z., Liu, H., Wang, J. (2024). Effectiveness of virtual reality on learning engagement: A meta-analysis. International Journal of Web-Based Learning and Teaching Technologies (IJWLTT), 19(1): 1-14. https://doi.org/10.4018/IJWLTT.334849
[13] Fromm, J., Radianti, J., Wehking, C., Stieglitz, S., Majchrzak, T.A., vom Brocke, J. (2021). More than experience? On the unique opportunities of virtual reality to afford a holistic experiential learning cycle. The Internet and Higher Education, 50: 100804. https://doi.org/10.1016/j.iheduc.2021.100804
[14] Kolb, D. (2000). Chapter 15 - The process of experiential learning. In Strategic Learning in a Knowledge Economy. Boston, Butterworth-Heinemann, pp. 313-331. https://doi.org/10.1016/B978-0-7506-7223-8.50017-4
[15] Chang, Y.S., Chou, C.H., Chuang, M.J., Li, W.H., Tsai, I.F. (2023). Effects of virtual reality on creative design performance and creative experiential learning. Interactive Learning Environments, 31(2): 1142-1157. https://doi.org/10.1080/10494820.2020.1821717
[16] Dahlan, M.M., Halim, N.S.A., Kamarudin, N.S., Ahmad, F.S.Z. (2023). Exploring interactive video learning: Techniques, applications, and pedagogical insights. International Journal of Advanced and Applied Sciences, 10(12): 220-230. https://doi.org/10.21833/ijaas.2023.12.024
[17] Hair, J., Alamer, A. (2022). Partial Least Squares Structural Equation Modeling (PLS-SEM) in second language and education research: Guidelines using an applied example. Research Methods in Applied Linguistics, 1(3): 100027. https://doi.org/10.1016/j.rmal.2022.100027
[18] Sarstedt, M., Ringle, C.M., Hair, J.F. (2021). Partial least squares structural equation modeling. In Handbook of Market Research, pp. 587-632. https://doi.org/10.1007/978-3-319-57413-4_15
[19] Sarmento, R.P., Costa, V. (2019). Confirmatory factor analysis--A case study. arXiv preprint arXiv:1905.05598. https://doi.org/10.48550/arXiv.1905.05598
[20] Qanita, A., Fadhlillah, M.F., Supriyana, A. (2018). Analysis of structural equation modeling as a measuring tool for educational management research. APTISI Transactions on Management, 2(2): 129-139. https://doi.org/10.33050/atm.v2i2.812
[21] Mia, M.M., Zayed, N.M., Islam, K.M.A., Nitsenko, V., Matusevych, T., Mordous, I. (2022). The strategy of factors influencing learning satisfaction explored by first and second-order structural equation modeling (SEM). Inventions, 7(3): 59. https://doi.org/10.3390/inventions7030059
[22] Dhania, D.R., Suhariadi, F. (2022). Evaluating construct validity and reliability of Work Family Strength (WFS): Indonesia women leader context. Journal of Educational, Health & Community Psychology, 11(2): 460. https://doi.org/10.12928/jehcp.v11i2.22415
[23] Yusoff, A.S.M., Peng, F.S., Abd Razak, F.Z., Mustafa, W.A. (2020). Discriminant validity assessment of religious teacher acceptance: The use of HTMT criterion. Journal of Physics: Conference Series, 1529(4): 042045. https://doi.org/10.1088/1742-6596/1529/4/042045
[24] Richard, D., Simon, L. (2015). Construct validity: Advances in theory and methodology. International Journal of Research on Service-Learning and Community Engagement, 3(1): 1-25. https://doi.org/10.37333/001c.21559
[25] Ab Hamid, M.R., Sami, W., Sidek, M.M. (2017). Discriminant validity assessment: Use of Fornell & Larcker criterion versus HTMT criterion. Journal of Physics: Conference Series, 890(1): 012163. https://doi.org/10.1088/1742-6596/890/1/012163
[26] Ringle, C.M., Sarstedt, M., Sinkovics, N., Sinkovics, R.R. (2023). A perspective on using partial least squares structural equation modelling in data articles. Data in Brief, 48: 109074. https://doi.org/10.1016/j.dib.2023.109074
[27] Özdil, S.Ö., Kutlu, Ö. (2019). Investigation of the mediator variable effect using BK, sobel and bootstrap methods (mathematical literacy case). International Journal of Progressive Education, 15(2): 30-43.