Manuel Soares Dos Reis Pacheco*![]() | Hadiyanto Hadiyanto
| Hadiyanto Hadiyanto![]() | Ridwan Sanjaya
| Ridwan Sanjaya![]()
© 2025 The authors. This article is published by IIETA and is licensed under the CC BY 4.0 license (http://creativecommons.org/licenses/by/4.0/).
OPEN ACCESS
The quality of nutmeg seeds significantly influences their commercial value and applicability in food and pharmaceutical products. This study investigates the performance of three convolutional neural network (CNN) architectures, LeNet-5, AlexNet, and VGGNet, for classifying nutmeg seed quality using a dataset comprising 200 labeled images. Experiments were conducted using two data partitioning schemes (80:20 and 90:10), and the models were evaluated based on classification accuracy, training loss, and processing efficiency, defined as the total training time required per epoch. The results indicate that VGGNet achieved the highest classification accuracy (88.3% on the test set), although it required the longest training time (718,229.12 seconds for 50 epochs), due to its deep architecture and the absence of GPU acceleration during training. LeNet-5 demonstrated the shortest processing time (1,902.81 seconds) and achieved 85.2% accuracy, indicating its suitability for deployment in resource-constrained environments. AlexNet produced a balanced result with moderate accuracy (86.5%) and training duration. These findings emphasize the trade-off between model complexity and computational cost, suggesting that model selection should be tailored to available resources and application-specific requirements.
nutmeg, CNN, quality assessment, classification, LeNet-5, AlexNet, VGGNet
Nutmeg (Myristica fragrans) is a spice with significant economic value in both domestic and international markets. Due to its active compounds, which offer numerous benefits, nutmeg is utilized across various industries, including food and beverages, cosmetics, and pharmaceuticals [1]. Consequently, the quality of nutmeg seeds significantly impacts the quality of derivative products and their competitiveness in the global market [2]. However, the assessment of nutmeg seed quality is often conducted manually, requiring special expertise and being susceptible to inaccuracy due to human subjectivity. The process typically involves visual inspection to determine characteristics such as size, color, physical damage, and the level of ripeness [3].
With the advancement of artificial intelligence (AI), particularly in deep learning, numerous new solutions can be implemented to enhance or replace the process of assessing the quality of agricultural products [4, 5]. One promising approach is utilizing the convolutional neural network (CNN), an artificial neural network architecture that has proven effective in image processing and pattern recognition tasks [6, 7]. CNNs have been extensively utilized in various image processing applications across fields such as medicine, automotive, and agriculture, particularly in object classification based on images [8-10]. These networks extract important features from images through convolutional layers, enabling the model to understand visual patterns effectively [11]. In the context of assessing nutmeg seed quality, CNNs can analyze images to identify characteristics indicative of quality, such as damage, shape, or size, that may be difficult for the human eye to detect.
Research on detecting the quality of nutmeg seeds and other agricultural products has produced various quantitative findings supporting the effectiveness of deep learning and image processing methods. For instance, Subhan and Basri [12] used Faster R-CNN to classify nutmeg fruit quality, achieving an accuracy of 91.2%. Margendy Bogar et al. [13] highlighted the development of an application for classifying nutmeg seed images based on shell color using the CNN method, resulting in an accuracy level of 82%. Qisthi and Siswono [14] created a CNN model for classifying nutmeg seed maturity with an accuracy of 97.92%.
Although CNNs have proven effective, a significant gap remains: the absence of systematic comparisons between different CNN architectures for nutmeg seed quality assessment. Previous research has mainly focused on model implementation rather than model selection, with limited attention to balancing classification performance and computational efficiency. This gap is particularly relevant in real-world applications, where the deployment of deep learning models often requires consideration of resource constraints, such as limited processing power, memory, or training time. To address this issue, a structured comparative analysis of CNN architectures is essential to identify which models offer the best trade-off between performance and efficiency in this specific context.
The CNN models analyzed for nutmeg seed quality classification in this study include LeNet-5, AlexNet, and VGGNet. This comparison considers several key variables, including model accuracy, which is measured through accuracy and F1-score. Additionally, the number of parameters is also evaluated as it reflects model complexity; more parameters generally imply greater computational requirements [15]. Training time and inference time are measured to evaluate efficiency in processing data, especially in real-time implementations. Furthermore, computational efficiency, encompassing FLOPs and memory usage, determines how well the model can be applied to devices with limited resources.
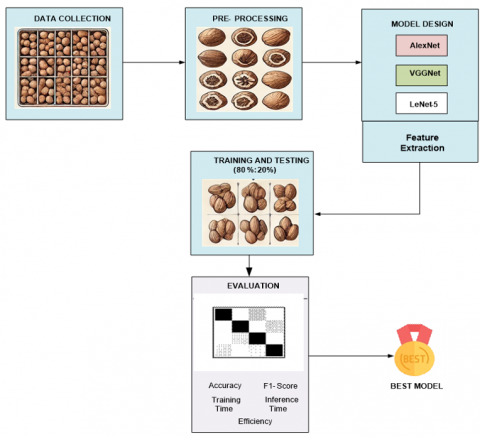
This study employed an experimental method to compare the performance of LeNet-5, AlexNet, and VGGNet models in the classification of image-based nutmeg seed quality. The stages began with data collection and preprocessing, which included resizing, normalization, data augmentation, and filtering to enhance input quality. During the model design stage, the three CNN architectures were implemented with adjusted hyperparameters such as learning rate, batch size, and optimizer. Subsequently, training and testing were conducted, with the dataset divided into training, validation, and testing sets to assess model performance. Evaluation was performed using metrics such as accuracy, precision, recall, F1-score, and loss function to determine the optimal model for classifying nutmeg seed quality. Figure 1 illustrates the flowchart of the proposed framework stages.
Figure 1. Proposed framework stages flowchart
2.1 Data collection
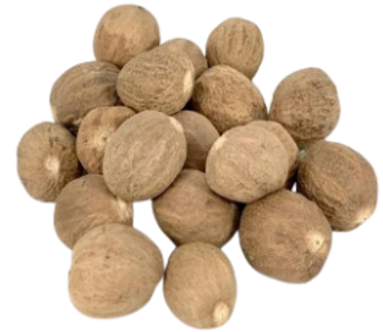
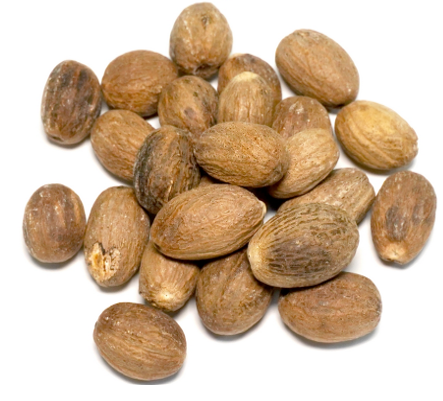
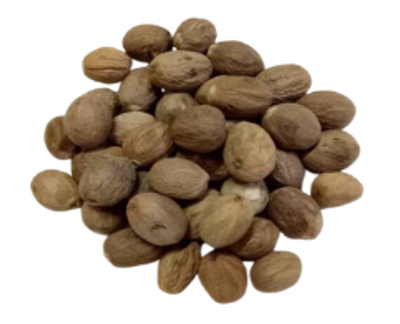
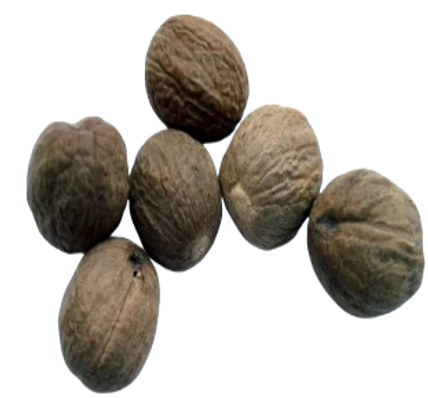
At this stage, nutmeg seed images were collected using a high-resolution Canon EOS 5D camera to ensure that texture, shape, and color details were accurately recorded. The dataset consisted of 200 nutmeg seed images categorized according to the SNI 01-0006-1993 standard. The categories included 50 calibrated nutmeg (CN) images, 50 ABCD average nutmeg images, 50 shriveled (rimpel) nutmeg images, and 50 BWP nutmeg images. Table 1 presents a sample of the nutmeg seed image dataset.
Table 1. Nutmeg seed image dataset sample
| Image | Category |
|
Calibrated Nutmeg (CN) |
|
|
ABCD Average |
|
|
Shriveled |
|
|
BWP |
2.2 Preprocessing
The data preprocessing stage aimed to optimize image quality for the CNN model training process [16, 17]. In this study, the process involved resizing or adjusting each image to meet the input standards of the respective CNN architectures: LeNet-5 (32 × 32 pixels), AlexNet (227 × 227 pixels), and VGGNet (224 × 224 pixels). All images were converted to dimensions compatible with the model architecture, ensuring consistency during training. After resizing, image normalization was performed, scaling pixel values from their original range of 0-255 to a normalized to range of either 0–1 or -1 to 1. This step accelerated model convergence during training and prevented large pixel values from dominating network weights. Furthermore, data augmentation was applied to increase dataset variation and mitigate overfitting. Augmentation techniques included rotation (10-30 degrees) to vary image orientation, flipping (horizontal or vertical) to simulate different viewing angles, zooming and cropping to enable the model to capture the details of the nutmeg seeds better, and adjusting contrast and lighting to enhance the model's adaptability to changing lighting conditions.
2.3 Model design
At this stage, three CNN models (LeNet-5, AlexNet, and VGGNet) were configured according to their respective basic architectures. These models were subsequently implemented using various deep learning libraries, such as TensorFlow and PyTorch. Key hyperparameters tuned during training included the learning rate, which controls the learning speed of the model; the batch size, which determines the number of samples in one training iteration; and the optimizer, for which Adam was selected based on performance suitability with the dataset.
2.4 Training and testing
At this stage, the model was trained using a dataset featuring two testing scenarios: a ratio of 80:20 and 90:10. To ensure proportional representation of each nutmeg quality category, stratified sampling was employed during data splitting. During the training process, the Adam optimizer and the ReLU activation function were employed to accelerate convergence [18, 19].
2.5 Classification
The classification stage involved grouping nutmeg seed quality based on images using the LeNet-5, AlexNet, and VGGNet models. The CNN model automatically extracted important features from images, such as texture, color, pattern, and shape, through convolution and pooling layers designed to identify unique characteristics of each category [20, 21]. Once feature extraction was complete, the results were processed by the fully connected layer, which acted as a classifier to determine the nutmeg seed category based on the probability output, where the class with the highest probability was selected as the final prediction. This study classified nutmeg seeds into four quality categories: calibrated nutmeg (CN), ABCD average, shriveled, and BWP. The model was tested using test data to evaluate the classification results, and the results were analyzed using a confusion matrix to assess the distribution of correct and incorrect predictions. Additionally, metrics such as precision, recall, and F1-score were used to measure how effectively the model identified the correct class. Thus, this classification stage was crucial in determining the effectiveness of the model in automatically distinguishing nutmeg seed quality, which was expected to enhance efficiency in the quality selection process.
2.6 Evaluation
The evaluation stage was conducted to assess the performance of the trained model by comparing several key metrics [22, 23]. This evaluation aimed to identify the best model for classifying nutmeg seed quality based on images. The metrics used in the model performance analysis are defined as follows:
Accuracy measures the percentage of correct predictions from the total test data [24]. The higher the accuracy, the better the model is at classifying nutmeg seeds as a whole. Eq. (1) presents the formula for accuracy:
$Accuracy =\frac{T P+T N}{T P+T N+F P+F N}$ (1)
Precision measures the number of correct positive predictions compared to the total number of positive predictions made by the model. Eq. (2) shows the formula for precision:
$Precision=\frac{T P}{T P+F P}$ (2)
Recall measures the number of positive samples the model successfully recognizes from the total data that should be classified as positive. Eq. (3) shows the formula for Recall.
$Recall =\frac{T P}{T P+F N}$ (3)
F1-Score represents the harmonic mean of precision and recall and is used to obtain a balance between the two [25]. The equation for F1-Score is shown in Eq. (4):
$F 1- Score =2 \times \frac{ { Precision } \times { Recall }}{ { Precison }+ { Recall }}$ (4)
Loss Function measures the amount of error the model produces during training and testing. One of the loss functions commonly used in classification is categorical cross-entropy [26], which is presented in Eq. (5).
${Loss}=-\sum_{i=1}^N y i \log (\widehat{y \imath})$ (5)
where,
yi = actual label of the ith sample.
$\widehat{y l}$ = prediction probability of the model for the ith sample.
N = total number of samples.
The evaluation results were compared to identify the best model based on the balance between accuracy and computational efficiency. Models that achieved high accuracy with a lighter computational load were recommended as the optimal solution in the nutmeg seed classification automation system.
To evaluate model performance, categorical cross-entropy was used as the loss function, as it is well-suited for multi-class classification tasks such as nutmeg seed quality assessment. This loss function measured the divergence between the predicted probabilities and the actual class labels, effectively guiding the optimization of model weights during training. Given the imbalanced distribution of classes in the dataset, the reported loss values across training, validation, and testing phases provided insight into both convergence and generalization.
3.1 CNN model testing (LeNet-5, VGGNet, and AlexNet)
To test three CNN architecture models (LeNet-5, VGGNet, and AlexNet), this experiment was designed using two data-sharing scenarios, as shown in Table 1. Each model was evaluated under different scenarios to assess the impact of the training and validation data ratio on the performance of nutmeg seed quality classification.
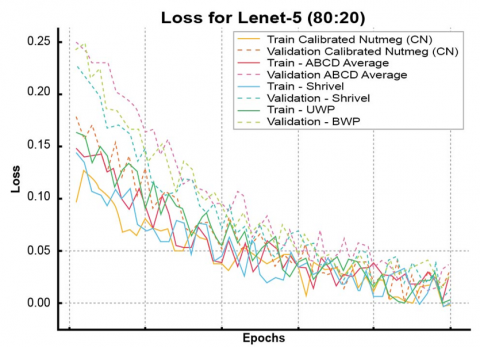
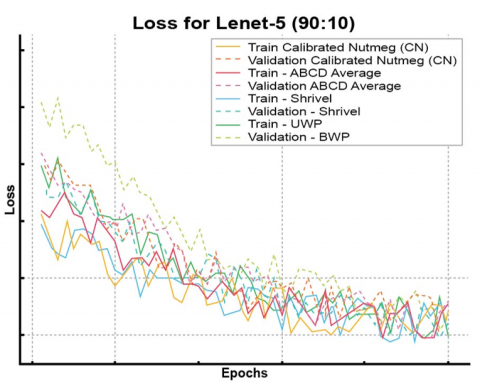
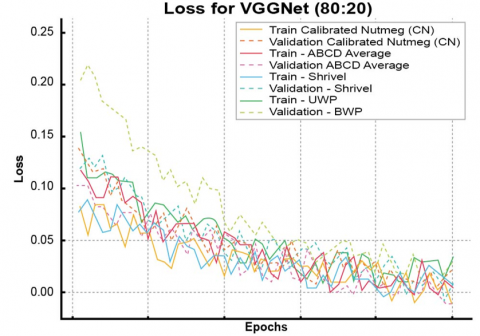
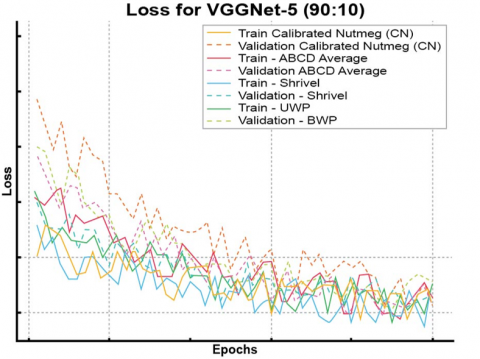
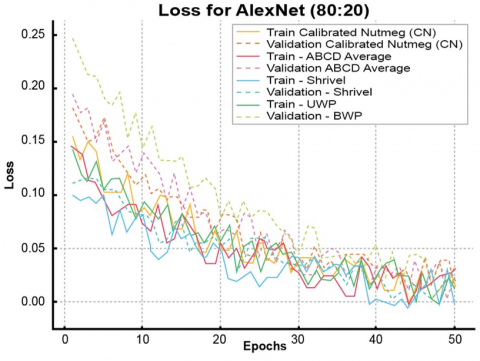
Table 2 presents the performance results of three deep learning models (LeNet-5, VGGNet, and AlexNet) used for nutmeg image classification. The evaluation was conducted with two data sharing ratios (80:20 and 90:10). The measured metrics include accuracy and loss at the training, validation, and testing stages. The evaluation results indicate that LeNet-5 has lower accuracy compared to VGGNet and AlexNet, although it still demonstrates reasonable performance. VGGNet displays the highest accuracy in training, validation, and testing, while AlexNet also performs well but has a slightly higher loss than VGGNet. In terms of data ratio, the 90:10 ratio yields higher accuracy than 80:20 since more data were utilized for training. From the model loss results, it is evident that the training loss is lower than the validation loss, suggesting that the model tends to experience overfitting. VGGNet has the lowest loss, indicating its superiority over LeNet-5 and AlexNet. Meanwhile, AlexNet exhibits slightly higher loss, particularly on the testing data, suggesting it is inferior to VGGNet. Figure 2 illustrates the loss graphs for 50 epochs separated by data ratio (80:20 and 90:10) for each model.
Table 2. Model performance evaluation
|
Model |
Ratio |
Category |
Accuracy |
Loss |
||||
|
Training |
Validation |
Testing |
Training |
Validation |
Testing |
|||
|
LeNet-5 |
80:20 |
CN |
92.3 |
88.5 |
85.6 |
0.12 |
0.18 |
0.20 |
|
ABCD Average |
90.7 |
87.2 |
84.3 |
0.15 |
0.27 |
0.25 |
||
|
Shriveled |
91.2 |
86.9 |
83.8 |
0.14 |
0.22 |
0.23 |
||
|
BWP |
89.5 |
85.6 |
82.4 |
0.17 |
0.25 |
0.26 |
||
|
90:10 |
CN |
94.1 |
89.7 |
86.5 |
0.10 |
0.16 |
0.18 |
|
|
ABCD Average |
92.8 |
88.9 |
85.2 |
0.13 |
0.17 |
0.21 |
||
|
Shriveled |
93.2 |
88.1 |
84.7 |
0.10 |
0.15 |
0.23 |
||
|
BWP |
90.9 |
86.4 |
83.1 |
0.16 |
0.22 |
0.26 |
||
|
VGGNet |
80:20 |
CN |
95.3 |
91.6 |
88.2 |
0.08 |
0.13 |
0.16 |
|
ABCD Average |
93.9 |
90.5 |
87.4 |
0.12 |
0.10 |
0.13 |
||
|
Shriveled |
94.2 |
90.2 |
86.8 |
0.09 |
0.14 |
0.21 |
||
|
BWP |
92.7 |
88.8 |
85.6 |
0.14 |
0.22 |
0.23 |
||
|
90:10 |
CN |
95.4 |
92.3 |
89.0 |
0.07 |
0.19 |
0.10 |
|
|
ABCD Average |
95.8 |
91.9 |
88.3 |
0.11 |
0.13 |
0.17 |
||
|
Shriveled |
94.2 |
90.6 |
87.1 |
0.06 |
0.09 |
0.13 |
||
|
BWP |
94.2 |
90.6 |
87.1 |
0.09 |
0.14 |
0.21 |
||
|
AlexNet |
80:20 |
CN |
93.5 |
89.2 |
86.1 |
0.15 |
0.19 |
0.25 |
|
ABCD Average |
92.2 |
88.1 |
85.0 |
0.13 |
0.20 |
0.21 |
||
|
Shriveled |
92.6 |
87.9 |
84.4 |
0.10 |
0.13 |
0.23 |
||
|
BWP |
91.1 |
86.5 |
83.3 |
0.14 |
0.25 |
0.28 |
||
|
90:10 |
CN |
95.0 |
91.3 |
87.8 |
0.09 |
0.14 |
0.19 |
|
|
ABCD Average |
93.6 |
90.1 |
86.5 |
0.12 |
0.15 |
0.23 |
||
|
Shriveled |
94.1 |
89.7 |
85.9 |
0.14 |
0.18 |
0.26 |
||
|
BWP |
92.5 |
88.3 |
84.6 |
0.09 |
0.13 |
0.20 |
||
Table 3. Measurement of speed and efficiency of the model
|
Model |
Epoch |
Processing Time (s) |
Inference Time (ms) |
|
LeNet-5 |
3 |
128.63 |
210.37 |
|
AlexNet |
3 |
3850.60 |
227.59 |
|
VGGNet |
3 |
250.32 |
241.89 |
|
LeNet-5 |
10 |
396.91 |
223.35 |
|
AlexNet |
10 |
13271.77 |
303.86 |
|
VGGNet |
10 |
16112.98 |
401.23 |
|
LeNet-5 |
20 |
725.02 |
150.57 |
|
AlexNet |
20 |
20718.02 |
298.23 |
|
VGGNet |
20 |
43161,65 |
601.88 |
|
LeNet-5 |
30 |
1167.86 |
208.77 |
|
AlexNet |
30 |
30165.11 |
366.56 |
|
VGGNet |
30 |
54181.38 |
517.22 |
|
LeNet-5 |
40 |
1490.93 |
236.78 |
|
AlexNet |
40 |
379810.32 |
422.90 |
|
VGGNet |
40 |
611917.71 |
710.11 |
|
LeNet-5 |
50 |
1902.81 |
204.02 |
|
AlexNet |
50 |
514676.14 |
578.21 |
|
VGGNet |
50 |
718229.12 |
987.55 |
3.2 Measurement of model speed and efficiency
Following performance evaluation, the subsequent step was to measure the speed and assess the efficiency of the model. These results provide a clear picture of how quickly the model can be trained and perform inference, as well as how efficient the model is in terms of resource usage. Speed measurements included training time and inference time, which provided information on how swiftly the model can learn from data and produce predictions [27]. Table 3 presents the results of speed and efficiency measurements for each model.
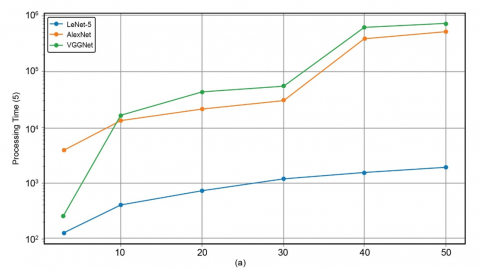
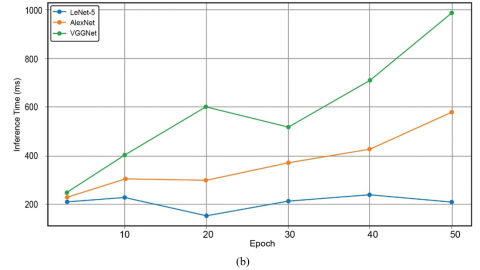
The model speed and efficiency results in Table 3 show that LeNet-5 delivers the best training and inference time efficiency among the three models. Although the training time increases by increasing epochs, from 128.63 seconds at 3 epochs to 1902.81 seconds at 50 epochs, the increase is relatively stable and insignificant. Inference time is relatively constant, with slight fluctuations between 210.37 ms at epoch 3 to 204.02 ms at epoch 50. This shows that LeNet-5 is more efficient both in terms of training and in performing inference. In contrast, AlexNet shows an extremely high training time [28]. At epoch 3, the training time reached 3850.60 seconds, and at epoch 50, the training time increased drastically to 514676.14 seconds, showing a significant and sharp increase as the epoch increases. The inference time also increased from 227.59 ms at epoch 3 to 578.21 ms at epoch 50, although the increase was not as large as the training time. These results suggest that AlexNet, while more complex and potentially more accurate, requires significantly longer training and inference times. VGGNet, which has a deeper and more complex structure, shows a similar trend but shows even more pronounced increases in both training and inference metrics. Its training time at epoch 3 was 250.32 seconds, but increased sharply to 718229.12 seconds at epoch 50. The inference time also showed a significant increase from 241.89 ms at epoch 3 to 987.55 ms at epoch 50. This increase is sharper than AlexNet, indicating that VGGNet requires greater computational resources and more time for training and inference [29]. Overall, LeNet-5 emerges as the most efficient model in terms of training and inference time, making it an optimal choice when speed is of utmost importance [30].
Figure 2. Loss graph of each model for 50 epochs
3.3 Overall analysis of best model selection
The performance evaluation and model efficiency show that selecting the best model for nutmeg seed quality classification involves balancing accuracy and processing time efficiency. VGGNet achieves the best results with the highest accuracy in the training, validation, and testing stages compared to AlexNet and LeNet-5. This suggests that VGGNet has superior generalization capabilities in recognizing patterns in nutmeg seed image data. In addition, the loss in VGGNet is lower than the other two models, indicating that this model is more stable and able to learn data more optimally. Figure 3 shows the overall results of the model comparison based on accuracy and processing time.
Figure 3. (a) Comparison based on accuracy, (b) Processing time comparison
This study presented a comparative analysis of three CNN architectures, LeNet-5, AlexNet, and VGGNet, for digital image-based nutmeg seed quality classification. Experimental results showed that each model has distinct characteristics in terms of prediction accuracy and computational efficiency. LeNet-5 proved to be the lightest and fastest model, well-suited for implementation in systems with limited computing resources or real-time applications. AlexNet displayed a relatively balanced performance between architectural complexity and feature extraction capabilities, while VGGNet demonstrated the highest classification accuracy despite its lengthy training and substantial resource requirements.
Practically, LeNet-5 is recommended for an efficient and fast automated nutmeg quality classification system. Although VGGNet demonstrated the best prediction performance, it may not be suitable for systems without hardware acceleration or with small-scale datasets. Therefore, the selection of a CNN architecture should consider the trade-off between accuracy and efficiency, tailored to the specific needs and technical constraints of the planned implementation.
This study acknowledges several limitations. The relatively small training data set (200 images) may lead to overfitting, especially in models with large parameters such as VGGNet. CPU-only training conditions also affect the accuracy of training time estimates. Furthermore, this study did not include statistical significance tests, such as McNemar's test, to ensure that performance differences between models are statistically significant and not simply chance fluctuations. This limits the generalizability of claims of model superiority.
[1] Ulfah, T., Hardjomidjodjo, H.H., Anggraeni, E. (2020). Nutmeg determination as the main commodity in South Aceh; A literature review. IOP Conference Series: Earth and Environmental Science, 472: 012040. https://doi.org/10.1088/1755-1315/472/1/012040
[2] Sujianto, S., Pribadi, E.R., Saptati, R.A., Mahendri, I.G.A.P., et al. (2024). Assessing Indonesian nutmeg commodity trade competitiveness and developing sustainable strategies in the global market. Agris On-line Papers in Economics and Informatics, 16(3): 121-138. https://doi.org/10.7160/aol.2024.160309
[3] Jayashree, E., Joseph, D. (2023). Comparison of drying characteristics and quality of nutmeg mace (Myristica fragrans) by different drying methods. The Pharma Innovation Journal, 12(3): 5908-5912. https://www.thepharmajournal.com/archives/2023/vol12issue3/PartBL/12-3-669-413.pdf.
[4] Soori, M., Arezoo, B., Dastres, R. (2023). Artificial intelligence, machine learning and deep learning in advanced robotics, a review. Cognitive Robotics, 3: 54-70. https://doi.org/10.1016/j.cogr.2023.04.001
[5] Loyani, L., Machuve, D. (2021). A deep learning-based mobile application for segmenting tuta absoluta's damage on tomato plants. Engineering, Technology & Applied Science Research, 11(5): 7730-7737. https://doi.org/10.48084/etasr.4355
[6] Alzubaidi, L., Zhang, J.L., Humaidi, A.J., Al-Dujaili, A., et al. (2021). Review of deep learning: Concepts, CNN architectures, challenges, applications, future directions. Journal of Big Data, 8: 53. https://doi.org/10.1186/s40537-021-00444-8
[7] Taye, M.M. (2023). Understanding of machine learning with deep learning: Architectures, workflow, applications and future directions. Computers, 12(5): 91. https://doi.org/10.3390/computers12050091
[8] Elyan, E., Vuttipittayamongkol, P., Johnston, P., Martin, K., McPherson, K., Moreno-García, C.F., Jayne, C., Sarker, M.M.K. (2022). Computer vision and machine learning for medical image analysis: Recent advances, challenges, and way forward. Artificial Intelligence Surgery, 2: 24-45. https://doi.org/10.20517/ais.2021.15
[9] El Sakka, M., Ivanovici, M., Chaari, L., Mothe, J. (2025). A review of CNN applications in smart agriculture using multimodal data. Sensors, 25(2): 472. https://doi.org/10.3390/s25020472
[10] Sembiring, A., Away, Y., Arnia, F., Muharar, R. (2021). Development of concise convolutional neural network for tomato plant disease classification based on leaf images. Journal of Physics: Conference Series, 1845(1): 012009. https://doi.org/10.1088/1742-6596/1845/1/012009
[11] Zhao, X., Wang, L.M., Zhang, Y.F., Han, X.M., Deveci, M., Parmar, M. (2024). A review of convolutional neural networks in computer vision. Artificial Intelligence Review, 57: 99. https://doi.org/10.1007/s10462-024-10721-6
[12] Subhan, M., Basri, H. (2019). Klasifikasi mutu buah pala (Myristica fragrans Houtt) berbasis pengolahan citramenggunakan metode deep learning arsitektur faster R-CNN. INTEK Jurnal Penelitian, 6(2): 106-113. https://doi.org/10.31963/intek.v6i2.1566
[13] Margendy Bogar, B., Lumenta, A.S.M., Jacobus, A. (2021). Nutmeg seed image classification using convolution neural network. Jurnal Teknik Elektro dan Komputer, 10(3): 229-236. https://ejournal.unsrat.ac.id/index.php/elekdankom.
[14] Qisthi, I.B., Siswono, H. (2024). Classification of nutmeg ripeness using artificial intelligence. IAES International Journal of Artificial Intelligence, 13(2): 2441-2450. https://doi.org/10.11591/ijai.v13.i2.pp2441-2450
[15] Hu, X., Chu, L.Y., Pei, J., Liu, W.Q., Bian, J. (2021). Model complexity of deep learning: A survey. Knowledge and Information Systems, 63: 2585-2619. https://doi.org/10.1007/s10115-021-01605-0
[16] Maharana, K., Mondal, S., Nemade, B. (2022). A review: Data pre-processing and data augmentation techniques. Global Transitions Proceedings, 3(1): 91-99. https://doi.org/10.1016/j.gltp.2022.04.020
[17] Zhou, K., Oh, S.K., Pedrycz, W., Qiu, J.L. (2023). Data preprocessing strategy in constructing convolutional neural network classifier based on constrained particle swarm optimization with fuzzy penalty function. Engineering Applications of Artificial Intelligence, 117: 105580. https://doi.org/10.1016/j.engappai.2022.105580
[18] Kudari, J.M., S, A.J., S, S.B. (2021). Image classifier using the Adam optimizer and the ReLU activation. International Journal of Advanced Research in Engineering and Technology, 12(3): 56-60. https://doi.org/10.34218/IJARET.12.3.2021.006
[19] Reyad, M., Sarhan, A.M., Arafa, M. (2023). A modified Adam algorithm for deep neural network optimization. Neural Computing and Applications, 35: 17095-17112. https://doi.org/10.1007/s00521-023-08568-z
[20] Patil, A., Rane, M. (2021). Convolutional neural networks: An overview and its applications in pattern recognition. In Information and Communication Technology for Intelligent Systems. ICTIS 2020. Smart Innovation, Systems and Technologies, Springer, Singapore, pp. 21-30. https://doi.org/10.1007/978-981-15-7078-0_3
[21] Chen, X.C. (2023). The Study for convolutional neural network and corresponding applications. Theoretical and Natural Science. https://doi.org/10.54254/2753-8818/5/20230387
[22] Ong, K., Haw, S., Ng, K. Deep learning based-recommendation system: An overview on models, datasets, evaluation metrics, and future trends. In Proceedings of the 2019 2nd International Conference on Computational Intelligence and Intelligent Systems, Bangkok Thailand, pp. 6-11. https://doi.org/10.1145/3372422.3372444
[23] Naidu, G., Zuva, T., Sibanda, E.M. (2023). A Review of evaluation metrics in machine learning algorithms. In Artificial Intelligence Application in Networks and Systems, pp. 15-25. https://doi.org/10.1007/978-3-031-35314-7_2
[24] Vujović, Ž.Đ. (2021). Classification model evaluation metrics. International Journal of Advanced Computer Science and Applications, 12(6): 1-8. https://doi.org/10.14569/IJACSA.2021.0120670
[25] Yacouby, R., Axman, D. (2020). Probabilistic extension of precision, recall, and F1 score for more thorough evaluation of classification models. In Proceedings of the First Workshop on Evaluation and Comparison of NLP Systems, pp. 79-91. https://doi.org/10.18653/v1/2020.eval4nlp-1.9
[26] Mao, A., Mohri, M., Zhong, Y.T. (2023). Cross-entropy loss functions: Theoretical analysis and applications. arXiv preprint, arXiv:2304.07288. https://doi.org/10.48550/arXiv.2304.07288
[27] Ahmed, S.F., Alam, M.S.B., Hassan, M., Rozbu, M.R., Ishtiak, T., Rafa, N., Mofijur, M., Ali, A.B.M.S., Gandomi, A.H. (2023). Deep learning modelling techniques: Current progress, applications, advantages, and challenges. Artificial Intelligence Review, 56: 13521-13617. https://doi.org/10.1007/s10462-023-10466-8
[28] Zulkeflie, S.A., Fammy, F.A., Ibrahim, Z., Sabri, N. (2019). Evaluation of basic convolutional neural network, AlexNet and bag of features for indoor object recognition. International Journal of Machine Learning and Computing, 9(6): 801-806. https://doi.org/10.18178/ijmlc.2019.9.6.876
[29] Gayathri, P., Dhavileswarapu, A., Ibrahim, S., Paul, R., Gupta, R. (2023). Exploring the potential of VGG-16 architecture for accurate brain tumor detection using deep learning. Journal of Computer Mechanics and Management, 2(2): 13-22. https://doi.org/10.57159/gadl.jcmm.2.2.23056
[30] Zhang, J.S., Yu, X.S., Lei, X.L., Wu, C.D. (2022). A novel deep LeNet-5 convolutional neural network model for image recognition. Computer Science and Information Systems, 19(3): 1463-1480. https://doi.org/10.2298/CSIS220120036Z