Kishor Barasu Bhangale![]() | Snehal Bhosale*
| Snehal Bhosale*![]() | Rohini Temkar
| Rohini Temkar![]() | Shubhangi Adagale-Vairagar
| Shubhangi Adagale-Vairagar![]() | Sushadevi Shamrao Adagale
| Sushadevi Shamrao Adagale![]() | Rahul Mapari
| Rahul Mapari![]() | Harish Tiwari
| Harish Tiwari![]()
© 2025 The authors. This article is published by IIETA and is licensed under the CC BY 4.0 license (http://creativecommons.org/licenses/by/4.0/).
OPEN ACCESS
Diabetes is becoming one of the world's most fatal chronic diseases, leading to various medical difficulties. Diabetes must be detected early to provide prompt treatment and to prevent the condition from progressing. In recent years, numerous artificial intelligence-based systems have been offered for diabetes detection. The article presents an early detection of diabetes based on deep convolutional neural network (DCNN), which uses clinical data features including age, triceps skin fold thickness (TST), blood pressure (BP), glucose, body mass index (BMI), count of pregnancies, insulin, and diabetes pedigree function (DPF). It utilizes DCNN to enhance feature distinctiveness, correlation, and interconnectivity, thereby improving diabetes detection performance. The efficacy of the suggested approach is assessed on the Indian PIMA dataset (IPD) based on percentage accuracy, recall, precision, and F1 score. The DCNN without data augmentation achieves an overall accuracy of 92.2%, a precision of 0.92, a recall of 0.91, and an F1-score of 0.92 for a 5-layered architecture. The performance of the DCNN-Generative Adversarial Network (GAN)-based diabetes detection scheme yields an improved accuracy of 95.76%, a recall of 0.9519, a precision of 0.9567, and an F1 score of 0.9542, outperforming existing diabetes detection schemes. The DCNN-GAN offers improved performance for diabetes detection, addressing the class imbalance problem and the issue of poor feature representation.
deep learning, diabetes prediction, deep convolutional neural network, database augmentation
According to the World Health Organization (WHO), diabetes is a rapidly growing chronic disease and the ninth leading cause of death across the globe. Thus, early diagnosis of diabetes is essential so that proper preventive action can be taken to avoid progressive effects. Diabetes is caused when the pancreas does not produce adequate insulin or when the human body cannot use the insulin produced by the pancreas effectively. Diabetes is related to metabolism and may cause kidney failure, lower limb amputation, heart attack, blindness, chronic renal failure, antipathy, cirrhosis of the liver, diabetic foot syndrome, neuropathy, transient hyperglycemia, hyperthyroidism, encephalopathy, stroke, adrenal gland tumors, glucagonoma, and many other difficulties. Diabetes has shown rapid growth in the population of low- and middle-income developing countries compared with high-income countries because of a lack of proper diet, stress, obesity, lack of exercise, etc. [1-4].
A healthy diet, maintaining a healthy body weight, regular physical activity, and avoiding tobacco use can commonly help delay or prevent diabetes. Generally, diabetes is categorized into two variants: type 1 (T1D) and type 2 (T2D). T1D diabetes is caused by a deficiency in insulin formation that controls blood sugar. The various symptoms of type 1 are thirst, constant hunger, excessive excretion of urine, vision changes, weight loss, and fatigue [3-5]. T2D is the most common diabetes that occurs due to inefficient use of insulin among total diabetes patients; more than 95% of people suffer from T2D diabetes. It shows symptoms such as physical inactivity, low immunity, and excessive body weight. Traditionally, diabetes is diagnosed using testing of blood sugar (AIC test), fasting blood sugar test, and glucose tolerance test. Early diagnosis of diabetes is very crucial for avoiding the critical complications that can occur due to diabetes [6-9].
Artificial intelligence (AI) approaches can now be used to diagnose a variety of diseases, with deep neural networks (DNNs) achieving the most outstanding results in classification tasks [10]. DNNs have been utilized to diagnose a diversity of disorders in recent years. The pancreas functions normally and produces enough insulin in the absence of diabetes. When insulin links to receptors on the cell's surface, the glucose molecule's entry into the cell is also opened. In T1D, the pancreas eventually stops manufacturing insulin, causing glucose transport to cells to be disrupted [11].
This article presents deep learning (DL)-based early diabetes prediction based on a healthcare database. The key contributions of the article are summarized as follows:
This article is arranged as follows: Section II focuses on the recent trends in diabetes prediction using clinical data. Section III presents the dataset and methods employed in the diabetes detection system. Furthermore, Section IV provides a detailed explanation of the proposed DL-based diabetes detection system. Afterward, Section V presents experimental results and an analytical discussion. Lastly, Section VI offers a conclusion and provides future directions for upgrading the proposed scheme.
Healthcare is one of the most crucial fields in which science and technology are needed for civilization to advance. Various AI-based schemes utilize health records, genomics, and clinical imaging to train machine learning (ML) and DL systems [12].
To diagnose type-2 diabetes, Mohebbi et al. [13] developed a novel DL method, proving that CGM signals may be used to identify T2D patients. Modak et al. [14] suggested that the ensemble learning models, such as the CatBoost classifier, have better categorical feature learning capability than traditional ML classifiers. The CatBoost provided an overall accuracy of 95.4% for the real-time dataset. However, the system suffers from the data scarcity problem, which limits its robustness and reliability for real-time deployment. Das et al. [15] presented ensemble learning for diabetes detection, which considers behavioural attributes, demographics, medical history, and health data. The data augmentation using the oversampling technique helps to achieve an overall accuracy of 96.40% on the “Behavioural Risk Factor Surveillance System” dataset. AlJourishi and Abdel-Nabi [16] suggested that the ensemble learning presented an ensemble ML-based classifier based on extra trees for diabetes prediction using categorical data. An ensemble classifier using “Synthetic minority oversampling technique” (SMOTE) data-augmentation provided an overall accuracy of 96.98% for three-class classification, such as prediabetic, non-diabetic, and diabetic. Ai et al. [17] explored that fasting glucose is the most essential parameter for the prediction of diabetes and insulin level, and c-peptide is crucial for detecting the decline in insulin level in the body. However, multiple health and lifestyle attributes may help identify prediabetic conditions.
Ge et al. [18] presented that the body roundness index can be essential for predicting diabetes in conditions of low muscle mass using an RF classifier. It shows that it is essential to predict diabetes at the prediabetic level to avoid the future hazards to the body organs and the human immune system. Manzini et al. [19] presented an attention-based autoencoder for predicting T2D based on clinical data, which has shown a significant boost in the accuracy of the system. However, the real-time deployment may be limited due to computational intricacy and higher training parameters of the system. Abousaber [20] suggested that the gradient boosting classifier provides promising results for diabetes using the adaptive synthetic data augmentation technique (ADASYN) than the traditional SMOTE. However, the sample diversity and robustness to noise are lower for synthetic data generated using ADASYN. Al-Hussein et al. [21] proposed multiple linear regression (MLR) for T2D detection using healthcare data. The MLR offered the R-squared value of 0.90, which shows a boost over CT, RF, and KNN. However, the efficacy of MLR is limited due to a smaller training dataset.
Kowsher et al. [22] developed a DNN and ML classifier to improve classification results. However, a combination of models leads to intricacy in the system. According to Soniya et al. [23], a CNN and a hybrid evolutionary method are used to optimize the number of filters and layers, determined by the user's and the application's demands. Ramazi et al. [24] used information from wearable sensors, lab tests, and demographics to build a broad and deep neural network. Alharbi and Alghahtani [25] presented the GA-ELM method. This hybrid algorithm utilized six useful features from the dataset's initial eight characteristics to classify the dataset with 97.5% accuracy and correctly identify patients with type 2 diabetes. The identification of diabetes using CNN and variational autoencoder (VAE) was presented by García-Ordás et al. [26]. By augmenting the Indian PIMA dataset with the VAE model, they achieved 92.31% accuracy in identifying diabetes.
Recently various ML and DL based systems has shown promising results for biomedical signal processing and pattern recognition applications [27-29]. The DL techniques has shown enhanced feature depiction of raw data and helps to improve the classification accuracy of models [30]. Linkon et al. [31] suggested that ensemble models achieve superior accuracy compared to ML models. They achieved 82.91% accuracy in diabetes detection using a light gradient boosting machine on the Kaggle dataset, which included 17 physical, psychological, behavioral, and lifestyle attributes. Shaheen et al. [32] explored the Hi-Le model for diabetes detection that combines the “Highway” and “LeNet” models to improve feature correlation. They employed proximity-based synthetic oversampling for data augmentation, which resulted in an overall accuracy of 94% for diabetes detection. However, the computational intricacy of the model limits the real-time deployment on resource-constrained devices. Gowthami et al. [33] provided a comparative analysis of various ML models for T2D detection. They suggested that feature selection schemes highly influence outcomes of ML techniques, and there is a need to enhance the generalization capability of models. Eboka et al. [34] suggested bidirectional long short-term memory (BiLSTM) to improve the long-term depiction of attributes. The BiLSTM resulted in an improved accuracy of 91.98% for the PIMA dataset.
The following gaps are identified from the review of recent work in diabetes detection using clinical data:
This work introduces a new DCNN-based model and GAN-based data augmentation for early diabetes risk prediction, utilizing multiple clinical datasets.
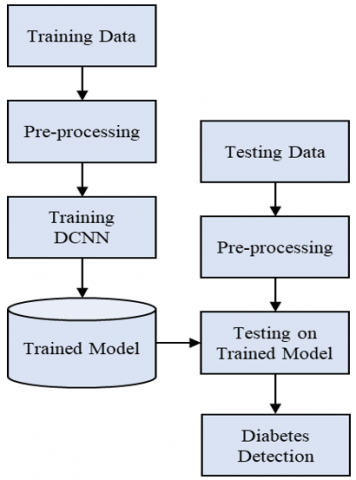
Prediction of normal and diabetic persons is challenging because of less variability in raw clinical data, missing values, and incomplete data. Therefore, selecting a proper clinical dataset is essential for efficient diabetes prediction. The work aims to offer a distinctive attribute for diabetes detection and assess the significance of automatic DL-based diabetes detection. The flow of suggested diabetes prediction is illustrated in Figure 1, which encompasses the training and testing phases.
Figure 1. Flow diagram of methodology
The proposed framework includes data preprocessing, such as normalization, cleaning, and data augmentation (during training). Further, a lightweight DCNN is employed to depict and classify the features into diabetes labels. The DCNN model helps to learn the correlation and connection patterns in various medical, physical, and behavioural attributes of the patient. The early detection of diabetes helps patients to take preventive measures to avoid potential hazards to their health in the future. The outcomes of the system are assessed using accuracy and various qualitative and quantitative measures.
3.1 Dataset
The data for experimentation is selected from the PID dataset, which has an overall of 768 samples, 500 of which are healthy and 268 are diabetes samples [27]. It encompasses eight statistical, clinical variables such as age, blood pressure (BP), glucose, body mass index (BMI), glucose, insulin, triceps skin fold thickness (TST), count of pregnancies, and diabetes pedigree function (DPF) that can distinguish diabetes and non-diabetic samples in the dataset. Table 1 lists the dataset variable types and ranges in detail.
Table 1. Details of the Indian PIMA dataset
|
Feature Label |
Range |
Variable Type |
|
Pregnancy count |
0-17 |
Integer |
|
Plasma glucose |
0-199 |
Real |
|
BP |
0-122 |
Real |
|
TST |
0-99 |
Real |
|
2 h serum insulin |
0-846 |
Real |
|
BMI |
0-67.1 |
Real |
|
DPF |
0.078-2.42 |
Real |
|
Age |
21-81 |
Integer |
|
Class |
0 (Normal) / 1 (Diabetic) |
Binary |
(a)
(b)
(c)
(d)
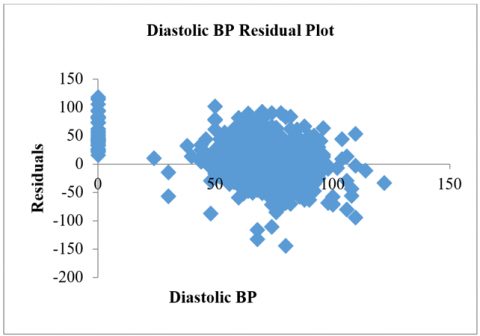
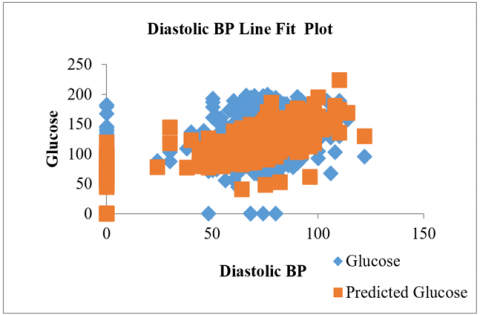
Figure 2. Analysis of dataset a) Diastolic BP Residual Plot; b) BMI Residual Plot; c) Diastolic BP Line Fit Plot; d) BMI Line Fit
Three variables are used as the outcome: BP and BMI as the dependent variables, and glucose level as the independent variable in the dataset. In that case, 46.66% of the overall population can be classified as having a positive outcome. This means that individuals who experience both an increase in their blood pressure level and their glucose level are at a high risk of developing diabetes and being affected by its aftereffects. The diastolic BP and the BMI residual plot are shown in Figure 2(a) and Figure 2(b). Figure 2(c) illustrates the regression plot for the diastolic BP analysis of the BMI vs glucose level.
The dataset consists of uneven sample sizes, which leads to a class imbalance problem. The diabetic samples are augmented to 500 samples to equalize the dataset size. The augmented dataset using GAN is given in Table 2. We have created the same samples using GAN and traditional SMOTE to analyze the performance of the system. The dataset is split into a 70:30 ratio for training and testing purposes. The 70% data for training provides stability in training, and the 30% data for testing provides enough samples for validating the effectiveness of the trained model for unseen data.
Table 2. Dataset details
|
Dataset |
Original Samples |
Augmented Dataset |
||
|
Total Samples |
Train Samples (70%) |
Test Samples (30%) |
||
|
Healthy |
500 |
500 |
350 |
150 |
|
Diabetic |
268 |
500 |
350 |
150 |
|
Total |
768 |
1000 |
700 |
300 |
3.2 Pre-processing of data
Pre-processing removes incomplete records, normalizes the samples, and updates missing values. The data with any missing values is removed from the original dataset. The preprocessing stage applies the novel adaptive min-max normalization to minimize the outliers and standardize the data. The original data (D) is normalized using Eq. (1), where $D_{\text {norm}}$ denotes normalized clinical data, $D_{\min}$ depicts the minimum value of clinical attribute, $D_{\max}$ indicate the maximum value of clinical data, and $\epsilon$ indicate samll positive number to avoid infinity value when $D_{\min}=D_{\max}$.
$D_{\text {norm}}=\min \left(1, \max \left(0, \frac{D-D_{\min}}{D_{\max}-D_{\min}+\epsilon}\right)\right)$ (1)
During the testing phase, a test sample is tested over the trained network that generates the recognition results into a healthy or diabetes sample. The five-layered DCNN architecture helps to characterize the distinguishing attributes of the raw diabetes clinical data.
3.3 Data augmentation using GAN
The GAN model is used for clinical data augmentation, which uses the generator (Gen) and discriminator (Dis) network as given in Figure 3. The GenNet creates the synthetic data from the random noise vector and tries to reduce the error in the synthetic and training samples. The DisNet network identifies the real and fake data. The framework of the GANbased data augmentation is shown in Figure 4. Eq. (2) provides GAN behavior where $x$ denotes real data, $z$ indicates the noise variable, $y$ denotes the conditioning variable, $D(x \mid y)$ specifies DisGen prediction for real input at condition $y$, and $G(z \mid y)$ indicates the sample generated by GenNet using noise vector at condition $y$.
$\min _G \max _D E_{x \sim P_r}[D(x \mid y)]-E_{z \sim P_z}[D(G(z \mid y))]$ (2)
Figure 3. GAN model for data augmentation
The GenNet consists of a reshape layer that converts the noise vector into 1×8 dimensions. The transpose convolution (TransConv) layers increase the feature connectivity. The three TransConv layers use 128, 64, 32, and 1 filters at four layers. The TransConv layers are followed by batch normalization (BN) for standardizing neurons and rectified linear unit layer (ReLU) to improve the features' non-linearity. The DisNet consists of four Conv layers with 128, 64, 32, and 1 filters at each layer, followed by BN and ReLU. The Softmax classifier is utilized to classify real and fake samples.
The GAN model is trained using the Adam optimization algorithm, considering a batch size of 16, an initial learning rate of 0.001, a cross-entropy loss function, and 100 epochs.
3.4 DCNN model
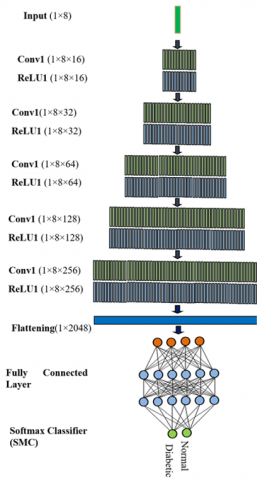
The DCNN helps provide multilevel hierarchical feature depiction, spatial connectivity between the features, and better correlation and connectivity between the local and global clinical attributes [28-30]. The clinical data has variability in the feature values, leading to complex feature depiction using DCNN. Also, there is a need to develop a lightweight DCNN framework that requires lower trainable parameters and time and can be efficiently implemented on standalone resource-constrained devices. The DCNN comprises five layers of CNN that consist of five convolution layers (Conv), five Rectified Linear Unit Layer (ReLU), one fully connected layer (FC), and lastly Softmax classifier layer (Softmax) as shown in Figure 4.
The first layer in the DCNN includes two layers {Conv1(KernelSize-1×3, NumFilter-16, Stride-1, ZeroPadding-Yes)→ReLU1 (Stride-1)} which accepts the diabetes data with dimensions of (1×8) and creates the output feature map of (1×8×16). Zero padding preserves the original sizes of the diabetes data. The second layer encompasses {Conv2(KernelSize-1×3, NumFilter-32, Stride-1, ZeroPadding-Yes)→ReLU3 (Stride-1)} which results in an output feature map of (1×8×32). The third layer encompasses {Conv3(KernelSize-1×3, NumFilter-64, Stride-1, ZeroPadding-Yes)→ReLU3 (Stride-1)}. Further, the fourth layer is designed as {Conv4(KernelSize-1×3, NumFilter-128, Stride-1, ZeroPadding-Yes)→ReLU4 (Stride-1)} that provides an output feature map of (1×8×128). The fifth layer includes {Conv5(KernelSize-1×3, NumFilter-256, Stride-1, ZeroPadding-Yes)→ReLU5 (Stride-1)} t (1×8×32).
The Conv feature map $y(n)$ of 1-D diabetes data $D(n)$ and Conv filter $k(n)$ with size L is given in Eq. (3). Eq. (4) indicates the Conv feature that describes the hierarchical connectivity features where $y_i^1$ denotes the $i_m^{\text {th }}$ feature map of $l^{\text {th }}$ layer, ${y}_{{j}}^{l-1}$ stands for the $\mathrm{j}_{\mathrm{m}}^{\text {th }}$ feature of $(l-1)^{\text {th }}$ layer, $\mathrm{k}_{\mathrm{ij}}^1$ denotes the filter kernel of $l^{\text {th }}$ layer connected to $j$ feature, $\mathrm{b}_{\mathrm{i}}^{\mathrm{l}}$ signifies for bias, and $\sigma$ denotes the ReLU function. The ReLU activation function is faster and easier to substitute negative neurons by 0 to overcome the vanishing gradient problem as given in Eq. (5).
$y(n)=D(n) \times k(n)=\sum_{m=0}^{L-1} s=D(m) \cdot k(n-m)$ (3)
$y_i^l=\sigma\left(b_i^l+\sum_j y_j^{l-1} \times k_{i j}^l\right)$ (4)
$\sigma(y)=\max (0, y)$ (5)
After five CNN layers, two FC layers were used, which had 50 hidden layers. Lastly, the SMC offers the output probability, where the label of the output neuron with the maximum probability yields the prediction result in Eqs. (6)-(8), respectively.
$z_i=\sum_j h_j w_{j i}$ (6)
$p_i=\frac{\exp \left(z_i\right)}{\sum_{j=1}^n \exp \left(z_j\right)}$ (7)
$\hat{y}=\arg _i^{\max } p_i$ (8)
Here, ${h}_{{j}}$ is the weight of the second-to-last layer and $w_{j i}$ signifies the weights of SMC and the second-to-last layer, $z_i$ is the input of the SMC layer, $p_i$ is the likelihood of the class label and $\hat{y}$ is the predicted label. The DCNN is trained using the mini- batch gradient descent algorithm (MBGD).
Figure 4. The framework of DCNN for diabetes detection
The algorithm for the proposed DCNN-based diabetes prediction can be given as follows:
Step 1: Network and Hyperparameter Initialization
N: Number of layers
k: number of convolution filter
α: Learning rate
b: Initial bias
w: Initial weights
Num_feat: Number of features
Step 2: Data Pre-processing
Data Normalization
Data Cleaning
Step 3: Data Splitting
Train_feat: Training Features
Train_Labels: Training Labels
Test_feat: Testing Features
Test_Labels: Testing Labels
Step 4: Training phase
Layers
{
Convolution Layer1 (Stride-1, padding-same,k-16)
ReLU Layer1
Convolution Layer2 (Stride-1, padding-same,k-32)
ReLU Layer2
Convolution Layer3 (Stride-1, padding-same,k-64)
ReLU Layer3
Convolution Layer4 (Stride-1, padding-same,k-128)
ReLU Layer4
Convolution Layer5 (Stride-1, padding-same,k-256)
ReLU Layer5
Fully Connected Layer
Softmax Classifier
}
Net=train_network(Train_feat, Train_Labels,Layers)
Step 5: Testing phase
Predicted_label=test_network(Test_feat, Net)
Step 6: Performance Evaluation
confusion_matrix=confusion(Predicted_label,Test_Labels)
performance_metrics(confusion_matrix)
{
Accuracy
Recall
Precision
F1-score }
A desktop PC with 8GB RAM and a core i5 CPU is used to create the suggested system using Python 3.0. Eqs. (9)-(12) are used to calculate accuracy, recall, precision, and F1-score, which are employed to evaluate the effectiveness of the proposed deep learning approach for diabetes diagnosis. TP stands for the number of samples appropriately categorized as not having diabetes. TN is the number of diabetes samples that were categorized correctly. The numerical values FN and FP indicate the quantity of non-diabetes samples that were incorrectly identified and the number of diabetes image classification errors, respectively.
$\operatorname{Accuracy}(\%)=\frac{T P+T N}{T P+T N+F P+F N}$ (9)
Recall $=\frac{T P}{T P+F N}$ (10)
Precision $=\frac{T N}{T N+F P}$ (11)
$F 1-$ score $=\frac{2 \times \text { Recall } \times \text { Precision }}{\text { Recall }+ \text { Precision }}$ (12)
The different parameter specifications of the DCNN are presented in Table 3. The implementation parameters of the DCNN and MBGD learning algorithm are given in Table 4.
Table 3. Parameter specification of DCNN
|
Layer |
Sub-Layer |
Input Size |
Filter Size |
No of Filters |
Stride |
Padding |
Output Feature Map |
Total Trainable Parameters |
|
Input |
- |
1×8 |
- |
- |
- |
- |
1×8 |
- |
|
CNN1 |
Conv-1 |
1×8 |
1×3 |
16 |
1 |
2 |
1×8×16 |
400 |
|
ReLU-1 |
1×8×16 |
- |
- |
1 |
- |
1×8×16 |
- |
|
|
CNN2 |
Conv-2 |
1×8×16 |
1×3 |
32 |
1 |
2 |
1×8×32 |
1568 |
|
ReLU-2 |
1×8×32 |
- |
- |
1 |
- |
1×8×32 |
- |
|
|
CNN3 |
Conv-2 |
1×8×32 |
1×3 |
64 |
1 |
2 |
1×8×64 |
6208 |
|
ReLU-2 |
1×8×64 |
- |
- |
1 |
- |
1×8×64 |
- |
|
|
CNN4 |
Conv-2 |
1×8×64 |
1×3 |
128 |
1 |
2 |
1×8×128 |
98560 |
|
ReLU-2 |
1×8×128 |
- |
- |
1 |
- |
1×8×128 |
- |
|
|
CNN5 |
Conv-2 |
1×8×128 |
1×3 |
256 |
1 |
2 |
1×8×256 |
196864 |
|
ReLU-2 |
1×8×256 |
- |
- |
1 |
- |
1×8×256 |
- |
|
|
FC Layer |
- |
50×1 |
- |
- |
- |
- |
50×1 |
12850 |
|
Classification Layer |
- |
50×1 |
- |
- |
- |
- |
2×1 |
102 |
Table 4. DCNN hyper-parameters
|
Parameter |
Specification |
|
Stride |
[2 2] |
|
Mini Batch Size |
64 |
|
Padding |
[1 1] |
|
Filters |
First layer-96, Second layer-256, Third layer- 384 |
|
Maximum Epoch |
20 |
|
Gradient Threshold |
Inf |
|
L2 Regulation |
104 |
|
Initial Learning Rate |
0.01 |
|
Gradient Threshold Method |
L2 Norm |
|
Filter Size |
3 × 3 |
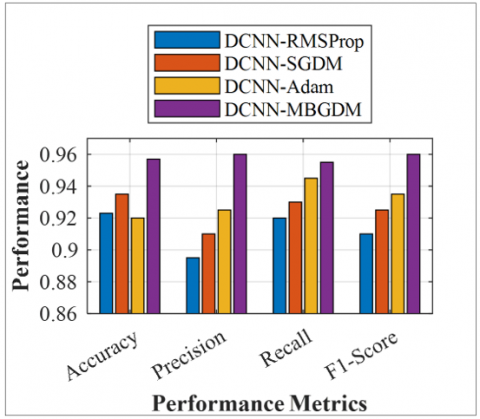
The performance of DCNN is compared with various learning algorithms, including MBGD, Adam, RMSProp, and SGD. The proposed system achieved 95.41% accuracy for diabetes detection using the proposed DCNN-MBGD on the Indian PIMA dataset, as shown in Figure 5. The DCNN-MBGDM provides an improved overall accuracy of 95.41%, precision of 0.96, recall of 0.95, and F1-score of 0.96 for the augmented dataset.
The DCNN-Adam provides an overall accuracy of 92%, a recall of 0.95, a precision of 0.92, and an F1-score of 0.93. The DCNN-SGDM and DCNN-RMSProp achieve an overall accuracy of 93.5% and 92.3%, respectively, for the augmented dataset.
Figure 5. Performance of proposed DCNN and DCNN-GAN on the Indian PIMA dataset
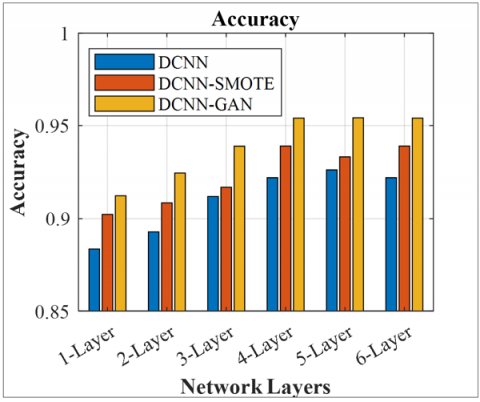
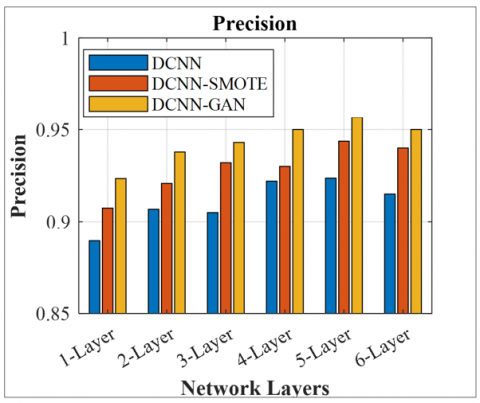
Figures 6-9 illustrate the effect of several CNN layers in DCNN on various performance metrics of diabetes detection for DCNN and DCNN with data augmentation using the SMOTE and GAN. It is observed that increasing the number of CNN layers to 5 improves performance. Still, after the 5th layer, there is a minor improvement in the performance metrics, but a massive increase in trainable parameters. Therefore, a total of 5 layers are considered for the implementation. The DCNN-GAN achieves an improved accuracy of 95.41% compared to DCNN-SMOTE (93.3%) and DCNN (92.2%), due to its higher representation capability of the augmented data. The DCNN-GAN provides superior recall of 0.95, precision of 0.95, and F1-score of 0.95 compared to DCNN-SMOTE and DCNN for the 5-layered framework. DCNN without data augmentation provides a lower precision of 0.92, recall of 0.91, and F1-score of 0.92 for 5-layered architecture.
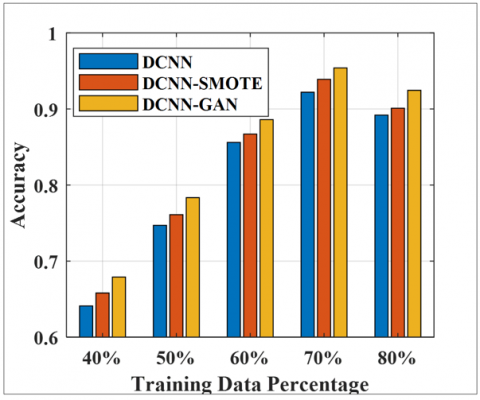
The results of the suggested method are assessed for the different training samples selected arbitrarily. It is noted that boosting the training sample size enhances the diabetes detection performance, as given in Figure 10.
The training samples varied from 30% to 70% of the total dataset, and the outstanding samples were considered for testing purposes. The proposed method achieves 95.41% accuracy for DCNN-GAN, 93.38% for DCNN-SMOTE, and 92.22% for DCNN without data augmentation, using a 70% training and 30% testing dataset. This demonstrates significant improvement over the accuracies obtained with a lower number of training samples.
Figure 6. Accuracy comparison for DCNN, DCNN-SMOTE, and DCNN-GAN
Figure 7. Precision comparison for DCNN, DCNN-SMOTE, and DCNN-GAN
Figure 8. Recall comparison for DCNN, DCNN-SMOTE, and DCNN-GAN
Figure 9. F1-score comparison for DCNN, DCNN-SMOTE, and DCNN-GAN
Figure 10. Effect of DCNN, DCNN-SMOTE, and DCNN-GAN
The effectiveness of the diabetes detection scheme is evaluated for the different CNN layers based on total trainable parameters (TTPs), training time required for the model, and overall accuracy. The DCNN considers five layers for implementation because it provides higher accuracy by distinctly depicting the features. The DCNN provides overall accuracy of 91.23% for 1-layer, 92.45% for 2-layer, 93.89% for 3-layers, 95.35% for 4-layers, 95.41 5 for 5-layers, and 95.38% for 6-layers for diabetes detection. It provides 144.3 K TTPs for a 5-layered architecture and requires 1104 seconds for the training. Increasing the layers beyond the fifth layer increases the TTPs (341.2 K) and training time (1789 sec), adding computational intricacy to the system as shown in Table 5.
The results of DCNN-GAN are compared with those of earlier state-of-the-art models. It is perceived that the DCNN-GAN-based diabetes detection offers considerably improved outcomes compared with the previous state of arts, as given in Table 6. The results of DCNN are compared with those of traditional ML classifiers, including K-nearest neighbor (KNN), Support Vector Machine (SVM), classification tree (CT), and random forest (RF).
The DCNN-GAN exhibits better feature representation capabilities and facilitates the learning of interconnectivity in different clinical datasets for diabetes detection. For the original dataset, the system achieves overall accuracies of 81.40% for KNN, 82.85% for SVM, 83.50% for CT, 86.45% for RF, and 92.22% for DCNN without data augmentation. The system offers an overall accuracy of 82.25% for KNN, 84.10% for SVM, 84.50% for CT, 87.20% for RF, and 93.38% for DCNN-SMOTE. It offers improved accuracy of 82.20% for KNN, 85.45% for SVM, 86.15% for CT, 88.20% for RF, and 95.41% for DCNN-GAN.
Thus, the proposed compact DCNN provides better results for diabetes detection based on clinical data. The five-layered DCNN supports reducing intra-class disparity and improving inter-class consistency to enhance diabetes detection performance.
The effectiveness of the system is limited due to a small dataset size, potential overfitting of the model resulting from the smaller feature size and dataset size, poor interpretability of the DL model, and lower reliability due to unimodal data.
Table 5. Comparison of the DCNN for different CNN layers (% accuracy)
|
CNN Layers |
Accuracy (%) |
TTPs |
Training Tiem (sec) |
|
1-Layer |
91.23 |
1.3 K |
467 sec |
|
2-Layer |
92.45 |
3.7 K |
578 sec |
|
3-Layers |
93.89 |
11.5 K |
748 sec |
|
4-Layers |
95.35 |
39.4 K |
894 sec |
|
5-Layers |
95.41 |
144.3 K |
1104 sec |
|
6-Layers |
95.38 |
341.2 K |
1789 sec |
Table 6. Comparison of the DCNN with the previous state of arts (% accuracy)
|
Authors |
Method |
Accuracy (%) Without Data Augmentation (GAN) |
Accuracy (%) Without Data Augmentation (SMOTE) |
Accuracy (%) with Data Augmentation (GAN) |
|
García-Ordás et al. [26] |
VAE-CNN |
92.31 |
- |
- |
|
Kim et al. [37] |
DNN-SVM-COPN |
83.11 |
- |
- |
|
Kannadasan et al. [38] |
DNN |
86.26 |
- |
- |
|
Proposed Method |
KNN |
81.40 |
82.25 |
83.20 |
|
SVM |
82.85 |
84.10 |
85.45 |
|
|
CT |
83.50 |
84.50 |
86.15 |
|
|
RF |
86.45 |
87.20 |
88.20 |
|
|
DCNN |
92.22 |
93.38 |
95.41% |
This article presents DL-based early diabetic prediction based on medical data such as age, BP, BMI, glucose, insulin, TST, number of pregnancies, and DPF. A one-dimensional DCNN is presented to improve the raw data's distinguishing characteristics, connectivity, and correlation. The efficiency of the proposed diabetic prediction based on GAN-DCNN is evaluated on the Indian PIMA dataset. The proposed methods result in 95.41% accuracy for DCNN-GAN on the Indian PIMA diabetes dataset, which is significantly higher than that of DCNN without data augmentation (92.22%).
In the future, the results of the DCNN system can be enriched by considering more clinical parameters and retinal fundus images for diabetes detection. The system's effectiveness can be validated for the larger dataset and multimodal data. The “Interpretability and Explainability” of the system can be enhanced to boost the user's trust in the diagnosis system.
[1] World Health Organization Diabetes. https://www.who.int/health-topics/diabetes.
[2] National Institute of Diabetes and Digestive and Kidney Diseases. What Is Diabetes? https://www.niddk.nih.gov/health-information/diabetes/overview/what-is-diabetes.
[3] Wee, B.F., Sivakumar, S., Lim, K.H., Wong, W.K., Juwono, F.H. (2024). Diabetes detection based on machine learning and deep learning approaches. Multimedia Tools and Applications, 83(8): 24153-24185. https://doi.org/10.1007/s11042-023-16407-5
[4] Srivastava, R., Dwivedi, R.K. (2022). A survey on diabetes mellitus prediction using machine learning algorithms. In ICT Systems and Sustainability: Proceedings of ICT4SD 2021, pp. 473-480. https://doi.org/10.1007/978-981-16-5987-4_48
[5] Chen, M., Malook, T., Rehman, A.U., Muhammad, Y., et al. (2021). Blockchain-enabled healthcare system for detection of diabetes. Journal of Information Security and Applications, 58: 102771. https://doi.org/10.1016/j.jisa.2021.102771
[6] Alshamlan, H., Taleb, H.B., Al Sahow, A. (2020). A gene prediction function for type 2 diabetes mellitus using logistic regression. In 2020 11th International Conference on Information and Communication Systems (ICICS), Irbid, Jordan, pp. 1-4. https://doi.org/10.1109/ICICS49469.2020.239549
[7] Kopitar, L., Kocbek, P., Cilar, L., Sheikh, A., Stiglic, G. (2020). Early detection of type 2 diabetes mellitus using machine learning-based prediction models. Scientific Reports, 10(1): 11981. https://doi.org/10.1038/s41598-020-68771-z
[8] Sai, P.M.S., Anuradha, G. (2020). Survey on type 2 diabetes prediction using machine learning. In 2020 Fourth International Conference on Computing Methodologies and Communication (ICCMC), Erode, India, pp. 770-775. https://doi.org/10.1109/ICCMC48092.2020.ICCMC-000143
[9] Kantawong, K., Tongphet, S., Bhrommalee, P., Rachata, N., Pravesjit, S. (2020). The methodology for diabetes complications prediction model. In 2020 Joint International Conference on Digital Arts, Media and Technology with ECTI Northern Section Conference on Electrical, Electronics, Computer and Telecommunications Engineering (ECTI DAMT & NCON), Pattaya, Thailand, pp. 110-113. https://doi.org/10.1109/ECTIDAMTNCON48261.2020.9090700
[10] Hameed, E.M., Joshi, H., Kadhim, Q.K. (2025). Advancements in artificial intelligence techniques for diabetes prediction: A comprehensive literature review. Journal of Robotics and Control, 6(1): 345-365. https://doi.org/10.18196/jrc.v6i1.22258
[11] Rajivkannan, A., Aparna, K.S. (2021). A survey on diabetes prediction using machine learning techniques. International Journal of Research in Engineering, Science and Management, 4(11): 51-54.
[12] Zhou, C., Li, A., Hou, A., Zhang, Z., Zhang, Z., Dai, P., Wang, F. (2020). Modeling methodology for early warning of chronic heart failure based on real medical big data. Expert Systems with Applications, 151: 113361. https://doi.org/10.1016/j.eswa.2020.113361
[13] Mohebbi, A., Aradóttir, T.B., Johansen, A.R., Bengtsson, H., Fraccaro, M., Mørup, M. (2017). A deep learning approach to adherence detection for type 2 diabetics. In 2017 39th Annual International Conference of the IEEE Engineering in Medicine and Biology Society (EMBC), Jeju, Korea (South), pp. 2896-2899. https://doi.org/10.1109/EMBC.2017.8037462
[14] Modak, S.K.S., Jha, V.K. (2024). Diabetes prediction model using machine learning techniques. Multimedia Tools and Applications, 83(13): 38523-38549. https://doi.org/10.1007/s11042-023-16745-4
[15] Das, D., Kumar, S., Hussain, M.A., Reddy, B.R. (2025). Diabetes prediction using ensemble learning techniques. Procedia Computer Science, 258: 3155-3164. https://doi.org/10.1016/j.procs.2025.04.573
[16] AlJourishi, M., Abdel-Nabi, H. (2025). Leveraging ensemble learning for multiclass diabetes prediction from health indicators. In 2025 International Conference on New Trends in Computing Sciences (ICTCS), Amman, Jordan, pp. 82-88. https://doi.org/10.1109/ICTCS65341.2025.10989482
[17] Ai, M., Otokozawa, S., Liu, C.T., Asztalos, B.F., et al. (2025). Diabetes mellitus risk prediction in the Framingham Offspring Study and large population analysis. Nutrients, 17(7): 1117. https://doi.org/10.3390/nu17071117
[18] Ge, J., Sun, S., Zeng, J., Jing, Y., et al. (2025). Development and validation of machine learning models for predicting low muscle mass in patients with obesity and diabetes. Lipids in Health and Disease, 24(1): 162. https://doi.org/10.1186/s12944-025-02577-8
[19] Manzini, E., Vlacho, B., Franch-Nadal, J., Escudero, J., et al. (2025). A deep attention-based encoder for the prediction of type 2 diabetes longitudinal outcomes from routinely collected health care data. Expert Systems with Applications, 274: 126876. https://doi.org/10.1016/j.eswa.2025.126876
[20] Abousaber, I. (2025). Enhanced diabetes prediction through advanced machine learning and imbalance handling techniques. In 2025 4th International Conference on Computing and Information Technology (ICCIT), Tabuk, Saudi Arabia, pp. 708-716. https://doi.org/10.1109/ICCIT63348.2025.10989423
[21] Al-Hussein, F., Tafakori, L., Abdollahian, M., Al-Shali, K., Al-Hejin, A. (2025). Predicting type 2 diabetes onset age using machine learning: A case study in KSA. PLoS One, 20(2): e0318484. https://doi.org/10.1371/journal.pone.0318484
[22] Kowsher, M., Turaba, M.Y., Sajed, T., Rahman, M.M. (2019). Prognosis and treatment prediction of type-2 diabetes using deep neural network and machine learning classifiers. In 2019 22nd International Conference on Computer and Information Technology (ICCIT), Dhaka, Bangladesh, pp. 1-6. https://doi.org/10.1109/ICCIT48885.2019.9038574
[23] Soniya, Paul, S., Singh, L. (2020). Application and need-based architecture design of deep neural networks. International Journal of Pattern Recognition and Artificial Intelligence, 34(13): 2052014. https://doi.org/10.1142/S021800142052014X
[24] Ramazi, R., Perndorfer, C., Soriano, E., Laurenceau, J.P., Beheshti, R. (2019). Multi-modal predictive models of diabetes progression. In Proceedings of the 10th ACM International Conference on Bioinformatics, Computational Biology and Health Informatics, Niagara Falls, NY, USA, pp. 253-258. https://doi.org/10.1145/3307339.3342177
[25] Alharbi, A., Alghahtani, M. (2019). Using genetic algorithm and ELM neural networks for feature extraction and classification of type 2-diabetes mellitus. Applied Artificial Intelligence, 33(4): 311-328. https://doi.org/10.1080/08839514.2018.1560545
[26] García-Ordás, M.T., Benavides, C., Benítez-Andrades, J.A., Alaiz-Moretón, H., García-Rodríguez, I. (2021). Diabetes detection using deep learning techniques with oversampling and feature augmentation. Computer Methods and Programs in Biomedicine, 202: 105968. https://doi.org/10.1016/j.cmpb.2021.105968
[27] Pima Indians Diabetes Database. https://www.kaggle.com/datasets/uciml/pima-indians-diabetes-database/.
[28] Bhangale, K., Kothandaraman, M. (2023). Speech emotion recognition based on multiple acoustic features and deep convolutional neural network. Electronics, 12(4): 839. https://doi.org/10.3390/electronics12040839
[29] Bhangale, K., Kothandaraman, M. (2024). Speech emotion recognition using generative adversarial network and deep convolutional neural network. Circuits, Systems, and Signal Processing, 43(4): 2341-2384. https://doi.org/10.1007/s00034-023-02562-5
[30] Bhangale, K., Kadam, S., Chame, S., Saklikar, H. (2024). Machine learning based heart disease prediction using ECG image. In 2024 5th International Conference for Emerging Technology (INCET), Belgaum, India, pp. 1-9. https://doi.org/10.1109/INCET61516.2024.10593572
[31] Linkon, A.A., Noman, I.R., Islam, M.R., Bortty, J.C., et al. (2024). Evaluation of feature transformation and machine learning models on early detection of diabetes mellitus. IEEE Access, 12: 165425-165440. https://doi.org/10.1109/ACCESS.2024.3488743
[32] Shaheen, I., Javaid, N., Alrajeh, N., Asim, Y., Aslam, S. (2024). Hi-le and HiTCLe: Ensemble learning approaches for early diabetes detection using deep learning and explainable artificial intelligence. IEEE Access, 12: 66516-66538. https://doi.org/10.1109/ACCESS.2024.3398198
[33] Gowthami, S., Reddy, R.V.S., Ahmed, M.R. (2024). Exploring the effectiveness of machine learning algorithms for early detection of type-2 diabetes mellitus. Measurement: Sensors, 31: 100983. https://doi.org/10.1016/j.measen.2023.100983
[34] Eboka, A.O., Odiakaose, C.C., Agboi, J., Okpor, M.D., et al. (2025). Resolving data imbalance using a Bi-directional long-short term memory for enhanced diabetes mellitus detection. Journal of Future Artificial Intelligence and Technologies, 2(1): 95-109. https://doi.org/10.62411/faith.3048-3719-73
[35] Montaser, E., Farhy, L.S., Kovatchev, B.P. (2025). Novel detection and progression markers for diabetes based on continuous glucose monitoring data dynamics. The Journal of Clinical Endocrinology & Metabolism, 110(1): 254-262. https://doi.org/10.1210/clinem/dgae379
[36] Rakkiyappan, R., Manavalan, B. (2025). REMED-T2D: A robust ensemble learning model for early detection of type 2 diabetes using healthcare dataset. Computers in Biology and Medicine, 187: 109771. https://doi.org/10.1016/j.compbiomed.2025.109771
[37] Kim, S., Yu, Z.B., Kil, R. M., Lee, M. (2015). Deep learning of support vector machines with class probability output networks. Neural Networks, 64: 19-28. https://doi.org/10.1016/j.neunet.2014.09.007
[38] Kannadasan, K., Edla, D.R., Kuppili, V. (2018). Type 2 diabetes data classification using stacked autoencoders in deep neural networks. Clinical Epidemiology and Global Health, 7(4): 530-535. https://doi.org/10.1016/j.cegh.2018.12.004