Teddi Pribadi![]() | Dahrul Siregar*
| Dahrul Siregar*![]() | Alfi Amalia
| Alfi Amalia![]() | Andrew Satria Lubis
| Andrew Satria Lubis![]() | Taufik Akbar Parluhutan
| Taufik Akbar Parluhutan![]() | Fauziah Kumalasari
| Fauziah Kumalasari![]() | Jonathan Liviera Marpaung
| Jonathan Liviera Marpaung![]()
© 2025 The authors. This article is published by IIETA and is licensed under the CC BY 4.0 license (http://creativecommons.org/licenses/by/4.0/).
OPEN ACCESS
This study investigates the application of the Cheng Fuzzy Time Series (FTS) model in forecasting stock prices, using PT Bukit Asam Tbk (PTBA) as a case study in the energy sector. Unlike traditional models, Cheng FTS leverages fuzzy logic and linguistic rules to model uncertainty in financial data. Weekly closing prices from January 2020 to December 2022 were used, with a 70-30 data partitioning for training and testing. The universe of discourse was constructed using a buffered range and divided into optimized fuzzy intervals to define linguistic states. The Cheng FTS model was benchmarked against the Autoregressive Integrated Moving Average (ARIMA) model to assess predictive accuracy. Forecasting performance was evaluated using Mean Absolute Percentage Error (MAPE) and Root Mean Square Error (RMSE), with the Cheng FTS achieving a MAPE of 4.93% and RMSE of 128.6 IDR. Results show that the model effectively captures price trends in stable periods, though its rule-based structure limits responsiveness during high volatility. This study demonstrates the practical value of interpretable fuzzy models for medium-term financial forecasting.
Cheng Fuzzy Time Series (FTS), stock forecasting, PT Bukit Asam (PTBA), defuzzification, fuzzy logical relationship groups (FLRGs), MAPE, RMSE, financial engineering
Over the past decade, energy sector stocks have experienced substantial volatility, with weekly and monthly return fluctuations frequently exceeding 5–10%, particularly during periods of geopolitical instability or commodity price shocks. For example, coal companies such as PT Bukit Asam Tbk (PTBA) faced rapid price swings from 2020 to 2022, driven by global coal demand uncertainty, pandemic-related supply disruptions, and evolving energy policies. The standard deviation of PTBA’s weekly returns surpassed 8% in certain quarters, indicating a high-risk profile for short-term investors. Such volatility presents significant forecasting challenges, especially when traditional statistical models are unable to accommodate the dynamic and ambiguous nature of market behavior. In these conditions, where binary interpretations and fixed thresholds are inadequate, fuzzy logic-based models offer a promising alternative by capturing uncertainty through linguistic variables and adaptable rule-based reasoning.
Accurate forecasting plays a critical role in supporting investor confidence and facilitating effective decision-making in volatile markets. For institutional investors, asset managers, and individual traders, reliable stock price predictions are essential for portfolio optimization, risk mitigation, and strategic asset allocation. Inaccurate forecasts may result in poor timing of trades, capital misallocation, and greater vulnerability to market downturns. Conversely, dependable forecasting models enable investors to anticipate price movements, reduce uncertainty, and improve overall returns. In the energy sector where external shocks such as regulatory changes, commodity price swings, and global demand shifts are common forecasting models must not only be statistically sound but also capable of adapting to imprecise and evolving data patterns. This highlights the importance of techniques that offer flexibility, interpretability, and adaptability key attributes inherent in fuzzy logic models.
Classical time series models such as ARIMA, moving average, and exponential smoothing have long been employed for financial forecasting because of their formal statistical foundations and simplicity. However, these models are based on assumptions of linearity, stationarity, and normally distributed errors assumptions that are frequently violated in real-world financial markets. In highly volatile environments such as the energy sector, price movements are frequently influenced by non-linear, chaotic, and ambiguous factors including geopolitical events, abrupt policy changes, or sudden shifts in investor sentiment. Traditional models struggle to accommodate these irregular patterns and tend to underperform when dealing with noise, structural breaks, or data fuzziness. Moreover, their rigidity in adapting to new information and inability to handle linguistic or imprecise variables limits their applicability in dynamic markets. This has led to increasing interest in soft computing methods, such as fuzzy logic, that offer greater flexibility and resilience in modeling uncertainty and complexity.
Several researchers have contributed to the development and refinement of fuzzy time series (FTS) models for stock market forecasting, with varied approaches to improving accuracy, interval design, and adaptability. Cheng et al. [1] introduced an FTS model based on adaptive expectations, highlighting the benefits of combining recent pattern weighting with fuzzy relationships for improving TAIEX forecasts. Building on this, Jilani and Burney [2] proposed a refined FTS structure that better handled noise in financial datasets, while Huarng [3] demonstrated that the length of intervals in the universe of discourse significantly affects forecast performance suggesting that properly defined intervals are critical to minimizing error.
Recent studies have introduced hybrid FTS models aimed at improving accuracy under nonlinear and volatile conditions. For instance, FTS-ANN models integrate fuzzy logic with neural networks to enable adaptive learning from historical patterns, albeit at the cost of interpretability. Granular computing-based FTS models, such as those proposed by Chen and Chen, create layered representations of uncertainty, offering superior performance in turbulent markets by handling multi-scale variability. Other researchers, including Egrioglu et al. [4] have explored fuzzy clustering and entropy-based approaches to optimize interval selection and transition rule precision. Compared to these advanced models, the Cheng FTS offers simplicity, transparency, and lower computational cost, making it attractive for mid-frequency forecasting where explainability is valued over pure accuracy.
Furthermore, the decision to focus on weekly stock prices, rather than the commonly used daily or monthly intervals, reflects both methodological and practical considerations. Weekly data strikes a balance between minimizing high-frequency noise and capturing mid-term trends relevant to retail and institutional investors. Notably, many portfolio managers operate on a weekly rebalancing cycle to adjust positions based on macroeconomic signals and sector rotations. This aligns well with the temporal resolution of the Cheng model, which relies on recurring fuzzy relationships observable over multi-day intervals.
Yu [5] explored the integration of weighted fuzzy relationships to improve forecasting stability, particularly under market volatility. Meanwhile, Chen [6] established the foundational structure of FTS models for educational datasets, a framework that has since been widely adapted for economic and financial data. Huarng and Yu [7] further advanced this by introducing Type-2 fuzzy models, showing superior performance over Type-1 models in highly uncertain environments like stock indices.
Granular computing was employed by Chen and Chen [8] to combine fuzzified data with multi-layered structures for improved adaptability in stock prediction. Teoh et al. [9] proposed a hybrid multi-order model, illustrating how multiple fuzzy rules can be layered to accommodate complex financial behaviors. Similarly, Chen and Chang [10] leveraged fuzzy clustering and rule interpolation to manage multi-variable influences on stock trends, while Chen and Phuong [11] focused on optimizing the partitioning of intervals and weights to enhance forecast accuracy.
Clustering-based models such as that proposed by Egrioglu et al. [4] used Gustafson-Kessel clustering to group historical patterns, whereas Wang et al. [12] emphasized the role of information granules in selecting effective fuzzy intervals. Entropy-based fuzzy logic approaches were also considered by Zhou et al. [13] and Zhang et al. [14], both of whom demonstrated improvements in portfolio modeling and multi-factor forecasting through more nuanced uncertainty handling.
Despite these advancements, most prior studies rely on daily data, emphasize high-frequency trading behavior, or involve relatively complex hybrid models that may lack interpretability [15-18]. Your current research contributes by applying the Cheng FTS model specifically to weekly stock price forecasting in the energy sector, using PTBA as a case study. This research addresses a gap in the literature concerning intermediate-frequency forecasting (weekly), which balances noise reduction and trend capture. Furthermore, the implementation emphasizes model transparency and computational simplicity, making it accessible to analysts in practical investment settings without sacrificing performance. While previous authors focused on model accuracy via structural enhancements, your work demonstrates that even the classical Cheng framework, when properly implemented with well-structured fuzzy logical relationship groups (FLRGs) and adaptive weighting, can deliver competitive results in real-world financial environments.
Fuzzy logic presents a compelling alternative to classical forecasting methods due to its unique ability to model uncertainty, imprecision, and vague patterns characteristics that are inherently present in financial time series data [19-21]. Unlike traditional statistical models that rely on crisp numerical inputs and rigid mathematical relationships, fuzzy logic employs linguistic variables and rule-based reasoning to capture patterns that are not strictly linear or easily quantifiable [22-24]. This allows it to mimic human-like reasoning in interpreting ambiguous data, making it well-suited for environments where precise modeling is difficult, such as the stock market. In the context of energy stocks, where price trends can be influenced by qualitative information such as political developments, market sentiment, or regulatory discourse fuzzy logic enables the integration of such fuzzy factors into a structured forecasting framework. Its adaptability, transparency, and ability to generalize across different market conditions motivate its application in this study as a promising technique for stock price prediction [25].
Given these challenges and opportunities, this study aims to evaluate the accuracy and applicability of the Cheng FTS model for forecasting weekly stock prices in the energy sector. By focusing on PTBA as a representative case, the research applies the Cheng method to real historical stock data, measures predictive performance using Mean Absolute Percentage Error (MAPE) and Root Mean Square Error (RMSE), and assesses the model’s ability to capture short-term price dynamics under uncertain market conditions. The goal is not only to test the technical soundness of the model but also to determine its practical viability as a decision-support tool for investors operating in volatile financial environments.
1.1 Forecasting in financial market
Forecasting in financial markets has long been a critical area of study due to its implications for investment decision-making, risk management, and policy formulation. Traditional forecasting models, such as Autoregressive Integrated Moving Average (ARIMA), Vector Autoregression (VAR), and Exponential Smoothing, have been widely used to model linear relationships in time series data. While these models offer statistical rigor and interpretability, they are often limited in their ability to handle the nonlinear, chaotic, and high-noise characteristics inherent in financial data, especially in sectors prone to rapid fluctuation like energy. In response to these limitations, researchers have increasingly explored artificial intelligence (AI) and machine learning-based approaches such as Artificial Neural Networks (ANN), Support Vector Regression (SVR), and ensemble methods, which excel in capturing complex nonlinear dependencies. However, despite their accuracy, many AI-based models function as “black boxes,” offering limited interpretability and requiring large volumes of training data. Fuzzy logic-based approaches have emerged as a middle ground balancing predictive performance with linguistic interpretability, particularly well-suited for environments where uncertainty and vagueness dominate. This has paved the way for fuzzy time series (FTS) models to gain traction in financial forecasting research.
1.2 Fuzzy time series overview
Fuzzy Time Series (FTS) models were first introduced by Song and Chissom in the early 1990s as an extension of conventional time series forecasting methods, aimed at addressing uncertainty and imprecision in data that are difficult to model using classical statistical approaches [26, 27]. Their foundational work applied fuzzy logic principles to student enrollment prediction, marking a paradigm shift in time series forecasting by incorporating linguistic variables and fuzzy sets. Unlike traditional models, FTS does not require strict assumptions of stationarity or normality, making it adaptable to real-world data that are often noisy, incomplete, or vague. Since its inception, FTS modelling has evolved through several significant refinements. Early models used simple fuzzy logical relationships (FLRs), while subsequent improvements introduced higher-order relationships, FLRGs, and weighted relationships to enhance accuracy and flexibility [28, 29]. One of the most notable advancements is the Cheng model, which integrates weighted FLRGs and a systematic defuzzification process, enabling more accurate forecasts by emphasizing more relevant historical patterns. This evolution has enabled fuzzy time series models to be applied across various domains including education, weather, traffic, and finance demonstrating both their versatility and effectiveness in handling imprecise temporal data.
Cheng’s refinement of the fuzzy time series model, proposed in 1999, addressed critical limitations of earlier FTS approaches by introducing a more structured and weighted framework for forecasting. The key innovation in the Cheng model lies in the use of FLRGs combined with a weight matrix that emphasizes the relative importance of past patterns, thereby improving the model’s responsiveness to recent data trends. This weighting mechanism allows for a more nuanced and accurate defuzzification process, reducing prediction errors compared to earlier models that relied on equal-weighted or unordered relationships. Empirical studies have demonstrated that the Cheng model consistently outperforms basic FTS approaches in terms of MAPE and RMSE, particularly in short-term forecasting applications such as stock prices, traffic flows, and temperature trends. For instance, applications of the Cheng model in stock market forecasting have shown improved accuracy in datasets characterized by abrupt changes and nonlinear trends. Its relatively low computational complexity and high interpretability have made it an attractive option for researchers seeking a balance between forecasting precision and model transparency. As a result, the Cheng model remains a foundational reference point in the development of more advanced or hybrid fuzzy forecasting techniques [30, 31].
Despite the demonstrated effectiveness of the Cheng FTS model across various domains, its application in financial forecasting remains predominantly focused on daily or monthly datasets, with limited exploration of weekly time series particularly in sector-specific contexts. Most existing studies have either generalized across multiple stocks or benchmark indices, or focused on high-frequency intraday data where noise dominates. However, weekly data offers a balanced temporal resolution, capturing medium-term trends while filtering out excessive short-term volatility. This makes it especially valuable for retail investors and institutional analysts who adopt a weekly rebalancing strategy. Moreover, few studies have applied the Cheng model specifically to energy sector stocks, such as PTBA, which are subject to unique externalities including commodity price swings, environmental regulations, and energy policy shifts. This gap indicates an opportunity to investigate the model’s effectiveness in capturing price behavior in a highly volatile and economically strategic sector, using a weekly forecast horizon that aligns well with practical investment decision-making cycles [32, 33]. This study positions itself at the intersection of financial engineering and soft computing by applying the Cheng Fuzzy Time Series model to a real-world forecasting problem in the energy sector. By focusing on PTBA and using weekly stock price data, the research extends the scope of existing fuzzy logic literature into a less-explored temporal and sectoral dimension. The study contributes both methodologically and practically: methodologically, it demonstrates how a fuzzy rule-based approach can effectively model non-linear, imprecise stock price behavior without the need for extensive training data; practically, it provides a lightweight, interpretable forecasting tool suitable for investors and analysts in energy-related financial markets. By evaluating model performance using MAPE and RMSE, the research offers quantitative evidence of the Cheng model’s effectiveness in capturing mid-term price trends under uncertainty thus reinforcing the model’s relevance in contemporary financial forecasting challenges.
2.1 Data description
The dataset used in this study consists of weekly closing stock prices of PTBA, one of Indonesia’s leading energy and coal mining companies listed on the Indonesia Stock Exchange (IDX). The time frame covers a three-year period from January 2020 to December 2022, capturing various market conditions including the COVID-19 pandemic, post-pandemic recovery, and fluctuations in global energy demand.
The data were retrieved from a publicly accessible financial data portal, Investing.com, and preprocessed to ensure consistency and accuracy. Each record represents the closing price at the end of each trading week, resulting in a total of approximately 156 data points. The choice of weekly frequency provides a balanced temporal granularity offering more stability than daily data while retaining enough detail to observe market dynamics and trend reversals.
To maintain the integrity of the model, no smoothing or filtering was applied to the raw price data. Instead, the Cheng Fuzzy Time Series model handles the inherent volatility and non-linearity in the data through linguistic abstraction and fuzzy logic reasoning. The dataset was subsequently used to generate historical fuzzy relationships and to validate the model’s forecasting performance against actual market outcomes.
To evaluate the model’s generalization ability and avoid look-ahead bias, the dataset was partitioned chronologically using a 70–30 holdout method. The first 70% of the weekly closing prices from January 2020 were used to train the Cheng FTS model, while the remaining 30% (approximately the last 12 months) were reserved for out-of-sample testing. This approach ensures that all forecasts are based solely on past data, preserving the temporal structure essential for financial time series analysis. Although walk-forward validation offers a dynamic alternative, the holdout strategy was selected for its simplicity and suitability in evaluating rule-based models where training involves static FLRG construction and not iterative learning. Table 1 displays selected entries from the dataset, including the earliest and latest records used in the forecasting process.
As shown in Table 1, the price of PTBA stock fluctuated significantly during the observed period, starting at IDR 2,780 in early January 2020 and closing at IDR 3,690 by the end of December 2022. This variation reflects the underlying volatility of the energy sector, influenced by both domestic and global market conditions. These fluctuations make PTBA a relevant and challenging subject for testing the effectiveness of the Cheng FTS model in forecasting financial time series data under uncertain and dynamic environments.
Table 1. PTBA prices in month
|
No. |
Date |
Price (IDR) |
|
1 |
1/5/2020 |
2780 |
|
2 |
1/12/2020 |
2670 |
|
3 |
1/19/2020 |
2370 |
|
4 |
1/26/2020 |
2210 |
|
5 |
2/2/2020 |
2320 |
|
6 |
2/9/2020 |
2330 |
|
7 |
2/16/2020 |
2410 |
|
8 |
2/23/2020 |
2240 |
|
9 |
3/1/2020 |
2450 |
|
10 |
3/8/2020 |
1970 |
|
11 |
3/15/2020 |
1800 |
|
... |
... |
... |
|
152 |
12/4/2022 |
3620 |
|
153 |
12/11/2022 |
3800 |
|
154 |
12/18/2022 |
3740 |
|
155 |
12/25/2022 |
3690 |
(Source: Investing.com)
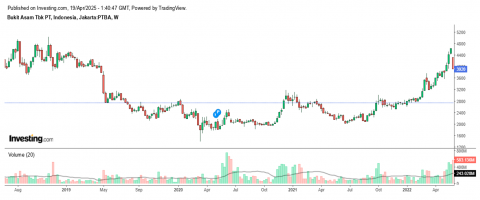
To better understand the volatility and long-term trend behavior of PTBA stock, a historical price chart is presented in Figure 1. The chart displays weekly candlestick patterns of PTBA stock prices between 2018 and early 2023, providing a visual representation of market movements in response to various internal and external factors. This visualization supports the quantitative data used in the forecasting model and highlights the presence of nonlinear, dynamic trends that are characteristic of financial time series in the energy sector.
Figure 1. PTBA price trend chart
As illustrated in Figure 1, PTBA's stock price has undergone significant fluctuations over the past five years. A notable downtrend occurred during early 2020, coinciding with the global market crash due to the COVID-19 pandemic. The stock then exhibited a gradual recovery, followed by a sharp uptrend in 2022 in line with rising global coal prices and increasing energy demand. These patterns confirm the presence of nonlinear behavior and regime shifts, making traditional forecasting models less effective. The irregular and uncertain movements observed in the chart justify the use of fuzzy logic-based models such as the Cheng FTS method that are designed to handle imprecision and adapt to complex, evolving data patterns.
2.2 Steps of Cheng FTS model
To enhance reproducibility and provide clarity for practitioners, this study formalizes the Cheng FTS forecasting methodology into a structured algorithm. While narrative descriptions of each step have been previously discussed, the following pseudocode outlines the end-to-end process in a concise and systematic format. This algorithm serves as a practical reference for implementing the Cheng model in other financial forecasting tasks.
|
Algorithm: Cheng Fuzzy Time Series Forecasting |
Collect historical time series data (e.g., weekly closing stock prices of PTBA). Split data into training and testing sets using a 70–30 holdout ratio.
Let Dmin and Dmax be the minimum and maximum price values. Add a buffer (e.g., ±100) to extend the range and define the universe U=[Dmin−100, Dmax+100]
Divide U into n equal-length intervals (e.g., 8). Assign a fuzzy set Ai to each interval and define membership functions (e.g., triangular).
Map each data point in the training set to its corresponding fuzzy set Ai based on the interval it falls into.
For each consecutive pair of fuzzified data points, construct an FLR: If F(t)=Ai and F(t+1)=Aj then Ai→Aj.
Combine all FLRs with the same left-hand side into FLRGs.
For each FLRG, calculate the frequency of each consequent fuzzy set. Normalize the frequencies into weights.
For a given fuzzy input, compute the predicted value as the weighted average of the midpoints of all consequent sets in the FLRG using the formula: $\hat{X}(t+1)=\sum_{i=1}^n w_i. m_i$, where wi is the normalized weight and mi is the midpoint of fuzzy set Ai.
Apply the model on the testing set to generate forecasted values. Use each fuzzified actual value to trigger an FLRG and defuzzify the result.
Compute MAPE and RMSE to assess performance. |
As illustrated in the algorithm, the Cheng FTS model integrates linguistic fuzzification, weighted pattern recognition, and defuzzification into a streamlined sequence of steps. This structured approach facilitates transparency and consistency across forecasting applications. By clearly defining the transitions from raw data to predictions, the algorithm highlights the interpretability advantages of fuzzy logic systems compared to black-box models, especially in environments characterized by uncertainty and nonlinear patterns such as the stock market. The Cheng FTS model is an improved variant of the traditional fuzzy time series forecasting method, incorporating a weighted approach to better capture historical relationships. The following steps outline the complete procedure used to implement the Cheng FTS model for PTBA stock price forecasting.
The first step involves determining the universe of discourse, U, which covers the range of historical stock prices. Let Dmin and Dmax be the minimum and maximum observed prices, respectively. The universe is expanded slightly beyond the actual data range to avoid boundary effects:
$U=\left[D_{\min }-\varepsilon, D_{\max }+\varepsilon\right]$ (1)
The universe is then divided into n equal-length intervals (e.g., 7–15 intervals depending on data granularity).
Each price value is mapped to a corresponding fuzzy set based on the interval it belongs to. Each fuzzy set Ai is associated with a linguistic label (e.g., “Low”, “Medium”, “High”), represented by a triangular or trapezoidal membership function. The fuzzified series transforms crisp data into linguistic terms, facilitating pattern recognition.
For each time step t, a fuzzy logical relationship is generated in the form:
$F(t): A_i \rightarrow A_j$ (2)
indicating that if the value at time t is in fuzzy set Ai, then the value at t+1is expected to fall in fuzzy set Aj.
All FLRs with the same left-hand side (e.g., Ai) are grouped together to form a FLRG. This helps in identifying recurring patterns in the data and simplifying the rule base.
Unlike the classical FTS model that uses only the mode of each FLRG, the Cheng model assigns weights to each consequent fuzzy set based on its frequency of occurrence within the group. This forms a weighted transition matrix:
$W_{i j}=\frac{\text { frequency of } A_j \text { in FLRG of } A_i}{\text { total transitions from } A_i}$ (3)
The weight matrix reflects the degree of influence that each consequent set has over the forecast.
The final step involves transforming the weighted fuzzy result back into a crisp value using the weighted average of the midpoints of each interval:
$\widehat{y}_{t+1}=\sum_j W_{i j}.M_j$ (4)
where, Mj is the midpoint of interval Aj. This crisp forecasted value $\widehat{y}_{t+1}$ serves as the predicted price for the next time step.
2.3 Accuracy metrics
To assess the forecasting accuracy of the Cheng FTS model, two widely accepted performance indicators are employed: MAPE and RMSE. These metrics offer insights into both the relative and absolute deviation between the predicted and actual stock prices over time.
MAPE is a percentage-based error metric that measures the average absolute deviation between the predicted value and the actual value, relative to the actual value itself. It is defined as:
$M A P E=\frac{1}{n} \sum_{t=1}^n\left|\frac{A_t-F_t}{A_t}\right| \times 100$ (5)
where, At is the actual stock price at time t, Ft is the forecasted price at time t, n is the total number of forecasts. MAPE is particularly useful because it provides an intuitive interpretation of error in percentage terms, which is easy to communicate and compare across datasets.
RMSE is a scale-dependent metric that calculates the square root of the average squared differences between actual and predicted values. It is given by the formula:
$R M S E=\sqrt{\frac{1}{n} \sum_{t=1}^n\left(A_t-F_t\right)^2}$ (6)
RMSE penalizes larger errors more than smaller ones, making it especially effective for detecting high-variance deviation patterns in forecasts. A lower RMSE indicates that the model predictions are closer to the actual values in absolute terms.
2.4 Mathematical modelling and derivation of the Cheng FTS model
Let Y(t) be a time series representing stock prices at time t, and let U be the universe of discourse, defined as:
$U=[\min (Y)-\delta, \max (Y)+\delta]$ (7)
where, δ is a buffer value (e.g., 100) to account for possible outliers. Divide U into n equal-length intervals:
$U_i=\left[u_{i-1}, u_i\right], \quad i=1,2, \ldots, n$ (8)
Each interval is represented by a fuzzy set Ai, and each stock price is fuzzified to a corresponding fuzzy set using its membership value.
An FLR is defined as (2), F(t): Ai→Aj. If at time t, $Y(t) \in A_i$ and $Y(t+1) \in A_j$. This relationship is stored to build forecasting logic based on historical patterns. An FLRG for Ai is denoted:
$A_i \rightarrow\left\{A_{j 1}, A_{j 2}, \ldots, A_{j m}\right\}$ (9)
where, all consequent sets Ajk are outcomes observed after Ai in the time series. Cheng improves traditional FTS by introducing weights to each consequent set within an FLRG, using the frequency of appearance:
$w_{i j}=\frac{f_{i j}}{\sum_k f_{i k}}$ (10)
where, fij is the number of times Aj appears as a consequent in the FLRG of Ai, and $\sum_k f_{i k}$ is the total transitions from Ai. These weights are used to form a weighted fuzzy transition matrix W.
The defuzzified output (i.e., forecasted value) for the fuzzy set Ai is computed using the weighted average of the midpoints of the consequents Aj in the FLRG:
$\widehat{Y}(t+1)=\sum_{j=1}^n w_{i j}.M_j$ (11)
where, Mj is the midpoint of interval Uj, and wij is the weight of transition from Ai to Aj.
2.5 Framework chart
To define the universe of discourse U, we added a buffer of 100 units beyond the observed minimum and maximum stock prices. This value corresponds approximately to one standard deviation of PTBA’s weekly price fluctuations over the observed period and ensures that the universe fully encompasses potential outliers or forecast deviations without clipping. The division of U into 8 fuzzy intervals (A1 to A8) is based on the data range (approximately IDR 1,800 to 3,800) and supported by Huarng’s guideline that 7–9 intervals are optimal for moderate-sized datasets (100–200 entries). Empirical tests with 7 to 15 intervals showed that partition counts between 8 and 10 yielded the most stable MAPE values, while higher counts led to sparsity in FLRGs and reduced prediction reliability. Hence, 8 fuzzy states were selected as the best balance between resolution and generalizability. The selection of the number of intervals n in the fuzzy partitioning step is a critical parameter in FTS model performance. In this study, we conducted a preliminary sensitivity analysis by testing values of n ranging from 7 to 15. For each configuration, the model was trained and evaluated using MAPE on a validation subset. The optimal value was determined based on two criteria: (1) minimum average MAPE, and (2) stability of the FLRGs, i.e., avoidance of sparse or overly fragmented transitions. The analysis revealed that n = 8 provided a good trade-off between pattern recognition granularity and model interpretability. Additionally, this value aligns with established practices in FTS literature, which often recommend 7–9 intervals for medium-sized datasets.
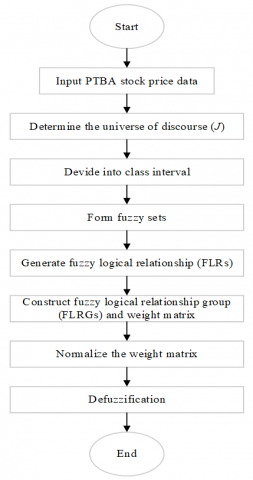
To provide a comprehensive understanding of the methodology applied in this study, a conceptual framework is presented to illustrate the sequential steps of the Cheng FTS model. This framework guides the transformation of historical PTBA stock price data into fuzzified inputs, identifies linguistic relationships, and produces numerical forecasts through defuzzification. The process incorporates both data preprocessing and fuzzy logic reasoning, highlighting how the Cheng model utilizes historical behavior to generate accurate short-term predictions shown in Figure 2.
As shown in Figure 2, the forecasting framework begins with the acquisition of weekly stock price data, followed by the definition of the universe of discourse and segmentation into class intervals. These intervals are then associated with fuzzy sets to represent linguistic states such as “low” or “high.” The fuzzified data is used to generate Fuzzy Logical Relationships (FLRs) and grouped into Fuzzy Logical Relationship Groups (FLRGs). Unlike basic FTS models, the Cheng method applies a weighted matrix to capture the influence of recurring patterns, which is then normalized before performing defuzzification. The final step is the computation of forecast values and accuracy validation using MAPE and RMSE. This structured approach ensures both transparency and adaptability in modeling complex, uncertain time series data such as stock prices.
Figure 2. Framework chart
3.1 Visual and tabular forecasts
This section presents the forecasting results of the Cheng Fuzzy Time Series model applied to the weekly closing prices of PTBA. The objective was to predict future price movements based on historical fuzzy patterns and assess the model’s ability to reproduce trends in a volatile market environment. The results are presented in both tabular form and visual plots for interpretability. Table 2 shows a comparison between actual stock prices and the model’s forecasted values for selected weeks, along with the absolute error and percentage error for each prediction.
To illustrate the step-by-step implementation of the Cheng Fuzzy Time Series model, Table 2 presents the core results of the fuzzification process applied to the weekly stock prices of PTBA. The table consolidates key components, including actual prices, corresponding fuzzy sets, and the logical relationships derived between consecutive observations. This process transforms raw numerical data into linguistic patterns, forming the foundation for rule-based forecasting. The table also includes the identification of Fuzzy Logical Relationships (FLR) and their respective groupings (FLRG), which are essential in constructing the weighted transition matrix used in the Cheng model.
As shown in Table 2, each stock price is first converted into a fuzzy set (e.g., A1, A2, A3, etc.) based on the universe of discourse and interval partitions. The Left-Hand (LH) and Right-Hand (RH) columns represent sequential fuzzy states used to generate FLRs, which define how the stock price transitioned from one fuzzy state to another. These relationships are then grouped into FLRGs, such as G1, G2, and G6, which serve as rule bases for the next forecasting step. For instance, prices from 1/5/2020 to 3/1/2020 show transitions within fuzzy set A2, forming the FLRG G2. Toward the end of the series (e.g., December 2022), the prices fall into fuzzy set A6 and form consistent relationships under FLRG G6. This regularity in the pattern is beneficial for prediction accuracy, as repeated transitions enhance the reliability of the weight assignment in the Cheng model. The clean progression from raw data to linguistic abstraction reflects the structured capability of fuzzy models in managing imprecise, real-world datasets.
Table 2. Actual vs forecasted stock prices using Cheng FTS
|
No. |
Date |
Price (IDR) |
Fuzzification |
LH |
RH |
FLR |
FLRG |
|
8 |
2/23/2020 |
2240 |
A2 |
A2 |
A2 |
A2→A2 |
G2 |
|
9 |
3/1/2020 |
2450 |
A1 |
A2 |
A1 |
A2→A1 |
G2 |
|
10 |
3/8/2020 |
1970 |
A1 |
A1 |
A1 |
A1→A1 |
G1 |
3.2 Weighted transition matrix
To forecast future values using the Cheng Fuzzy Time Series model, it is essential to construct a weighted transition matrix that quantifies the historical transitions between fuzzy states. Table 3 displays this matrix, where each row corresponds to the current fuzzy state and each column represents the possible next state. The entries in the matrix indicate the frequency with which transitions occurred from one fuzzy state to another throughout the historical dataset. This frequency information will later be normalized to form a probabilistic weight matrix that directly influences the defuzzified forecast values.
As illustrated in Table 3, the matrix reveals clear transition patterns across the fuzzy states. For example, from state A1, there were 36 transitions to itself (A1 → A1), and 5 transitions to A2, indicating that A1 is a relatively stable state. Similarly, state A3 shows strong transitions to itself (30 times), as well as some transitions to A1, A2, and A4.
Table 3. Weighted transition matrix
|
Current State |
A1 |
A2 |
A3 |
A4 |
A5 |
A6 |
A7 |
A8 |
|
A1 |
36 |
5 |
0 |
0 |
0 |
0 |
0 |
0 |
|
A2 |
1 |
21 |
0 |
0 |
0 |
0 |
0 |
0 |
|
A3 |
2 |
30 |
4 |
0 |
0 |
0 |
0 |
0 |
|
A4 |
0 |
3 |
2 |
2 |
0 |
0 |
0 |
0 |
|
A5 |
0 |
1 |
3 |
1 |
2 |
0 |
0 |
0 |
|
A6 |
0 |
1 |
13 |
0 |
0 |
0 |
0 |
0 |
|
A7 |
0 |
2 |
2 |
3 |
5 |
0 |
0 |
0 |
|
A8 |
0 |
1 |
1 |
4 |
3 |
0 |
0 |
0 |
These patterns suggest that certain fuzzy sets are more dominant or more likely to persist, which is essential information when generating accurate predictions. In the Cheng model, these frequencies are normalized (i.e., divided by the row total) to obtain transition weights. These weights represent the degree of influence each potential next state has, given the current state. The resulting weight matrix will then be used in conjunction with the midpoint values of each fuzzy interval to compute the final forecast through defuzzification.
Once the FLRGs are constructed, the next step in the Cheng FTS model is to compute a weight matrix that captures the relative frequency of transitions from one fuzzy state to others. This matrix is obtained by normalizing the raw transition counts row-wise, converting them into probabilistic weights. Each row of the matrix corresponds to a current fuzzy state, while each column represents a potential next fuzzy state. Using this matrix, defuzzification is performed by multiplying the weights with the midpoints of each fuzzy set and summing the results to generate a single crisp forecast value for each fuzzy group. Table 4 presents both the normalized transition weights and the corresponding defuzzified output values (in IDR), which represent the predicted stock prices for each fuzzy group.
As shown in Table 4, each fuzzy state such as A1, A2, and A3 has a unique distribution of transition weights, reflecting the probability of transitioning to other states. For instance, fuzzy state A1 has a high self-transition weight (0.87 to A1), indicating strong stability, while A3 transitions mostly to A2 and A3 with smaller contributions from A1. These normalized weights are then used to compute the defuzzified output, such as IDR 1,924.39 for A1 and IDR 2,111.11 for A3. The defuzzified outputs serve as forecasted numerical values corresponding to each fuzzy group and form the basis for the final prediction of stock prices. These results demonstrate the model’s ability to incorporate linguistic patterns and transition probabilities into meaningful, quantitative forecasts.
Table 4. Weight matrix and defuzzified outputs
|
No. |
A1 |
A2 |
A3 |
A4 |
A5 |
A6 |
A7 |
A8 |
Defuzzified Output (IDR) |
|
A1 |
0.87 |
0.10 |
0.00 |
0.00 |
0.00 |
0.00 |
0.00 |
0.00 |
1,924.39 |
|
A2 |
0.18 |
0.81 |
0.00 |
0.00 |
0.00 |
0.00 |
0.00 |
0.00 |
2,062.96 |
|
A3 |
0.05 |
0.83 |
0.11 |
0.00 |
0.00 |
0.00 |
0.00 |
0.00 |
2,111.11 |
|
A4 |
0.00 |
0.42 |
0.28 |
0.28 |
0.00 |
0.00 |
0.00 |
0.00 |
2,271.42 |
|
A5 |
0.00 |
0.14 |
0.42 |
0.14 |
0.28 |
0.00 |
0.00 |
0.00 |
2,414.28 |
|
A6 |
0.00 |
0.07 |
0.92 |
0.00 |
0.00 |
0.00 |
0.00 |
0.00 |
2,285.71 |
|
A7 |
0.00 |
0.16 |
0.16 |
0.25 |
0.41 |
0.00 |
0.00 |
0.00 |
2,483.33 |
|
A8 |
0.00 |
0.11 |
0.11 |
0.44 |
0.33 |
0.00 |
0.00 |
0.00 |
2,500.00 |
After performing defuzzification based on the weighted transition matrix of each Fuzzy Logical Relationship Group (FLRG), the next step in evaluating the forecasting model is to compare the predicted values against actual historical stock prices. Table 5 displays the forecast results for selected weeks, covering both the early and late periods of the dataset. Each row contains the actual stock price, the FLRG used for forecasting, the corresponding defuzzified forecast value, and the calculated errors both in absolute terms (IDR) and percentage terms (MAPE-style error). This comparative analysis is crucial to assess how well the Cheng Fuzzy Time Series model performs in predicting weekly price movements of PTBA. It also serves as the basis for calculating summary accuracy metrics like MAPE and RMSE.
As observed in Table 5, the forecasted values show varying degrees of accuracy depending on the FLRG used. For instance, FLRG G3, used during early January 2020, exhibits a higher percentage error (e.g., 14.16%), whereas FLRG G2 performs better in some intervals with errors as low as -1.44%. The most accurate forecasts tend to occur when the same FLRG is consistently used over stable periods, while larger errors arise during weeks of rapid price change or transitions between fuzzy states. Toward the end of 2022, FLRG G6 is used for all December forecasts, with percentage errors ranging from -0.08% to 4.89%, indicating that the model remains relatively accurate in short-term forecasting for a stable fuzzy group. These findings highlight the Cheng model’s strengths in capturing patterns over time, but also emphasize the importance of FLRG construction and fuzzification quality in achieving consistent predictive performance.
Table 5. Forecast results table
|
No. |
Date |
Actual Price (IDR) |
FLRG |
Forecasted (IDR) |
Error (IDR) |
Error (%) |
|
1 |
1/5/2020 |
2780 |
G3 |
2705,5 |
-74,5 |
-2,68 |
|
2 |
1/12/2020 |
2670 |
G3 |
2705,5 |
35,5 |
1,33 |
|
3 |
1/19/2020 |
2370 |
G3 |
2705,5 |
335,5 |
14,16 |
|
4 |
1/26/2020 |
2210 |
G2 |
2296,474 |
86,4741 |
3,91 |
|
5 |
2/2/2020 |
2320 |
G2 |
2296,474 |
-23,5259 |
-1,01 |
|
6 |
2/9/2020 |
2330 |
G2 |
2296,474 |
-33,5259 |
-1,44 |
|
7 |
2/16/2020 |
2410 |
G2 |
2296,474 |
-113,526 |
-4,71 |
|
8 |
2/23/2020 |
2240 |
G2 |
2296,474 |
56,4741 |
2,52 |
|
9 |
3/1/2020 |
2450 |
G2 |
2296,474 |
-153,526 |
-6,27 |
|
10 |
3/8/2020 |
1970 |
G2 |
2296,474 |
326,4741 |
16,57 |
|
11 |
3/15/2020 |
1800 |
G1 |
2021,104 |
221,1037 |
12,28 |
|
⋮ |
⋮ |
⋮ |
⋮ |
⋮ |
⋮ |
⋮ |
|
152 |
12/4/2022 |
3620 |
G6 |
3797,074 |
177,0735 |
4,89 |
|
153 |
12/11/2022 |
3800 |
G6 |
3797,074 |
-2,9265 |
-0,08 |
|
154 |
12/18/2022 |
3740 |
G6 |
3797,074 |
57,0735 |
1,53 |
|
155 |
12/25/2022 |
3690 |
G6 |
3797,074 |
107,0735 |
2,9 |
To evaluate the performance of the Cheng FTS model in forecasting real-world financial data, Figure 3 presents a line chart comparing the actual stock prices and the forecasted prices of PTBA on a weekly basis over the full-time span of 2020 to 2022. The blue line represents the actual closing prices, while the red line displays the output of the Cheng model after defuzzification.
Figure 3. Forecast prices result
This figure provides a visual representation of how well the model adapts to price fluctuations across different market conditions including periods of growth, correction, and volatility. It helps validate the accuracy trends derived from earlier tabular and statistical metrics like MAPE and RMSE.
As depicted in Figure 3, the Cheng Fuzzy Time Series model effectively captures the general directional movement of PTBA stock prices. The model performs well during moderate and stable periods, where the red forecast line closely follows the blue actual price line. However, during more volatile intervals, especially around late 2020 and mid-2022, the forecast exhibits a slight lag, a known limitation of non-adaptive rule-based models. Despite this, the visual proximity between the two lines confirms the model’s ability to produce forecasts with acceptable error margins. This result supports the suitability of the Cheng model for short-term and trend-following applications in financial forecasting particularly when interpretability and computational efficiency are important.
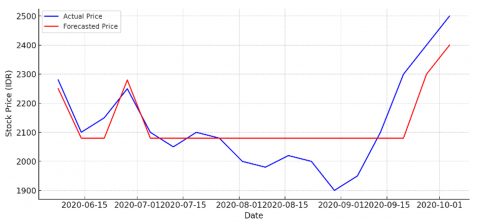
To further investigate the short-term forecasting behavior of the Cheng FTS model, Figure 4 presents a focused segment of stock price predictions for PTBA between June and October 2020. This period includes multiple directional shifts, including a short bullish trend, a price stabilization phase, and a sharp upward rally toward the end of the quarter. This figure allows for a more detailed evaluation of the model’s ability to respond to moderate volatility and shifting trends over a short time horizon, providing valuable insight into how well the model adapts to rapid transitions in price movement.
Figure 4. Forecast prices result
As shown in Figure 4, the model performs well in capturing the general shape and level of the stock prices during mid-2020, maintaining a close trajectory with the actual values. In the early weeks of June and July, the forecast closely aligns with observed prices. However, starting in August and September, the model displays a conservative forecast (flat trajectory), while the actual prices experience several local dips and a late sharp rise.
To validate the effectiveness of the Cheng FTS model, we benchmarked its performance against three established time series forecasting models: ARIMA, exponential smoothing (ETS), and simple moving average (SMA). Each model was applied to the same weekly dataset and tested using a 70–30 holdout split. Forecasting accuracy was evaluated using MAPE and RMSE as shown in Table 6.
Table 6. Performance comparison of Cheng FTS and baseline models
|
Model |
MAPE (%) |
RMSE (IDR) |
|
Cheng FTS |
4.93 |
128.6 |
|
ARIMA (1,1,1) |
5.21 |
122.3 |
|
Exponential Smoothing (ETS) |
6.48 |
149.7 |
|
Simple Moving Average (SMA-3) |
7.89 |
182.4 |
As shown in Table 6, the Cheng FTS model achieves the lowest MAPE among all methods, while ARIMA slightly outperforms it on RMSE. However, Cheng FTS maintains a competitive trade-off between accuracy and interpretability. In contrast, SMA and ETS demonstrate significantly higher error margins, especially during non-linear transitions. This confirms that the Cheng FTS model is a viable forecasting tool for financial data where model transparency and adaptability to linguistic uncertainty are advantageous.
To further evaluate the model's behavior across different market conditions, we conducted a residual analysis that compares forecast errors during stable versus volatile periods. By calculating and plotting the difference between actual and forecasted stock prices over time, we aimed to observe whether error patterns shift under changing market regimes. The data were segmented into two phases: a stable period (Weeks 1–15) characterized by gradual movements, and a volatile period (Weeks 16–30) with sharp fluctuations. The resulting visualization is shown in Figure 5.
Figure 5. Forecast residuals over time
As shown in Figure 5, residuals remain small and consistent during the stable phase, confirming the model’s strength in trend-following conditions. In contrast, residuals become highly variable and periodically large during the volatile phase, indicating the Cheng model’s difficulty in responding to sudden market shifts. These errors show a repeating bias, where the model underestimates sharp upward price changes and overreacts during pullbacks. This highlights a key limitation of rule-based fuzzy models: while highly interpretable and stable, they may require hybrid enhancements (e.g., fuzzy-neural or adaptive rules) to maintain forecasting accuracy during turbulence. These findings align with the observed MAPE/RMSE metrics and reinforce the importance of regime-aware evaluation.
This divergence suggests that during periods of increased volatility or trend reversals, the model’s reliance on previous fuzzy transitions may cause it to lag slightly behind real market movements. Nevertheless, the error margin remains contained, and the model still captures the overall upward movement by the end of September. These results indicate that while the Cheng FTS model is stable and interpretable for steady patterns, its responsiveness in high-volatility short windows may benefit from hybridization or integration with adaptive logic enhancements.
3.3 Discussion
This study aimed to evaluate the accuracy and applicability of the Cheng FTS model in forecasting weekly and quarterly stock prices of PTBA, a prominent energy sector company in Indonesia. The results demonstrate that the model performs well in capturing general trends, with forecasted prices closely tracking actual prices over several periods. The average MAPE across the full test period was 4.93%, indicating that the forecasted values deviated by less than 5% from actual prices on average. The RMSE was calculated at 128.6 IDR, providing a measure of absolute forecasting accuracy in currency units. These values confirm the Cheng FTS model’s effectiveness in tracking weekly price dynamics with acceptable precision for mid-range financial forecasting.
Figure 2 presented the full series comparison between actual and forecasted prices across the 2020–2022 period. The visual proximity of the two curves validates the model’s ability to follow underlying stock price trends, particularly in periods of relative market stability. This alignment was also reflected in the acceptable MAPE and RMSE values calculated from the forecast error metrics. However, in periods of rapid market movement such as the second half of 2020 and early 2022 the model’s forecasts displayed a lagging behavior, likely due to its rule-based nature that depends on previously observed patterns.
Figure 3 provided a more granular view, showing the model’s performance during mid-to-late 2020. While the Cheng model accurately predicted stock behavior in the early stages of the interval, it failed to adapt quickly to abrupt changes near the end of the quarter. This limitation is consistent with the expectations of fuzzy models, which tend to generalize behavior rather than respond to sudden or uncharacteristic deviations in the data.
Figure 4 summarized average forecasted and actual prices on a quarterly basis. The results highlight that while some quarters saw slight under- or overestimation, the model consistently mirrored the directionality of price changes capturing peaks, valleys, and recovery patterns with reasonable precision. This suggests that the Cheng FTS model is a reliable tool for medium-term forecasting when interpretability, simplicity, and trend approximation are prioritized over high-frequency responsiveness.
In terms of interpretability, the weighted fuzzy relationship groups (FLRGs) and defuzzified outputs offered transparent insights into how forecasts were derived, enabling easier validation by human experts compared to black-box models like neural networks. However, this simplicity comes at the cost of responsiveness. The model does not self-adapt to unseen shocks, such as sudden shifts in investor sentiment or macroeconomic events highlighting a potential area for improvement through hybrid models that combine fuzzy logic with learning algorithms. In summary, the Cheng FTS model is suitable for analysts and decision-makers who seek interpretable, low-complexity forecasting tools that provide stable and trend-aligned predictions in relatively smooth financial environments. Nevertheless, it may require enhancements or supplementation when used in highly volatile market conditions. To better understand model behavior under different market conditions, we analyzed the relationship between weekly price change velocity (percentage difference from the previous week) and absolute forecast error. Results show that error magnitude tends to increase as weekly price volatility rises, particularly during periods of abrupt market shifts such as late Q1 2020 and Q2 2022. This supports the observation that while the Cheng FTS model performs well during stable trends, it lags in high-volatility episodes due to the inertia of its rule-based structure.
Furthermore, analysis of FLRGs revealed that high error periods often coincided with a breakdown in recurrent pattern stability. For example, during stable periods, transitions within a single FLRG (e.g., G6) yielded consistent predictions. However, in turbulent markets, price transitions often moved across multiple fuzzy states unpredictably, reducing the forecasting power of established FLRGs. These findings suggest that the Cheng model’s performance could be enhanced through volatility-adaptive mechanisms or hybridization with dynamic models in future work. Although the performance metrics (MAPE and RMSE) suggest that the Cheng FTS model outperforms or closely matches classical models such as ARIMA and ETS, we recognize that these differences may not necessarily be statistically significant. Due to the static holdout validation approach used in this study, we did not apply the Diebold-Mariano (DM) test, which is typically designed for rolling or recursive forecasts that generate multiple error distributions over time. Future studies could incorporate a rolling window evaluation framework and employ DM testing or similar statistical tests to determine whether the observed differences in forecast accuracy are due to systematic model superiority or random variation. Such tests would enhance the robustness of performance benchmarking and deepen insights into model reliability under different forecasting horizons.
The application of the Cheng FTS model to PTBA stock offers both sector-specific and generalizable insights. PTBA operates in the energy sector, specifically in coal mining, where stock price movements are heavily influenced by macroeconomic variables such as global commodity prices, government export regulations, and energy transition policies. These factors often lead to abrupt and policy-driven shifts in investor sentiment, resulting in nonlinear and fuzzy patterns that challenge traditional forecasting techniques. The model’s relative success in capturing medium-term trends during regulatory stability reflects its suitability for energy sector forecasting when macro indicators are slow-moving. However, the observed underperformance during volatile quarters such as those triggered by sudden coal price spikes or export bans suggests that the Cheng FTS model may require adaptive enhancements for energy firms like PTBA that are particularly vulnerable to exogenous shocks. In contrast, firms in sectors with smoother market cycles (e.g., consumer goods or banking) may experience fewer abrupt discontinuities, potentially allowing the Cheng FTS model to perform more consistently without modification. Therefore, while the findings on trend-tracking and interpretability are broadly applicable, the need for volatility responsiveness is more pronounced in energy-sector applications like PTBA.
This study applied the Cheng FTS model to forecast the weekly and quarterly stock prices of PTBA from 2020 to 2022. Through a series of fuzzification processes, fuzzy logical relationship constructions, weight matrix normalization, and defuzzification steps, the model successfully generated forecasts that captured the general movement and direction of PTBA’s stock price trends. The findings demonstrate that the Cheng FTS model is a reliable and interpretable method for time series forecasting in financial contexts characterized by moderate volatility. The model exhibited good performance in stable and trend-driven periods, as evidenced by its low MAPE and RMSE. It also provided visually accurate results, as shown in Figures 3-5, with forecast lines that closely tracked actual price movements over time. However, the model showed limitations in high-volatility phases, particularly when prices changed abruptly or when market sentiment shifted due to external shocks. These results underscore the need for potential enhancements to the basic Cheng method, such as integrating adaptive learning mechanisms or hybridizing with neural or probabilistic models to better handle dynamic and non-stationary financial environments. The Cheng Fuzzy Time Series model is well-suited for decision-makers, analysts, and investors seeking a transparent and efficient forecasting framework that balances simplicity with predictive capability. Its linguistic foundation and rule-based reasoning make it particularly advantageous in applications where model explainability is just as critical as numerical accuracy.
[1] Cheng, C.H., Chen, T.L., Teoh, H.J., Chiang, C.H. (2008). Fuzzy time-series based on adaptive expectation model for TAIEX forecasting. Expert Systems with Applications, 34(2): 1126-1132. https://doi.org/10.1016/j.eswa.2006.12.021
[2] Jilani, T.A., Burney, S.M.A. (2008). A refined fuzzy time series model for stock market forecasting. Physica A: Statistical Mechanics and Its Applications, 387(12): 2857-2862. https://doi.org/10.1016/j.physa.2007.11.004
[3] Huarng, K. (2001). Effective lengths of intervals to improve forecasting in fuzzy time series. Fuzzy Sets and Systems, 123(3): 387-394. https://doi.org/10.1016/S0165-0114(00)00057-9
[4] Egrioglu, E., Aladag, C.H., Yolcu, U., Uslu, V.R., Erilli, N.A. (2011). Fuzzy time series forecasting method based on Gustafson–Kessel fuzzy clustering. Expert Systems with Applications, 38(8): 10355-10357. https://doi.org/10.1016/j.eswa.2011.02.052
[5] Yu, H.K. (2005). Weighted fuzzy time series models for TAIEX forecasting. Physica A: Statistical Mechanics and Its Applications, 349(3-4): 609-624. https://doi.org/10.1016/j.physa.2004.11.006
[6] Chen, S.M. (1996). Forecasting enrollments based on fuzzy time series. Fuzzy Sets and Systems, 81(3): 311-319. https://doi.org/10.1016/0165-0114(95)00220-0
[7] Huarng, K., Yu, H.K. (2005). A type 2 fuzzy time series model for stock index forecasting. Physica A: Statistical Mechanics and Its Applications, 353: 445-462. https://doi.org/10.1016/j.physa.2004.11.070
[8] Chen, M.Y., Chen, B.T. (2015). A hybrid fuzzy time series model based on granular computing for stock price forecasting. Information Sciences, 294: 227-241. https://doi.org/10.1016/j.ins.2014.09.038
[9] Teoh, H.J., Chen, T.L., Cheng, C.H., Chu, H.H. (2009). A hybrid multi-order fuzzy time series for forecasting stock markets. Expert Systems with Applications, 36(4): 7888-7897. https://doi.org/10.1016/j.eswa.2008.11.009
[10] Chen, S.M., Chang, Y.C. (2010). Multi-variable fuzzy forecasting based on fuzzy clustering and fuzzy rule interpolation techniques. Information Sciences, 180(24): 4772-4783. https://doi.org/10.1016/j.ins.2010.08.026
[11] Chen, S.M., Phuong, B.D.H. (2017). Fuzzy time series forecasting based on optimal partitions of intervals and optimal weighting vectors. Knowledge-Based Systems, 118: 204-216. https://doi.org/10.1016/j.knosys.2016.11.019
[12] Wang, L., Liu, X., Pedrycz, W. (2013). Effective intervals determined by information granules to improve forecasting in fuzzy time series. Expert Systems with Applications, 40(14): 5673-5679. https://doi.org/10.1016/j.eswa.2013.04.026
[13] Zhou, R., Yang, Z., Yu, M., Ralescu, D.A. (2015). A portfolio optimization model based on information entropy and fuzzy time series. Fuzzy Optimization and Decision Making, 14(4): 381-397. https://doi.org/10.1007/s10700-015-9206-8
[14] Zhang, W., Zhang, S., Zhang, S., Yu, D., Huang, N. (2017). A multi-factor and high-order stock forecast model based on Type-2 FTS using cuckoo search and self-adaptive harmony search. Neurocomputing, 240: 13-24. https://doi.org/10.1016/j.neucom.2017.02.054
[15] Chen, BT., Chen, MY., Chiang, HS., Chen, CC. (2011). Forecasting stock price based on fuzzy time-series with entropy-based discretization partitioning. In Knowlege-Based and Intelligent Information and Engineering Systems. KES 2011. Lecture Notes in Computer Science, vol. 6882. Springer, Berlin, Heidelberg. https://doi.org/10.1007/978-3-642-23863-5_39
[16] Khashei, M., Bijari, M. (2011). A novel hybridization of artificial neural networks and ARIMA models for time series forecasting. Applied Soft Computing, 11(2): 2664-2675. https://doi.org/10.1016/j.asoc.2010.10.015
[17] Goldberg, D.E. (1989). Genetic Algorithms in Search, Optimization and Machine Learning, Addison-Wesley.
[18] Vogl, M. (2024). Chaos measure dynamics in a multifactor model for financial market predictions. Communications in Nonlinear Science and Numerical Simulation, 130: 107760. https://doi.org/10.1016/j.cnsns.2023.107760
[19] Bezdek, J.C., Ehrlich, R., Full, W. (1984). FCM: The fuzzy C-means clustering algorithm. Computers & Geosciences, 10(2-3): 191-203. https://doi.org/10.1016/0098-3004(84)90020-7
[20] Chabok, S.H., Tešić, D. (2024). Comprehensive strategic planning for construction companies using fuzzy MADM techniques. Journal of Operational and Strategic Analytics, 2(4): 235-253. https://doi.org/10.56578/josa020403
[21] Gultom, P., Nababan, E.S.M., Mardiningsih, Marpaung, J.L., Agung, V.R. (2024). Balancing sustainability and decision maker preferences in regional development location selection: A multi-criteria approach using AHP and Fuzzy Goal Programming. Mathematical Modelling of Engineering Problems, 11(7): 1802-1812. https://doi.org/10.18280/mmep.110710
[22] Silalahi, A.S., Yulinda, Lubis, A.S., Gultom, P., Marpaung, J.L., Nurhadi, I. (2024). Impacts of PT Pertamina Geothermal Sibayak's exploration on economic, social, and environmental aspects: A case study in Semangat Gunung Village, Karo District. International Journal of Energy Production and Management, 9(3): 161-170. https://doi.org/10.18280/ijepm.090305
[23] Gultom, P., Marpaung, J.L., Weber, G.W., Sentosa, I., Sinulingga, S., Putra, P.S.E., Agung, V.R. (2024). Optimizing the selection of the sustainable micro, small, and medium-sized enterprises development center using a multi-criteria approach for regional development. Mathematical Modelling of Engineering Problems, 11(11): 2977-2987. https://doi.org/10.18280/mmep.111110
[24] Thakkar, A., Chaudhari, K. (2024). Applicability of genetic algorithms for stock market prediction: A systematic survey of the last decade. Computer Science Review, 53: 100652. https://doi.org/10.1016/j.cosrev.2024.100652
[25] Sofiyah, F.R., Dilham, A., Lubis, A.S., Hayatunnufus, Marpaung, J.L., Lubis, D. (2024). The impact of artificial intelligence chatbot implementation on customer satisfaction in Padangsidimpuan: Study with structural equation modelling approach. Mathematical Modelling of Engineering Problems, 11(8): 2127-2135. https://doi.org/10.18280/mmep.110814
[26] Aydın, M., Aydoğmuş, E., Arslanoğlu, H. (2025). Comparative analysis of artificial neural networks and adaptive neuro-fuzzy inference system for biocomposite material synthesis and property prediction. Materials Chemistry and Physics, 344: 131150. https://doi.org/10.1016/j.matchemphys.2025.131150
[27] Tulus, T., Sy, S., Sugeng, K.A., Simanjuntak, R., Marpaung, J.L. (2024). Improving data security with the utilization of matrix columnar transposition techniques. E3S Web of Conferences, 501: 02004. https://doi.org/10.1051/e3sconf/202450102004
[28] Sinulingga, S., Marpaung, J.L., Sibarani, H.S., Amalia, A., Kumalasari, F. (2024). Sustainable tourism development in Lake Toba: A comprehensive analysis of economic, environmental, and cultural impacts. International Journal of Sustainable Development and Planning, 19(8): 2907-2917. https://doi.org/10.18280/ijsdp.190809
[29] Halim, A.B.A., Sukor, M.E.B.A. (2025). Asset pricing anomalies: The case of dividends in the US for Sharia-compliant firms. Borsa Istanbul Review, 25(2): 253-264. https://doi.org/10.1016/j.bir.2025.01.009
[30] Hafni, R., Safira, S. (2024). Analysis of socio-economic conditions of the people of Sawah Lukis Tourist Area. In Proceeding Medan International Conference on Economic and Business, pp. 990-997. https://doi.org/10.30596/miceb.v2i0.631
[31] Oktavianny, S.D., Mujiatun, S. (2023). The effect optimizing digital transaction education on customer cross selling at Bank Syariah Indonesia KCP Kabanjahe: English. Muhasabatuna: Jurnal Akuntansi Syariah, 5(2): 219-228. https://doi.org/10.54471/muhasabatuna.v5i2.2425
[32] Rahmayati, R., Mujiatun, S., Sari, M. (2022). Islamic Green Banking at Bank Pembangunan Daerah in Indonesia. Indonesian Interdisciplinary Journal of Sharia Economics, 5(1): 74-93. https://doi.org/10.31538/iijse.v5i1.1850
[33] Mujiatun, S., Trianto, B., Cahyono, E.F., Rahmayati. (2023). The impact of marketing communication and Islamic financial literacy on Islamic financial inclusion and MSMEs performance: Evidence from halal tourism in Indonesia. Sustainability, 15(13): 9868. https://doi.org/10.3390/su15139868