Md. Jashim Uddin* | Mohammed Nizam Uddin | Md. Sayeed Iftekhar Yousuf
© 2025 The authors. This article is published by IIETA and is licensed under the CC BY 4.0 license (http://creativecommons.org/licenses/by/4.0/).
OPEN ACCESS
In this study, we have investigated pulsatile non-Newtonian fluid flows through a stenotic common carotid artery with the motive of quantifying the influence of the blockage structure on hemodynamic wall parameters. These parameters depend not only on the flow geometry but also on the rheological characteristics of blood. We conducted a numerical study using COMSOL Multiphysics software on unsteady blood flow through a rigid artery. The outcomes indicate that the time-averaged wall shear stress (TAWSS) distribution, which is the fundamental cause affecting the hemodynamic wall parameters, sharply depends on the axial flare of the constriction, and the power-law model’s TAWSS is 41.91% lower than that of the Newtonian model for 60% stenosis. A comparison of the time-averaged separation length of the recirculation zone among rheological models over a cardiac cycle confirms that the power-law model shows 48.68%, 74.61%, and 100% deviations compared to the Newtonian model for a 60%, 50%, and 40% stenosis, respectively. Increasing the degree of stenosis makes flow systems more disturbed in the post-stenotic zone. The current findings reveal that atherosclerotic risk factors vary with stenosis length (SL) and stenosis throat length (LT) as an atheroma gradually develops, and their relation is depicted in an inverse manner with the increasing length. A larger stenosis throat increases recirculation length by 36.36% compared to smaller lengths for the power-law model, elevating thrombosis risk. Finally, considering all the models, it can be seen that the Newtonian model’s recirculation length rises by 24.91% and 48.68% compared to the Carreau and power-law models, respectively.
computational fluid dynamics, pulsatile flow, stenosis, wall behavior hemodynamics, time-averaged recirculation length
The thickening of the intima of the diseased vessel is called the initial stage of atherosclerosis. One of the general dangerous cardiovascular diseases, atherosclerosis, has been widely investigated, and it is a main factor of death in most countries. It is indispensable to realize how the parameters of blood treated in diseased vessels as a serious factor in the composition and development of the disease. There is extensive research that has been employed to perceive the disturbances of flow as a result of constriction, concerned with numerous analytical, experimental works and computational observations. Ahmed and Giddens [1] have investigated the unsteady downstream flow of stenosis with the help of laser Doppler anemometry using several Reynolds numbers. Ojha et al. [2] have attained the velocity profiles in detail by employing photochromic tracer methods for unsteady flow via vessels with various symmetry constrictions and blockage intensities. Long et al. [3] have investigated the pulsatile flow of blood in three axisymmetrical and three symmetrical stenotic models of vessels with a variety of blockage strictness. They have concentrated on the separation zone of flow (FSZ) and the distributions of wall shear stress (WSS) for the models. Kaid et al. [4] have provided a comprehensive model of pulsatile hemodynamics in the carotid artery, encompassing both normal and stenosis-affected conditions. This study investigates the effects of hemodynamic parameters such as Reynolds number, Womersley number, and arterial geometry on flow disturbance and stagnation points.
The impact of blockage intensity, Womersley number and Reynolds number on the characteristics of flow has been investigated by Hasan and Datta [5] in a stenotic artery. Comparison between several rheological models in parallel with the Newtonian model is conducted by Razavi et al. [6]. They have summarized that the flow becomes more troubled in the downstream area of stenosis, and WSS evolution becomes noticeable at the stenosis throat with the increasing degree of stenosis. The distribution of plaque wall stress (PWS) and its velocity in the vicinity of the plaque are significantly influenced by plaque height [7]. The compression stress increases as plaque height increases because there is a greater force associated with blood flow close to the plaque. Udupa et al. [8] have examined the relationship between the conditions of physiology and hyperviscosity and discovered that exercise promotes the separation zone downstream of the stenosis. Additionally, the researchers examine the effects of switching between the conditions of resting and exercise, observing that the rate of transition is correlated with the development of stenosis. Fatouraee et al. [9] have thought about the permeability and have investigated the flow of pulsation in a carotid artery. Bayat and Tavakoli [10] have studied the flow pulsation through a different stenotic common carotid artery under various wall conditions. Karimi et al. [11] have compared the outcomes of simulation between 2D and 3D axisymmetric models through a pulsatile common carotid artery by considering various blood rheologies along with the Newtonian model.
Trigui et al. [12] have considered the pulsed flows through a severe aortic stenotic model and have shown that 75% diameter reduction in a troublesome case of aortic wall damage. Flow at the carotid artery bifurcation is used to detach the artery’s outer wall [13]. The pressure is familiar for extending in the sinus downstream and may generate the flow to separate from the wall of the vessel since the flow dilates on passing into the sinus. Yang et al. [14] have investigated the carotid artery’s wall behavior hemodynamics with the help of the computational fluid dynamics approach to quantify the blood flow changes for a stenosed artery. Elbanhawy et al. [15] have explained the pulsatile blood flows through an artery of elastic employing flow pulsation as an inlet boundary condition. The Newtonian consideration of blood may be enumerated in the case of extensively modeled arteries, as noted by Pedley [16]. The practical outlet boundary condition of the pulsatile blood vessel having greater blockage yields a minimum WSS value at the post-stenotic zone, resulting in the secondary constriction development [17]. Computational fluid dynamics (CFD) analysis has been used to numerically simulate the blood flow dynamics of stenosed and stented carotid artery bifurcations [18]. The pressure and velocity profiles in the post-stenotic area oscillate right downstream of the stenosis, according to observations of the transitional flow. Further, blood flow pulsation through a two-dimensional (2D) stenotic vessel applying the Carreau-Yasuda model has been discussed by Roy et al. [19]. They have treated the flow of Womersley as an inlet boundary condition, spatial pressure with time-varying at the outlet and a rigid artery wall.
Ferdows et al. [20] and Buradi and Mahalingam [21] have investigated the stenotic arterial geometry through the 3D model to discuss the distribution of WSS-based narrators: time-averaged wall shear stress (TAWSS), oscillatory shear index (OSI) and relative residence time (RRT). They have offered a strong connection among low TAWSS, elevated OSI, elevated RRT values and the atherosclerotic plaque. Blood rheology takes a leadership role in the region of minimum shear rate. Many investigators in the previous have studied non-Newtonian blood properties such as power-law, Cross, Quemada and Carreau models on hemodynamics in the bifurcation of carotid arteries for comparing patient-specific healthy and diseased models [22]. Sharma et al. [23] have examined the Jeffrey-fluid model with a two-layered taking a mild constriction in confined vessels. They have detected that WSS increases as the blockage degree increases and decreases as the rise in the time ratio of relaxation. Tian et al. [24] have investigated non-Newtonian blood models past a stenosed vessel with the strength of the blockage. Disorders in the domain of flow as the diseases of atherosclerosis, have attacked WSS and WSSG on both walls. According to the reference [25], the blood hemodynamics in carotid artery stenosis are predicted using a predictive surrogate model (PSM). The hemodynamic parameters, such as pressure, velocity components, WSS, and OSI, are captured by this model. Additionally, it creates trustworthy error scales for WSS indices and velocity components, whereas OSI shows somewhat greater errors. When the blood pressure is 500 Pa, the plaque neck has the highest WSS value, and when the blood pressure is 1500 Pa, the areas close to the plaque root have the highest WSS value [26]. Furthermore, observations have shown that the area with exceptionally elevated WSS magnitudes expands in tandem with the plaque size. Though the hemodynamic parameters (TAWSS, OSI, RRT) are associated with various stenosis shapes and non-Newtonian rheological models in references [6, 14, 27, 28], the effect of stenosis throat and stenosis lengths on atherosclerotic hemodynamics has not yet been assessed, which may be implemented in bioengineering research.
In the present investigation, since recirculation zones appear in a cardiac cycle at maximum times, it depends on the stenosis strength and stenosis structure. The aim is to evaluate outcomes attained by different rheology models of blood, investigating parameters that contribute to the development of atherosclerosis; among these, TAWSS is a fundamental ingredient influencing the hemodynamic wall factors. In this connection, we concurrently investigate the impact of the lengths of stenosis and throat in a 2D axisymmetric rigid-walled vessel on the hemodynamic wall parameters through computational methods.
A reasonable computational solution for the rheological blood flow models is attained by following various systematic procedures related to CFD as follows:
2.1 Computational domain
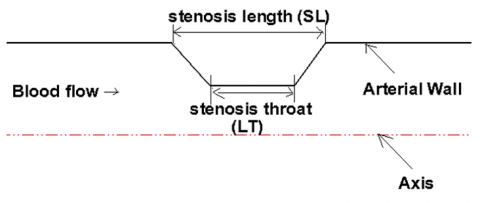
A straight, rigid, long tube with a two-dimensional axisymmetric trapezoidal blockage illustrates a pathological artery with an atheromatous plaque, as shown in Figure 1. The rigid wall assumption is a limitation in obtaining accurate hemodynamic results. Another important limitation is the use of 2D axisymmetric geometry instead of a 3D patient-specific model due to the inability to capture spiral flow.
Figure 1. The present study’s schematic diagram
The stenosis exposes the area reduction.
$(A R)=\frac{\pi R^2-\pi(R-h)^2}{\pi R^2}$
where, R and h indicate the undisturbed radius and stenosis severity, respectively. The artery’s unobstructed segment measures D = 7 mm in diameter, which matches the average diameter of the common carotid artery (CCA) of a human. A 2D axisymmetric zone of computation is used with the coordinates (r, z) in polar coordinates due to the geometric considerations. Figure 1 displays the zone of computation for the CFD scenario in relation to the specified geometry configurations. The area of computation includes pre-stenotic, stenotic, and post-stenotic extents of 4D, 2D, and 20D, respectively. The pre-stenotic length is deliberated far enough to get a fully developed flow earlier on the stenosis, and the post-stenotic long domain is selected to lessen the impact of the downstream boundary conditions.
2.2 Governing equations and boundary conditions
The governing equations for the model, in particular the continuity and momentum equations, are as follows:
$\rho \nabla . u=0$ (1)
$\rho \frac{\partial u}{\partial t}+\rho(u . \nabla) u=-\nabla p+\nabla . \tau+F$ (2)
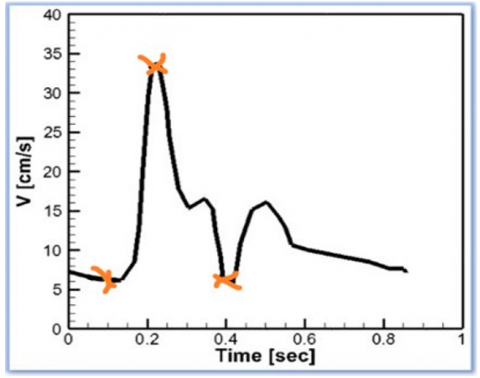
where, $\rho$ indicates the density (kg/m3); velocity vector is $u(m / s)$; p represents the pressure (Pa); stress tensor is $\tau$ and F indicates the volume force vector (N/m3). Eqs. (1) and (2) indicate the continuity and vector equation, respectively. It should be mentioned that the blood density is taken as $\rho$=1050 kg/m3. The artery wall is considered to be rigid, and a no-slip boundary condition is formulated along the wall of the artery. The idealized carotid artery pulse applied in the present study for the boundary condition at the inlet is reported by Razavi et al. [6] in Figure 2(a) and is obtained by a fitting harmonic function. A Windkessel-type model needs to be utilized at the outlet. Here, the outlet boundary condition of the considered artery is subjected to zero gauge pressure.
The hemodynamic parameters concerning the discussion need to be emphasized:
The WSS is mainly a property of fluid dynamics and is introduced to strongly influence atherosclerosis and the formation of plaque. The TAWSS can be expressed in the following way:
$\mathrm{TAWSS}=\frac{1}{T} \int_0^T \tau_w d t$ (3)
where, T is the period of the full cardiac cycle, and $\tau_w$ is the vector of WSS. The time-averaged wall shear stress gradient (TAWSSG) is correspondingly specified as:
$\mathrm{TAWSSG}=\frac{1}{T} \int_0^T W S S G\ d t$ (4)
where, the magnitude of the wall shear stress gradient (WSSG) vector can be referred to as:
$|W S S G|=\left[\left(\frac{\partial \tau_w}{\partial r}\right)^2+\left(\frac{\partial \tau_w}{\partial z}\right)^2\right]^{1 / 2}$ (5)
The endothelium may be negatively impacted by the TAWSSG parameter, which depicts regional differences as sharp in WSS. The OSI or oscillatory shearing index can be identified as follows:
$\mathrm{OSI}=\frac{1}{2} \times\left(1-\frac{\left|\int_0^T \tau_w d t\right|}{\int_0^T\left|\tau_w\right| d t}\right)$ (6)
OSI is heightened at crucial locations where the time-averaged points of flow separation and reattachment occur and can be utilized to identify atherosclerosis-vulnerable areas.
Conclusively, the RRT or relative residence time can be evaluated in the following way:
$\mathrm{RRT}=\frac{1}{(1-2 \mathrm{OSI}) \mathrm{TAWSS}}$ (7)
The blood-carrying particles that are located in various zones of the artery walls over time can be adaptively linked to the RRT parameter.
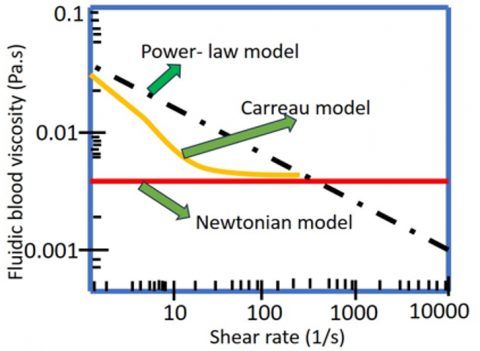
2.3 Rheological models as a non-Newtonian fluid
The viscosity of a Newtonian fluid is always stable in opposition to the shear rate, while it has a converse action for the fluids of the non-Newtonian viscosity model. Two non-Newtonian models of blood rheology are included alongside the Newtonian fluid in the computational fluid dynamics solver. Table 1 presents a summary of these models, including the input parameters for each one. The blood rheology models have been stated in reference [29] through parameters appropriate for data from experiments on the viscosity of blood controlled with particular shear rates. The shear rate dependence of blood viscosity for the considered models is investigated, see Figure 2(b). At the level of very elevated shear rates (over 100/s), the Carreau model viscosity is identical to that of Newtonian. With the approval of Cho and Kensey [29], experimental reports provide strong support for this approach. It may be observed that the viscosity of the power-law model appears to approach zero at elevated shear rates, whereas blood is commonly accredited to be a Newtonian fluid at shear rates exceeding 100/s [16, 30].
Table 1. Non-Newtonian blood models of rheology for blood viscosity
|
Blood Models |
Viscosity* |
|
Newtonian |
$\mu=0.0035\ \mathrm{Pa.s}$ |
|
Carreau |
$\mu=\mu_{\infty}+\left(\mu_0-\mu_{\infty}\right)\left(1+A|\dot{\gamma}|^2\right)^n$ $\mathrm{A}=10.976\ \mathrm{n}=-0.3216$ $\mu_{\infty}=0.0035 \mathrm{~Pa} . \mathrm{s}\ \mu_0=0.056 \mathrm{~Pa} . \mathrm{s}$ |
|
Power-law |
$\mu=\mathrm{k}|\dot{\gamma}|^{n-1}$ $\mathrm{k}=0.035, \mathrm{n}=0.6$ |
*Viscosity as a global shear rate, $|\dot{\gamma}|$ function in non-Newtonian rheological models.
(a)
(b)
Figure 2. (a) Pulsatile inlet velocity vs. time with a period of 0.8572 s, (b) Relations between blood viscosity and shear rate for several rheological models [31]
2.4 Numerical solution
The Navier-Stokes along with the continuity equations, have been numerically solved by the CFD method developed using the COMSOL Multiphysics software on the basis of the finite element method (FEM). The considered geometry is meshed in an unstructured discretization to obtain the best results by examining the grid independence. In addition, the solver scheme has selected the implicit backward differentiation formula (BDF) for the solution. Further, at every time level, a customary appeasement convergence is achieved by using an iterative tolerance of 10-4. Moreover, the time step of 0.0003 s has been taken to perform the numerical simulation.
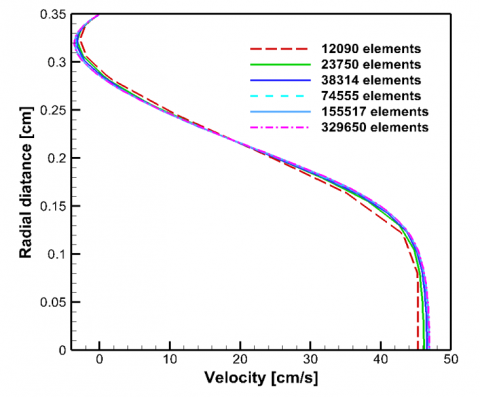
2.5 Grid independence
The resolution of the grid trial is executed to identify the compatible grid distribution where the computational solution is mesh-independent. A mesh independence study has been conducted for the different numbers of mesh elements of 12090, 23750, 38314, 74555, 155517 and 329650 to assess the accuracy of the numerical solution and is shown in Figure 3. The simulated results indicate that there is no significant variation in velocity profiles at a distance of 1.5D downstream the stenosis for the change of mesh elements from 155517 to 329650. Consequently, the mesh consisting of 155517 elements has been adopted for the numerical simulations.
Figure 3. Velocity profiles at Z = 1.5D from stenosis middle for different grids
2.6 Methodology validation
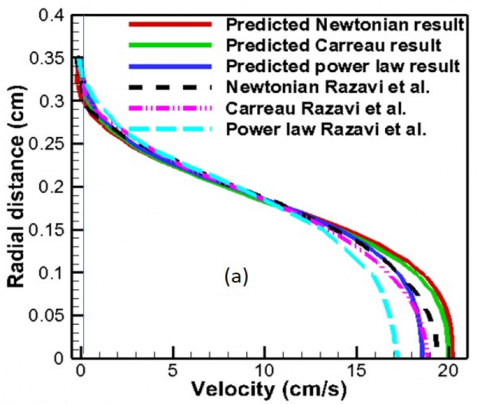
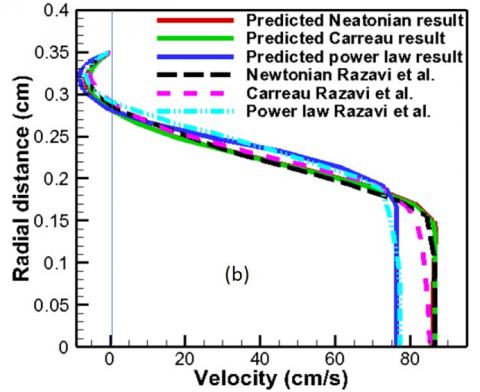
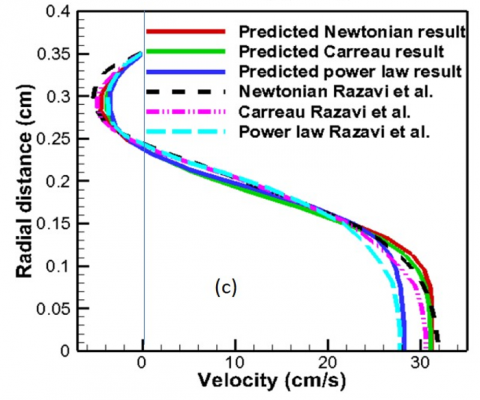
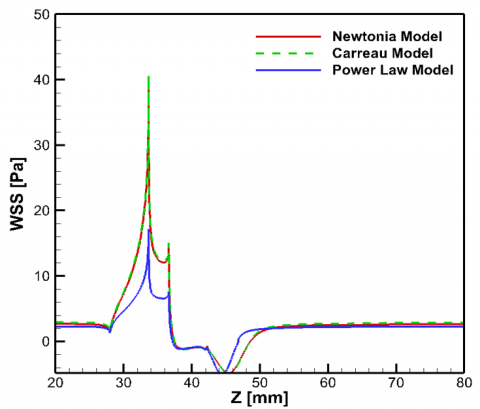
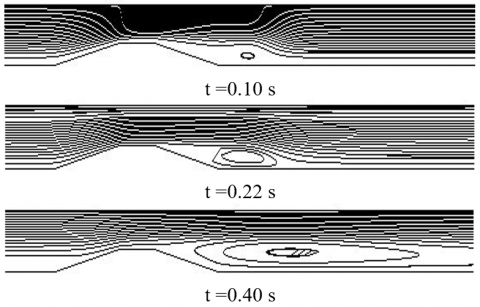
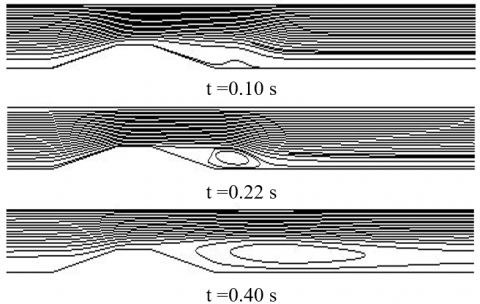
With a view to validating the numerical method used in this current research, we first assimilate our numerical outcomes with the CFD results of Razavi et al. [6], considering the axisymmetric common carotid artery with pulsatile inlet velocity. The assimilated model is geometrically the same, and more details can be found in Razavi et al. [6]. Figure 4 displays outcomes for the different time instants of the velocity of radial on the common carotid artery at Z = 2R. There is a strong characteristic consent between the numerical outcomes gained by Razavi et al. [6] and the present computational outcomes.
Figure 4. Velocity profiles at Z = 2R for (a) earlier acceleration, t = 0.1 s; (b) systole, t = 0.22 s and (c) diastole, t = 0.40 s for Newtonian and two non-Newtonian fluids
Numerical computations in the transient are executed for various blockage intensities. The whole time period of a cardiac cycle for every simulation is t = 0.8572 imparting a pulsation heart rate of nearly 70 beats per minute. The time instants below are used to discuss the hemodynamics of wall metrics since they show the major indicators over the course of a cardiac cycle.
•t = 0.1, early stage of the cardiac cycle in the accelerating phase,
•t = 0.22, the highest rate of flow travels in the artery at this peak systole,
•t = 0.4, the lowest rate of flow moves in the artery during this diastole.
The impact of the velocity of the inlet, non-Newtonian blood characteristics and blockage intensity is observed in the hemodynamic terms of WSS, TAWSS, TAWSSG, OSI, RRT, wall pressure and velocity streamline flow types.
3.1 Inlet velocity’s impact
WSS is significantly impacted by pulsating input velocity. Figures 5-8 show the wall shear stress, zone of separation and wall pressure distributions. In the artery of non-stenotic (Figure 5), the highest wall shear stress lies between 2 Pa and 3 Pa due to the maximum flow rate of the pulse of the inlet, which will not generate inconveniences for the cells. Notwithstanding, with a shortening in the area of the flow cross-section, the shear stress rises and may lead to peril. Figure 5 displays the healthy case of the artery.
Figure 5. Wall shear stress through a no-stenotic artery for several time points in various rheological models
At various critical time points in a cardiac cycle, Figure 6 displays shear stress across the arterial wall with a blockage intensity of 60% for Newtonian, Carreau and power-law models. The top WSS values take place at the constriction throat in a full cardiac cycle. The value of WSS is directly connected with the entrance velocity magnitude. At peak systole, t = 0.22 s, (Figure 6(a)) as the velocity of the inlet rises speedily for passing maximum flow rate bestowing that WSS undergoes a sharp rise compared to the early stage (t = 0.1 s) (Figure 6(b)) of the accelerating phase, and the non-Newtonian Carreau model becomes about 1.01 and 2.37 times greater than the Newtonian and power-law model. As may be observed in Figure 6(c), at t = 0.4 s when the minimum flow rate travels, this value drops rapidly by virtue of small shear rates around the wall of the vessel. These drastic variations of the magnitudes of WSS, which occur in a little while, impose on the cells of the endothelium and may yield awful devastation to the wall of the vessel. Nevertheless, the Carreau model perceives the greatest value, while the other models maintain the low wall shear stress in the investigated artery.
(a) t = 0.22 s
(b) t = 0.1 s
(c) t = 0.4 s
Figure 6. Wall shear stress for (a) t = 0.1 s, (b) t = 0.22 s and (c) t = 0.4 s along the artery wall
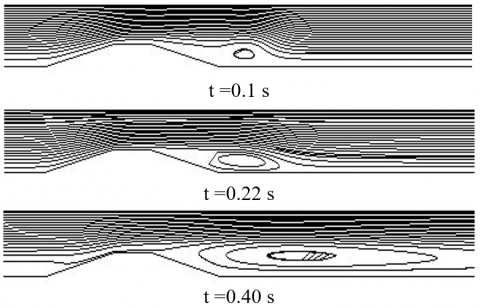
The flow separation is induced immediately after the narrowest part of 60% stenosis, and the recirculation zone extends up to the flow is reattached. This also considers the impact of the pulsation of flow on the flow structure. For each time period specified, the flow recirculation areas are shown in Figure 7. The tiny vortex is formed close to the artery wall, far away from the blockage, at t = 0.1 s. At peak systole, t = 0.22 s, the flow separation zone increases readily downstream of the constriction. The length of the recirculation zone develops due to the deceleration of the flow. At t = 0.4 s, minimum flow rate, large flow separation areas are shaped distant and proximate to the constriction. The length of the vortex is greatly influenced by the fluid flow rheology. The shear-thinning viscous behavior of blood reduces the vortex length relative to the values for Newtonian fluid flow. The minimal value of the magnitude of flow separation occurs for the Power law model as compared to the others.
(a)
(b)
(c)
Figure 7. Instantaneous streamlines for the models of (a) Newtonian, (b) Carreau and (c) power-law at various time intervals of cardiac cycle
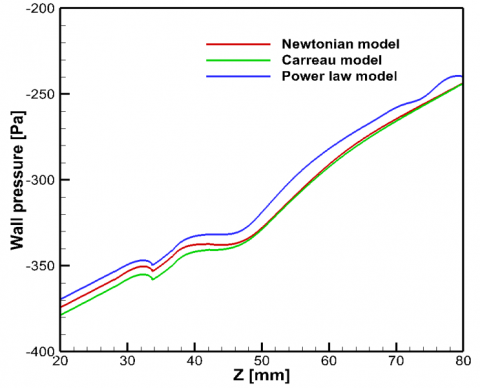
Wall pressure is conferred by various rheological blood models and is presented in Figure 8 for a 60% stenosis size that gives contradictory impressions as compared to the wall shear stress. The flow pulsation generates a greatly high pressure on the artery walls (beginning of the stenosis) in all rheological models (t = 0.1 and 0.22 s). It perceives a collapse in the blockage area by all the blood viscosity models. The pressure at the artery wall lessens significantly at the minimum flow rate (t = 0.4 s) and maintains negative magnitudes throughout the cycle. Notably, non-Newtonian rheological models propagate higher pressure at the artery wall than the Newtonian model does.
(a) t = 0.1 s
(b) t = 0.22 s
(c) t = 0.40 s
Figure 8. Wall pressure at different time steps (a) earlier acceleration, t = 0.1 s, (b) systole, t = 0.22 s and (c) diastole, t = 0.4 s along the artery wall
3.2 Effect of hemodynamic parameters
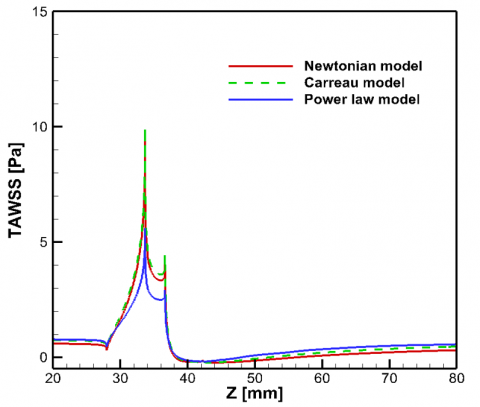
The TAWSS distribution along the wall of the tube with the 60% stenosis is examined and is displayed in Figure 9. In the beginning, it should be noted that in every situation that is investigated, negative magnitudes of TAWSS prevail in the post-stenotic area, initiating flow recirculation. By means of aging, plaques may undergo the process of corrosion and become susceptible [32]. The local TAWSS growth might be connected with the corrosion process of plaque that contributes to collapsing, and if it proceeds, TAWSS might be exercised as an indicator for the appraisal of susceptibility risk. Along with the local growth of TAWSS, the appearance of the plaque produces a TAWSS minimization on the post-stenotic zone. This minimum TAWSS zone could lead to the development of plaque, contributing to the expansion of the prevailing plaque of atherosclerosis. In consideration of the birth position of plaque at the local low TAWSS, its growth seems to be engaged through the increasing or decreasing region of wall shear stress at the minimum. It can be readily observed that all the models have an excessive dominance on the simulation outcomes. Explicitly, the power-law model yields a decrease of 41.91% and 43.83% in the highest TAWSS from 9.64 Pa and 9.97 Pa for the Newtonian and Carreau models, respectively. The fact that non-Newtonian models usually exhibit shorter recirculation than Newtonian ones has been verified [6].
Figure 9. Time average wall shear stress (TAWSS) along the artery wall for rheological models
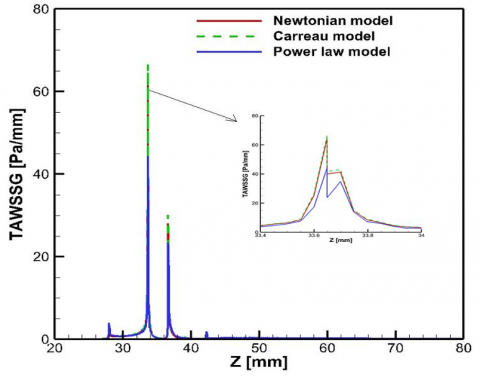
An interesting finding is observed about the behavior of TAWSSG to various rheological models for the intensity of 60%. The Carreau model illustrates a greater response to TAWSSG in comparison to the Power law model. Figure 10 gives the TAWSSG distributions. The values of TAWSSG rise markedly in the blockage; the rise is cogent and profound for the Newtonian and Carreau models, whereas it is lower for the Power law model. The highest TAWSSG value for the Carreau model is 1.03 and 1.50 times larger than that of the Newtonian and power-law models of the same length, thereby signifying a substantial impact of the rheological models.
Figure 10. The time-averaged wall shear stress gradient or TAWSSG across the arterial wall using the fluids of Newtonian and non-Newtonian
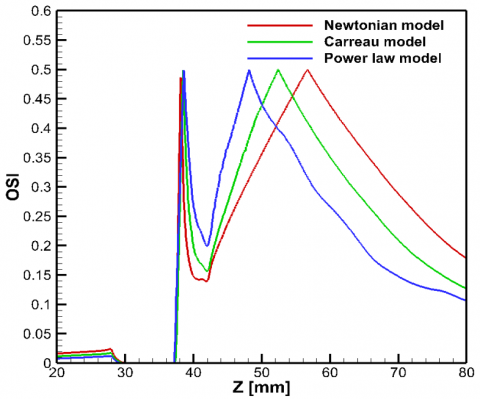
In Figure 11, the OSI distributions of 60% blockage primarily expose a hefty cusp followed by a second extensive peak across all cases examined. The maximum of the first represents the position of flow separation, whereas the maximum of the second indicates the position of flow reattachment at which TAWSS becomes zero. Due to resembling stenosis of the identical length of all models, the time average locations of separation delineated by the initial maximum points nearly overlap, whereas the time average locations of reattachment designated by the next maximum points are fairly different. The effects of transients are, in fact, more important in these two places. The computed points of separation, reattachment, and lengths of recirculation at the time-averaged concept for all viscosity models are shown in Table 2. It is marked that OSI values near 0.5 contribute to the scarcity of endometrial cell function and the conclusive agent to alter cellular formation under cyclic stress. It is also noticeable that the aforementioned behaviors pertain to the time-averaged flow, while in dynamic scenarios, the locations of flow separation and reattachment oscillate throughout the pulsation cycle.
Figure 11. The oscillation of shearing index or OSI at the arterial wall using the fluids of Newtonian and non-Newtonian
Table 2. Time-averaged points of flow separation and reattachment, as well as time-averaged recirculation lengths for both Newtonian and non-Newtonian fluids across various degrees of blockage severity
|
Model |
Stenosis Severity |
Time Average Separation Point from Artery Beginning [mm] |
Time Average Reattachment Point from Artery Beginning [mm] |
Time Average Recirculation Length [mm] |
|
Newtonian |
30% |
0 |
0 |
0 |
|
Carreau |
0 |
0 |
0 |
|
|
Power law |
0 |
0 |
0 |
|
|
Newtonian |
40% |
41.82 |
42.26 |
0.44 |
|
Carreau |
0 |
0 |
0 |
|
|
Power law |
0 |
0 |
0 |
|
|
Newtonian |
50% |
39.44 |
47.16 |
7.72 |
|
Carreau |
40.28 |
44.55 |
4.27 |
|
|
Power law |
41.11 |
43.07 |
1.96 |
|
|
Newtonian |
60% |
38.12 |
56.71 |
18.59 |
|
Carreau |
38.47 |
52.43 |
13.96 |
|
|
Power law |
38.61 |
48.15 |
9.54 |
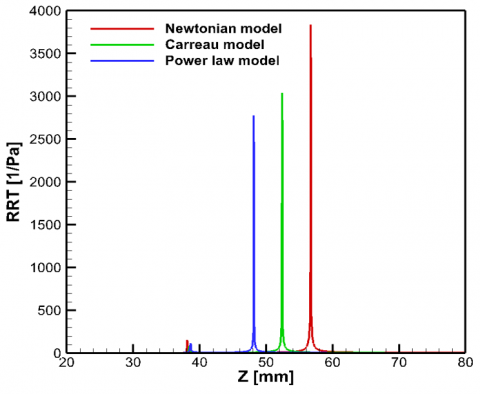
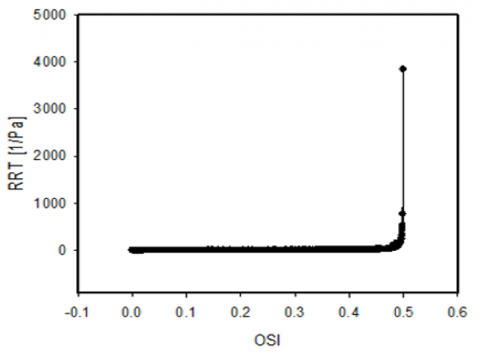
Finally, the RRT arrangements are displayed in Figure 12 with a 60% stenosis size. The peaks in the arrangements of RRT agree with the peaks in the OSI arrangements, where OSI approaches a topmost value of 0.5, consequently turning in extremely high-reaching values of RRT (in theory RRT→∞ when OSI→0.5). Corresponding peaks of RRT have been identified in the downstream location of constriction in another research by Huang et al. [27] and Kelidis and Konstantinidis [33], which correspond to the reattachment point of flow where OSI equals 0.5. This parameter basically represents how long blood particles stay in a certain area. The longer the blood stays in an area, the more chances it recirculating. This recirculating blood in turn increases the possibility of platelet aggregation conduct to thrombus formation and stroke. Reduced TAWSS and elevated RRT correlate with endothelial dysfunction and a heightened risk of thrombosis, contributing to the development of atherosclerotic plaques.
Figure 12. RRT distribution along the artery for all cases investigated
3.3 Effect of stenosis severity
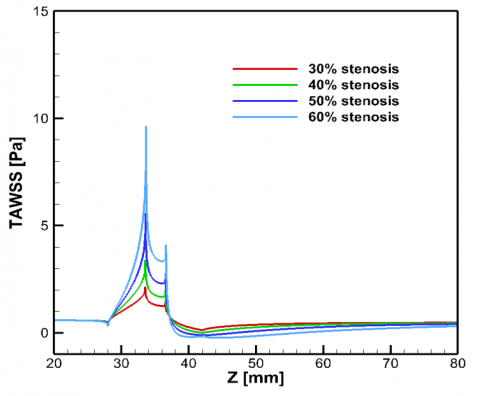
There is a very significant increase in time-average wall shear stress (TAWSS) through the stenosis throat owing to the great impacts of the flow systems in the atherosclerosis development, reaching the most critically stenosed case. Downstream of the blockage, the strongly unsteady flow causes a corresponding variation due to various blockage intensities in the field of TAWSS. It is cabalistic to refer that, as the blockage severity increases, the flow area is more invaded and TAWSS continually increases both in the throat of the stenosis and post-stenotic regions. This is due to the reduction in plaque accumulation leads to blood flow to accelerate, and this acceleration increases TAWSS on the arterial walls. TAWSS as an axial distance function is displayed in Figure 13 for 30 – 60% blockage severity only for the Newtonian model. As reported, the highest of TAWSS and the improvement of the flow recirculation zone appear at the stenosis extent. The maximal value of time average wall shear stress in the Newtonian model progresses due to 60% arterial blockage is 4.50, 2.84 and 1.73 times larger as compared to 30%, 40% and 50% arterial blockage, respectively.
Figure 13. TAWSS distribution in the situation of varying constriction intensity across the arterial wall using the Newtonian fluid
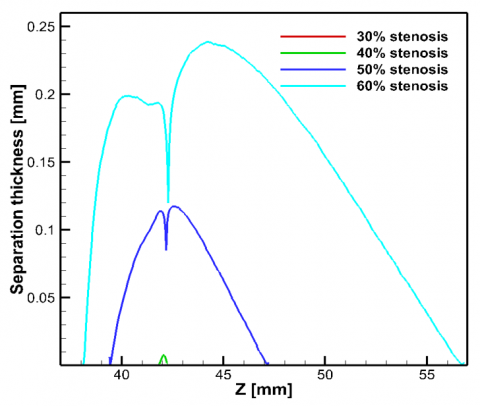
The thickness of the region of separated flow on the artery wall is evaluated by adopting the thickness of the cross-section of the flow recirculation zone and is also plotted against the various stenosis severities (Figure 14). In accordance with the prophecy, the wall curves are absolutely identical but different in magnitude, revealing that the region of flow separation is asymmetric. No separation thickening is observed for the 30% stenosis severity compared to the 40-60% stenosis intensity.
Figure 14. Separation thickness at the post-stenotic zone for Newtonian model in case of different stenosis severities
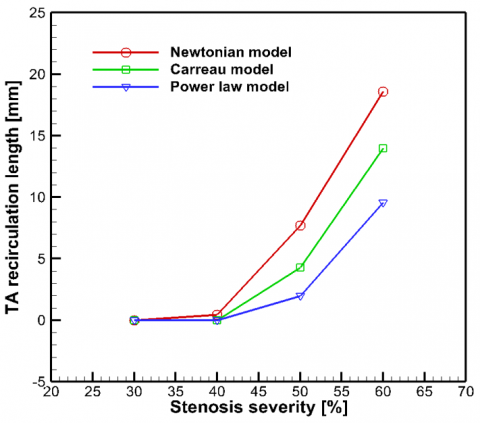
As displayed, there are sturdy connections between the intensity of constriction and the length of separation zones. Nevertheless, a significant and innovative contrivance in our investigation is the discernible sigmoidal relationship between the strength of blockage and the extent of flow separation regions. As blockage intensity has increased from 40% to 60%, there is a crinkle rise in the span of flow separation areas, see Figure 15 and Table 2. Perturbances in recirculation predispose toward thrombosis and play a decisive role in occlusive ruptures of plaque. The recirculation of flow may consequently supply an innovative mechanism of pathology by which temperately intense stenosis may advance to fulfill thrombotic obstruction. The extent of the recirculation length of flow is negligible in the severity of mild stenosis (30%) than severe stenosis (Figure 15). Greater severity of stenosis correlates with an expanded separation zone and elevated shear stress at the stenotic location. The hemodynamic alterations may result in important clinical consequences, possibly causing complications such as thrombosis or restenosis.
Figure 15. Time average recirculation length for different stenosis blockage through rheological models
3.4 Relationship among TAWSS, OSI and RRT
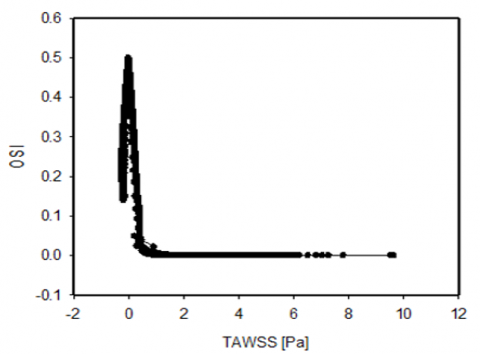
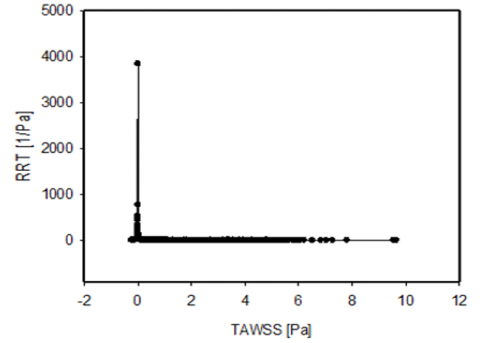
Another interesting perfection is the relationship between TAWSS vs OSI, TAWSS vs RRT and OSI vs RRT required in order for the downstream propagation to appear. Figure 16 is displayed with a line scattering diagram to show their wall behaviors for a Newtonian fluid. The OSI and RRT evolve the entire WSS oscillation at the time of pulsatile flow. The highest OSI and RRT appear in the downstream area from the artery blockage on the vessel wall, where the TAWSS occurs at zero. OSI and RRT values indicate identical things as they are both values related to low average shear stress values, either due to the magnitude of low or high variation of WSS vector direction. Therefore, the line scattering diagram for these two quantities shows the maximum value at the corresponding point.
(a)
(b)
(c)
Figure 16. Relationship (a) TAWSS vs. OSI (b) TAWSS vs. RRT (c) OSI vs. RRT along the artery wall for Newtonian model in case of 60% area reduction
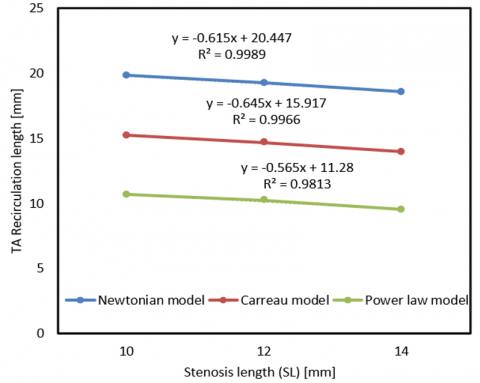
3.5 Effect of stenosis throat length (LT)
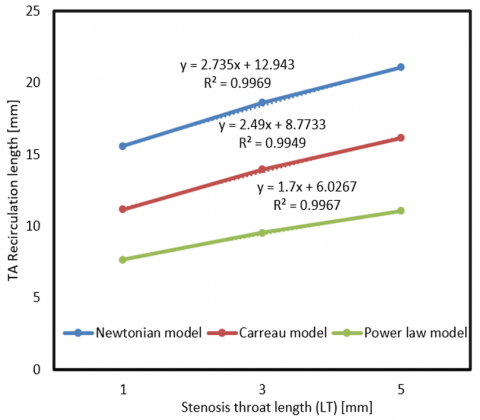
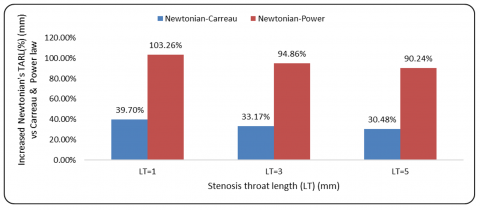
This section describes the effect of various stenosis throat lengths (LT) on time average recirculation length for all models and is presented graphically in Figure 17. Simulations are performed for three different stenosis throat lengths (LT) of 1, 3 and 5 mm for the constant stenosis length (SL) of 14 mm. It can be observed from Figure 17 that the time average recirculation length increases with the increase of stenosis throat length for a fixed value of stenosis length (SL). Also, conspicuous discrepancies in the extent of recirculation are investigated in a cardiac cycle. The Newtonian model provides the largest extent of separation in the downstream region of the constriction. From Figure 18, it is revealed that the increasing rates of Newtonian recirculation lengths are 39.70, 33.17, 30.48% and 103.26, 94.86, and 90.24% than the Carreau and power law models for the stenosis throat lengths of 1, 3 and 5 mm. Table 3 presents the recirculation lengths for different models in various throat lengths.
Figure 17. Relationship of time average recirculation length along the artery for different stenosis throat lengths (LT) for all cases investigated
Figure 18. Increased Newtonian’s time average recirculation length for different stenosis throat lengths
Table 3. Report on recirculation length related to stenosis throat length (LT)
|
Model |
Stenosis Severity |
Stenosis Throat Length (LT) |
Recirculation Length |
Decreased Recirculation Lengths for Carreau and Power-law Models from Newtonian Model (%) |
|
Newtonian |
60% |
1 |
15.59 |
|
|
Carreau |
11.16 |
28.42 |
||
|
Power-law |
7.67 |
50.80 |
||
|
Newtonian |
3 |
18.59 |
|
|
|
Carreau |
13.96 |
24.91 |
||
|
Power-law |
9.54 |
48.68 |
||
|
Newtonian |
5 |
21.06 |
|
|
|
Carreau |
16.14 |
23.36 |
||
|
Power-law |
11.07 |
47.44 |
3.6 Effect of stenosis length (SL)
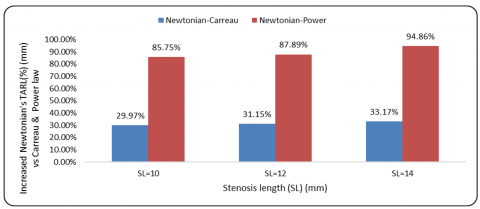
Atherosclerosis of plaque development overlaps with regions of minimum wall shear stress. Accordingly, we have first discussed the impact of several blockage percentages on the peak of TAWSS. In Figure 19, it is seen that the time average recirculation length decreases with increases in SL of 10, 12 and 14 mm. The time average recirculation length increases by 29.97, 31.15, 33.17% and 85.75, 87.89, and 94.86% in the Newtonian model than Carreau and power law models, respectively, for the stenosis lengths of 10, 12 and 14 mm, keeping the fixed stenosis throat length of 3 mm (Figure 20). Recirculation lengths for various models through different SL are presented in Table 4. Clinical studies examining the connection between LT and SL have identified an inverse correlation, indicating that a longer LT coupled with a shorter SL leads to more disturbed flow patterns, which in turn reduce TAWSS and increase RRT, thereby enhancing plaque instability.
Figure 19. Relationship of time average recirculation length along the artery for different SL for all cases investigated
Figure 20. Increased Newtonian’s time average recirculation length for different stenosis lengths
Table 4. Report on recirculation length related to stenosis length (SL)
|
Model |
Stenosis Severity |
Stenosis Length (SL) |
Recirculation Length |
Decreased Recirculation Lengths for Carreau and Power-law Models from Newtonian Model (%) |
|
Newtonian |
60% |
10 |
19.82 |
|
|
Carreau |
15.25 |
23.06 |
||
|
Power-law |
10.67 |
46.17 |
||
|
Newtonian |
12 |
19.24 |
|
|
|
Carreau |
14.67 |
23.75 |
||
|
Power-law |
10.24 |
46.78 |
||
|
Newtonian |
14 |
18.59 |
|
|
|
Carreau |
13.96 |
24.91 |
||
|
Power-law |
9.54 |
48.68 |
Numerical simulation is employed for a common carotid artery (CCA) with symmetrical 30 – 60% area reduction under flow pulsation conditions for Newtonian fluid and two other models of rheology. All of the blood models of rheology that are taken into consideration have the same WSS and wall pressure inclinations, while the magnitude of these parameters differs among the models. At the lowest pulsation, entrance flows, and when employing a power-law model for even elevated inlet velocities, the discriminations among blood models become more meaningful.
The main point to mark from this discussion is that alterations in the obstructed expansion have great impacts on the hemodynamic parameter distributions due to stenosis in several models. Hemodynamic parameters are greatly influenced by the stenosis LT and SL. Considering the time influences of pulsating flow suggests a clear connection between the temporal inflow velocities and WSS parameters. Elevated WSS values at the peak of the constriction happen when the maximum flow passes through the investigated artery. Due to the diastolic inlet flow, WSS declines, and big separation areas are made downstream of the blockage, giving a favorable zone to strengthen the plaque composition of the artery of disease. Increasing stenosis strength causes time average recirculation length and TAWSS to turn up to aggravate remarkably at the stenosis throat. It is significant to mention that the values of TAWSSG grow appreciably in the stenosis area for all models. The hemodynamic parameters, including OSI and RRT, display that the Newtonian model’s recirculation length increases by 24.91 and 48.68% for the Carreau model and power-law model. In the end, it has been viewed that the power-law model’s TAWSS is 41.91% less than that of the Newtonian model at 60% stenosis, and the recirculation length of the power-law model exhibits deviations of 48.68, 74.61, and 100% relative to the Newtonian model for stenosis levels of 60, 50, and 40%, respectively.
Conferred the troublesome role of stenosis in plaque composition and enhancement, the current findings point out that atherosclerotic risk factors differ in order to SL and stenosis LT as an atheroma develops softly and their relation depicts in an inverse manner. The longer stenosis throat raises recirculation length by 36.36% compared to smaller lengths in the power-law model, increasing the risk of thrombosis. The present study can be extended in the future for a 3D patient-specific geometric model in the fluid-structure interaction technique.
|
CCA |
common carotid artery |
|
LT |
throat length of stenosis |
|
OSI |
oscillatory shear index |
|
RRT |
relative residence time |
|
SL |
stenosis length |
|
T |
cardiac cycle period |
|
TA |
time average |
|
TAWSS |
time average wall shear stress |
|
WSS |
wall shear stress |
|
WSSG |
wall shear stress gradient |
|
$\tau$ |
stress tensor |
|
$\tau_w$ |
shear stress vector |
[1] Ahmed, S.A., Giddens, D.P. (1984). Pulsatile poststenotic flow studies with laser Doppler anemometry. Journal of Biomechanics, 17(9): 695-705. https://doi.org/10.1016/0021-9290(84)90123-4
[2] Ojha, M., Cobbold, R.S.C., Johnston, K.W., Hummel, R.L. (1989). Pulsatile flow through constricted tubes: An experimental investigation using photochromic tracer methods. Journal of Fluid Mechanics, 203: 173-197. https://doi.org/10.1017/S0022112089001424
[3] Long, Q., Xu, X.Y., Ramnarine, K.V., Hoskins, P. (2001). Numerical investigation of physiologically realistic pulsatile flow through arterial stenosis. Journal of Biomechanics, 34(10): 1229-1242. https://doi.org/10.1016/S0021-9290(01)00100-2
[4] Kaid, N., Benyamina, L., Menni, Y., Alkhafaji, M.A., Bayram, M., Alshammari, B.M., Kolsi, L. (2024). Unveiling hemodynamic pulsatile flow dynamics in carotid artery stenosis: Insights from computational fluid dynamics. AIP Advances, 14(6): 065128. https://doi.org/10.1063/5.0216867
[5] Hasan, A.B.M.T., Datta, D.K. (2008). Numerical simulation of sinusoidal fluctuated pulsatile laminar flow through stenotic artery. Journal of Applied Fluid Mechanics, 1(2): 25-35. https://doi.org/10.36884/jafm.1.02.11845
[6] Razavi, A., Shirani, E., Sadeghi, M.R. (2011). Numerical simulation of blood pulsatile flow in a stenosed carotid artery using different rheological models. Journal of Biomechanics, 44(11): 2021-2030. https://doi.org/10.1016/j.jbiomech.2011.04.023
[7] Amoo, T., Oriaifo, O., Ayeni, A. (2024). Computational simulation of the effects of blood flow velocity on atherosclerosis progression in a human carotid artery. F1000Research, 13: 426. https://doi.org/10.12688/f1000research.144183.1
[8] Udupa, M.C., Saha, S., Natarajan, S. (2025). Study of blood flow patterns in a stenosed artery through the combined effect of body acceleration and generalized womersley solution. Scientific Reports, 15: 1845. https://doi.org/10.1038/s41598-025-85566-2
[9] Fatouraee, N., Deng, X.Y., De Champlain, A., Guidoin, R. (1998). Concentration polarization in the arterial system. Annals of the New York Academy of Sciences, 858(1): 137-146. https://doi.org/10.1111/j.1749-6632.1998.tb10148.x
[10] Bayat, P., Tavakoli, M.R. (2019). Study of pulsatile flow in common carotid artery with different stenosis shapes within various wall conditions. Journal of Applied Fluid Mechanics, 12(1): 51-59. https://doi.org/10.29252/jafm.75.253.28895
[11] Karimi, S., Dadvar, M., Dabagh, M., Jalali, P., Modarress, H., Dabir, B. (2013). Simulation of pulsatile blood flow through stenotic artery considering different blood rheologies: Comparison of 3D and 2D axisymmetric models. Biomedical Engineering: Applications, Basis and Communications, 25(2): 1350023. https://doi.org/10.4015/S1016237213500233
[12] Trigui, A., Chiekh, M.B., Bera, J.C., Gilles, B. (2021). Experimental and numerical investigation of pulsed flows in a severe aortic stenosed model. Medical Engineering & Physics, 90: 33-42. https://doi.org/10.1016/j.medengphy.2021.02.006
[13] Nagargoje, M., Gupta, R. (2020). Effect of asymmetry on the flow behavior in an idealized arterial bifurcation. Computer Methods in Biomechanics and Biomedical Engineering, 23(6): 232-247. https://doi.org/10.1080/10255842.2019.1711068
[14] Yang, J.X., Zhang, Y., Xue, J.Z., Guo, Y.X., Liu, S.Y., Yao, Y.X., Zhong, H.M., Quan, A.L., Yang, J.B. (2025). Hemodynamic effects of stenosis with varying severity in different segments of the carotid artery using computational fluid dynamics. Scientific Reports, 15: 4896. https://doi.org/10.1038/s41598-025-89100-2
[15] Elbanhawy, O., Guaily, A., Tosson, M. (2019). Finite element analysis of pulsatile blood flow in elastic artery. Journal of Applied Fluid Mechanics, 12(4): 1083-1091. https://doi.org/10.29252/jafm.12.04.29694
[16] Pedley, T.J. (1980). The Fluid Mechanics of Large Blood Vessels. Cambridge University Press. https://doi.org/10.1017/CBO9780511896996
[17] Bit, A., Alblawi, A., Chattopadhyay, H., Quais, Q.A., Benim, A.C., Rahimi-Gorji, M., Do, H.T. (2020). Three dimensional numerical analysis of hemodynamic of stenosed artery considering realistic outlet boundary conditions. Computer Methods and Programs in Biomedicine, 185: 105163. https://doi.org/10.1016/j.cmpb.2019.105163
[18] Hameed, M.S., Shah, A.A., Khan, M.I., Ali, A., Hussain, I., Bukhari, M.D. (2022). Comparison of blood flow analysis in stenosed and stented carotid artery bifurcation models. Cogent Engineering, 10(1). https://doi.org/10.1080/23311916.2022.2158624
[19] Roy, M., Sikarwar, B.S., Bhandwal, M., Ranjan, P. (2017). Modeling of blood flow in stenosed arteries. Procedia Computer Science, 115: 821-830. https://doi.org/10.1016/j.procs.2017.09.164
[20] Ferdows, M., Hoque, K.E., Bangalee, M.Z.I., Xenos, M.A. (2022). Wall shear stress indicators influence the regular hemodynamic conditions in coronary main arterial diseases: Cardiovascular abnormalities. Computer Methods in Biomechanics and Biomedical Engineering, 26(2): 235-248. https://doi.org/10.1080/10255842.2022.2054660
[21] Buradi, A., Mahalingam, A. (2018). Effect of stenosis severity on wall shear stress based hemodynamic descriptors using multiphase mixture theory. Journal of Applied Fluid Mechanics, 11(6): 1497-1509. https://doi.org/10.29252/jafm.11.06.29062
[22] Mendiera, J.B., Fontanarosa, D., Wang, J.Q., Paritala, P.K., McGahan, T., Lloyd, T., Li, Z.Y. (2020). The importance of blood rheology in patient-specific computational fluid dynamics simulation of stenotic carotid arteries. Biomechanics and Modeling in Mechanobiology, 19(5): 1477-1490. https://doi.org/10.1007/s10237-019-01282-7
[23] Sharma, B.D., Yadav, P.K., Filippov, A. (2017). A Jeffrey-fluid model of blood flow in tubes with stenosis. Colloid Journal, 79: 849-856. https://doi.org/10.1134/S1061933X1706014X
[24] Tian, F.B., Zhu, L.D., Fok, P.W., Lu, X.Y. (2013). Simulation of a pulsatile non-Newtonian flow past a stenosed 2D artery with atherosclerosis. Computers in Biology and Medicine, 43(9): 1098-1113. https://doi.org/10.1016/j.compbiomed.2013.05.023
[25] Wang, F., Shi, W.S., Zhang, H.B., Hou, H.Z., Li, N. (2025). Linear surrogate modeling for predicting hemodynamic in carotid artery stenosis during exercise conditions. Chinese Journal of Physics, 94: 262-273. https://doi.org/10.1016/j.cjph.2025.01.006
[26] Alagbe, E.E., Amoo, T.E., Ayeni, A.O., Oyedele, O.S., Ashiekaa, V.D. (2022). Computational simulation of atherosclerosis progression associated with blood pressure in a 2D idealized human carotid artery model. The Open Chemical Engineering Journal, 16: E187412312205260. https://doi.org/10.2174/18741231-v16-e2205260
[27] Huang, Q.H., Xu, J.Y., Cheng, J.Y., Wang, S.Z., Wang, K.Z., Liu, J.M. (2013). Hemodynamic changes by flow diverters in rabbit aneurysm models: A computational fluid dynamic study based on micro–computed tomography reconstruction. Stroke, 44(7): 1936-1941. https://doi.org/10.1161/STROKEAHA.113.001202
[28] Praharaj, P., Sonawane, C., Pandey, A., Kumar, V., Warke, A., Panchal, H., Ibrahim, R., Prakash, C. (2023). Numerical analysis of hemodynamic parameters in stenosed arteries under pulsatile flow conditions. Medicine and Novel Technology and Devices, 20: 100265. https://doi.org/10.1016/j.medntd.2023.100265
[29] Cho, Y.I., Kensey, K.R. (1991). Effects of non-Newtonian viscosity of blood on flows in a diseased arterial vessel. Part 1: Steady flows. Biorheology, 28(3-4): 241-262. https://doi.org/10.3233/BIR-1991-283-415
[30] Chan, W.Y., Ding, Y., Tu, J.Y. (2007). Modeling of non-Newtonian blood flow through a stenosed artery incorporating fluid-structure interaction. The ANZIAM Journal, 47: C507-C523. https://doi.org/10.21914/anziamj.v47i0.1059
[31] Baratchi, S., Khoshmanesh, K., Woodman, O.L., Potocnik, S., Peter, K., Mclntyre, P. (2017). Molecular sensors of blood flow in endothelial cells. Trends in Molecular Medicine, 23(9): 850-868. https://doi.org/10.1016/j.molmed.2017.07.007
[32] Ylä-Herttuala, S., Bentzon, J.F., Daemen, M., Falk, E., et al. (2011). Stabilisation of atherosclerotic plaques. Thrombosis and Haemostasis, 106(1): 1-19. https://doi.org/10.1160/TH10-12-0784
[33] Kelidis, P., Konstantinidis, E. (2018). Pulsatile flow through a constricted tube: Effect of stenosis morphology on hemodynamic parameters. Computer Methods in Biomechanics and Biomedical Engineering, 21(7): 479-487. https://doi.org/10.1080/10255842.2018.1481505