Arif Setiawan*![]() | R. Rizal Isnanto
| R. Rizal Isnanto![]()
© 2025 The authors. This article is published by IIETA and is licensed under the CC BY 4.0 license (http://creativecommons.org/licenses/by/4.0/).
OPEN ACCESS
The eye is the most important sense organ for humans and is susceptible to several diseases. An example is retinal detachment, which is a condition where an injury or tear separates retina from its blood vessels. There is currently no method that can detect the areas of retinal detachment using digital fundus image analysis. Therefore, this study aims to propose a new method for detecting retinal detachment areas using contour feature analysis and blob detection. The method was designed to work in six stages, which included preparing retinal detachment fundus image data, converting the format into grayscale, performing morphological processing, as well as applying edge detection, region of interest (ROI) detection, and blob detection. Moreover, the accuracy of retinal detachment detection was assessed using keypoint performance, which reflects the number of detected areas. The keypoint performance for blob detection was determined using the Laplacian of Gaussian (LoG), Difference of Gaussian (DoG), and Determinant of Hessian (DoH) methods, with the average values of the performance found to be 96.16, 68, and 79.66, respectively. The results show that LoG has the highest keypoint performance value among the three methods.
retinal detachment, fundus image, image analysis, blob detection, region of interest
Eye is the most important sense of sight for humans [1] and prone to some diseases [2]. The adult human eye consists of more than 50,000 cells which leads to thousands of genetic variants of abnormalities and diseases [3, 4]. Some of these diseases include retinopathy, glaucoma, retinal detachment (RD), and cataracts [5, 6].
RD is a disease where eye experiences retinal tears, vitreoretinal traction, or fluid accumulation [7]. It is also explained as a condition where an injury or tear separates retina from blood vessels [8]. The disease is an eye emergency that requires immediate treatment to prevent the patient from losing vision permanently. This is due to the ability to cause blindness when not treated. The situation becomes more serious because doctors and retina-specialized medical personnel are very limited in several countries [9]. Some of the causes of RD include being over 50 years old, previous eye surgery [10], eye injury due to impact with a blunt object, and inflammation or infection [11]. Early identification can assist patients in restoring vision by reattaching the injured retina using a computer-based screening tool. This is possible through the usage of retinal fundus images that record the results of eye visualization [12]. Retinal fundus images are important to the scientific development of medical image analysis. Previous studies have analyzed eye diseases, including diabetic retinopathy, glaucoma, and RD [5] with retinal fundus imaging identified as the initial step for the examination. The method is considered advantageous due to its low cost and easy image capture [13].
Image segmentation is a process widely used to detect objects and identify the information contained in digital images [1, 14]. The application of the process to retinal blood vessels using digital image processing methods is a very important method in assessing eye health. Moreover, digital image processing combined with machine and deep learning increases the level of accuracy of the results [13]. An example of the segmentation process is thresholding which is widely used in image processing and computer vision to separate objects from the background and foreground [15]. This is often followed by contour segmentation which detects and extracts image edge [16].
The segmentation of medical digital images needs to be studied. This is necessary because medical image analysis is highly required in the health sector throughout the world. The application of segmentation to medical images can be achieved based on several methods with a focus on the size, shape, and area [17]. For example, edge detection method determines the sides of objects in digital images, matches templates, and extracts the front edge and background. The advantages include high accuracy, popularity, suitability for monitoring at any time during the process, and lack of modification to the object [18]. Blob detectors also detect certain areas in digital images with a focus on region of interest (ROI) [19]. Moreover, the normalized Laplacian of Gaussian (LoG) operator has been used to produce a Gaussian kernel-based method with other versions such as Difference of Gaussian (DoG) and Determinant of Hessian (DoH) [20].
A previous study by Yadav et al. [21] explained segmentation and visualization of RD using retinal fundus images. The Multi Res U-Net framework developed into DCA-Multi Res U-Net was applied to the data retrieved from Retinal Image Bank, RIADD, Kaggle, and Cataract Image Dataset or GitHub. Another study by Yadav et al. [22] discussed the neural network optimized for classifying RD using fundus images. This was achieved through the application of the ResNet50 architecture to extract digital retina image characteristics. The Opti-EN-net method developed in the study produced a high accuracy value reaching 99.44%. Subsequent study by Yadav et al. [23] classified RD in fundus images using a hybrid network through wavelets. A new VGG19-Bidirectional method was introduced for feature extraction and the accuracy was found to be 98.21%. Greig also conducted multimodal imaging studies to confirm the presence of retinoschisis RD with choroideremia using optical coherence tomography (OCT) to confirm the presence of retinoschisis in retinal detachment [6].
Lai conducted ultrasonography imaging of peripheral macrocysts for patients with proliferative diabetic retinopathy (PDR) and RD complications using B-Scan ultrasound [24]. Another study by Corradetti explained digital images of RD using Mirante color photography and retro lighting mode. The area detected using the superotemporal method showed the presence of RD in both eyes with a horseshoe-shaped tear [25]. Moreover, Koh developed a method for automatic detection of RD using ultrasound images in order to assist ophthalmologists during the assessment of patients. This is because RD causes cloudiness which leads to difficulty for eyes to see. Higher-order spectral (HOS) and locality-sensitive discriminant analysis (LSDA) were developed in the study using Support Vector Machine (SVM) method and the process obtained an accuracy of 99.13% [9].
Savastano predicted the recovery of visual acuity after RD surgery using artificial intelligence by calculating the feasibility value of OCT biomarkers segmentation. The results showed that Naïve Bayes machine learning method and OCT biomarkers had the highest accuracy [8]. Huang also explained the differences in fundus images for peripheral retinoschisis, schisis detachment, and RD using 22 patients. The results showed that spectral domain optical coherence tomography (SD-OCT) diagnosed retinoschisis in retinal detachment [26]. Furthermore, Moura characterized and determined the severity of RD using OCT by measuring retinal fluid and limiting membrane. The visualization was designed to facilitate the work of doctors in diagnosing the disease [27].
The automatic diagnosis of eye diseases such as RD is highly needed in the medical world to ensure immediate and accurate assessment by doctors [28]. Previous studies did not provide methods to detect areas of RD in digital fundus images through analysis. This study aims to propose a new method using image analysis to detect RD areas based on grayscale images and morphology as well as edge, ROI, and blob detection processes. The preference for the method is due to the light computational process and the ability to be specific in the detection process. Moreover, the focus is to detect RD areas in fundus images and compare blob detection algorithms to determine the highest keypoint performance value.
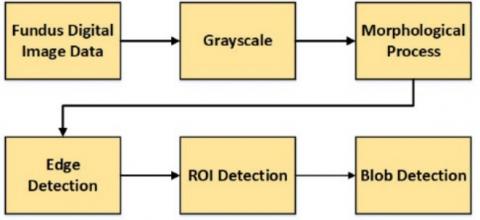
This study was conducted in several stages, including the collection of RD digital fundus image data and changing from RGB to a grayscale format. The next stage was the morphology process applied to form objects from the grayscale images with a focus on dilation and close. Moreover, edge was detected using the Canny method. This edge detection process detects the appearance of edge due to the variations in the color brightness intensity of digital images.
ROI detection process was subsequently applied to determine RD fundus area in digital images. This was followed by the application of blob detection process. The comprehensive information about the stages is presented in Figure 1.
Figure 1. Study flow
The preprocessing activities conducted include the segmentation of digital images by changing RGB format to grayscale and the next stage was the application of the dilation and close morphology processes [29, 30]. The brightness level of a grayscale image ranges from black to white [31]. The intensity is often used to determine the grayscale value [32]. Moreover, the grayscale image was converted to the binary format through thresholding [33]. The process separated the foreground and background [34] based on the pixel values in the fundus image [15]. The dilation process was used to thicken the objects in the binary images while the close process filled the gaps. The two pixels were divided into classes which were background Cb and foreground Cf by assigning a threshold value t:
$Cb=\left[ 1,2,3\ldots t \right]$ (1)
$Cf=\left[ t+1,~t+2,~t+3\ldots L \right]$ (2)
The variances for the background and foreground of the threshold t were determined as follows:
Background Cb,
$Weight~Wb=\mathop{\sum }_{i=1}^{t}\frac{{{n}_{i}}}{N}$ (3)
$Mean~\mu b~=\frac{\mathop{\sum }_{i=1}^{t}i*{{n}_{i}}}{\mathop{\sum }_{i=1}^{t}{{n}_{i}}}$ (4)
$Variance~\sigma _{b}^{2}=~\frac{\mathop{\sum }_{i=1}^{t}{{\left( i-{{\mu }_{b}} \right)}^{2}}*{{n}_{i}}}{\mathop{\sum }_{i=1}^{t}{{n}_{i}}}$ (5)
Foreground Cf,
$Weight~Wf~=~\mathop{\sum }_{i=1+1}^{L}\frac{{{n}_{i}}}{N}$ (6)
$Mean~\mu b~=\frac{\mathop{\sum }_{i=1}^{L}i*{{n}_{i}}}{\mathop{\sum }_{i=1}^{L}{{n}_{i}}}$ (7)
$Variance~\sigma _{f}^{2}=~\frac{\mathop{\sum }_{i=1+1}^{L}{{\left( i-{{\mu }_{f}} \right)}^{2}}*{{n}_{i}}}{\mathop{\sum }_{i=1+1}^{L}{{n}_{i}}}$ (8)
The variance in class $\sigma _{w}^{2}$ is the sum of two variances multiplied by the weight. This is mathematically presented as follows:
$\sigma _{w}^{2}=~{{W}_{b}}\sigma _{b}^{2}+{{W}_{f}}\sigma _{f}^{2}$ (9)
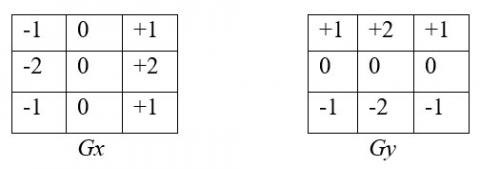
The next stage was to detect edge using the Canny method [35]. This was necessary to determine edge boundaries of RD area by detecting the contours [36]. The processes implemented through the Canny method were image smoothing, calculation of the maximum pixel value on the gradient, and the determination of edge point at the end of the gradient [16]. The preference for this method was due to the ability to produce the best results when compared to the others by eliminating interference around the object [37]. The kernel formula used is presented as follows and explained in Figure 2.
$G\left( x+y \right)=\frac{1}{2x{{\delta }^{2}}}\exp \left( -\frac{{{x}^{2}}+{{y}^{2}}}{2x{{\delta }^{2}}} \right)$ (10)
Figure 2. The kernel used in the Canny method
ROI detection was subsequently applied to determine the boundaries of certain areas in RD digital fundus images [38, 39]. The boundaries detected were part of retina with RD. Meanwhile, ROI applied in this study was limited by using colored frames in the desired area [40] to ensure the focus of the processing was only on RD. The process was also used for noise reduction in order to obtain more accurate results [21]. A square format was applied to crop the minimum boundary for RD area [40].
Blob detection was based on an area-scale representation of the images. This was achieved by superimposing the smoothed scale onto the representation. An important observation is that different types of multiscale differential operators produce several blob sizes in the scale space domain. A frequently used algorithm is the multiscale Gaussian kernel. Moreover, the normalized LoG operator produces a Gaussian kernel-based method and other versions such as DoG and DoH [23]. Additional features such as color or texture were included in the conventional detection process. Descriptors were also used to enhance the feature vectors from the original image using the boundaries of each blob at all scales. The extraction of the feature vectors from the original image was conducted to avoid blur. The stability of the feature vectors was characterized using Eq. (13). Where, f = [f1, f2, f3…, fn] and g = [g1, g2, g3…, gn] are feature vectors corresponding to two candidate blobs and dist is the Euclidean distance [22].
$S=\frac{1}{dist\left( f,g \right)}$ (11)
LoG of an input image f(x,y) is masked with the following Gaussian kernel:
$g\left( x,y,t \right)=\frac{1}{2\pi t}{{e}^{-\frac{{{x}^{2}}+{{y}^{2}}}{2t}}}$ (12)
A certain scale t designed for space representation leads to the application of the following Laplacian operator:
$L\left( x,y;t \right)=g\left( x,y,t \right)*~f\left( x,y \right)$ (13)
${{\nabla }^{2}}L={{L}_{xx}}+{{L}_{yy}}$ (14)
DOG associated with the scale representation L(x,y,t) is as follows:
$\partial_t L=\frac{1}{2} \nabla^2 L$ (15)
The Laplacian operator of Gaussian $\nabla _{norm}^{2}L\left( x,y;t \right)$ can be calculated as the difference in the Gaussian smoothing limits of two images:
$\nabla_{\text {norm }}^2 L(x, y ; t) \approx \frac{t}{\Delta t(L(x, y ; t+\Delta t)-L(x, y ; t))}$ (16)
DoH is calculated as follows:
$det{{H}_{norm}}L={{t}^{2}}\left( {{L}_{xx}}{{L}_{yy}}-L_{xy}^{2} \right)$ (17)
where, HL is the Hessian matrix presented as follows:
$\begin{matrix} (x,y;t=\text{argmaxloca}{{\text{l}}_{\left( x,y,t \right)}}\left( \left( \text{det}{{H}_{\text{norm }\!\!~\!\!\text{ }}}L \right)\left( x,y;t \right) \right) \\ \end{matrix}$ (18)
Blob point (x, y) and scale t are defined through the geometric differential operations. The process produces blob descriptor that is covariant with rotation and scaling in the image domain (41). Moreover, feature matching is the process of determining points in the image area from blob detector in the methods used. Each point is encoded as a binary descriptor D(i) as presented in the following Eq. (19) [41].
$Hd=\underset{k=1}{\overset{z}{\mathop \sum }}\,XOR\left( \beta {{D}_{k}}\left( i \right),\beta {{D}_{k}}\left( j \right) \right.$ (19)
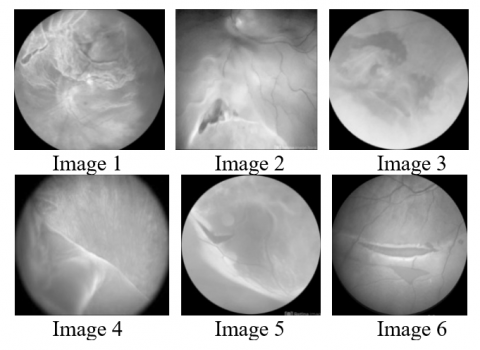
The data used in this study were obtained from Retina Image Bank through the site: https://imagebank.asrs.org/. The focus was on six digital fundus images of RD showing a tear in retinal area as explained in the description. The analysis was conducted by applying Python 3 to the six digital images of the bottom shrimp water. The experiment was initiated by changing the original image into a grayscale format as presented in Figure 3.
Figure 3. RD digital fundus images
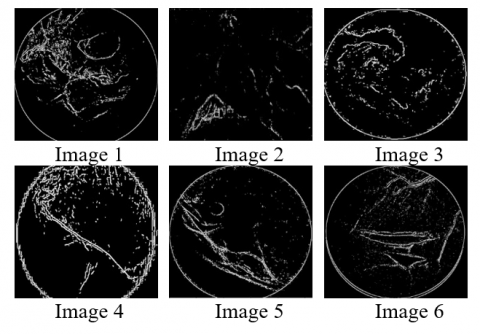
Edge of digital fundus images was detected using the Canny algorithm with the results presented in Figure 4. This was followed by ROI detection process to recognize RD contour as presented in Figure 5.
Figure 4. Edge detection in RD digital fundus images
Figure 5. ROI detection in RD digital fundus images
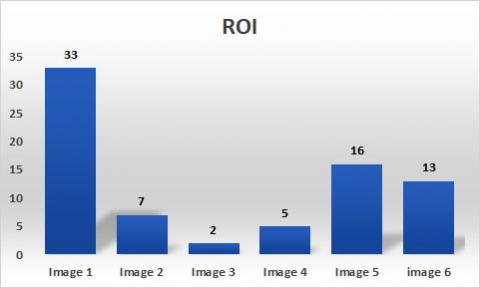
The experiment showed that each image had a different number of ROI. Image 1 had 33, Image 2 had 7, Image 3 had 2, Image 4 had 5, Image 5 had 16, and Image 6 had 12. The parts detected are presented in Figure 6 while ROI of each image used for blob detection process is in Figure 7.
Figure 6. Number of ROI detected in the RD
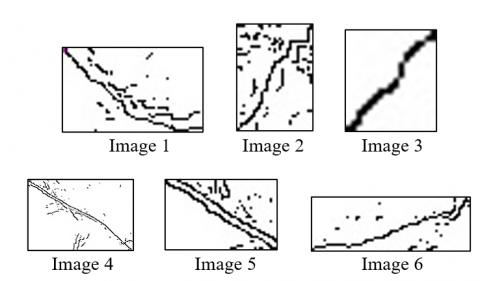
Figure 7. ROI selected for blob detection process
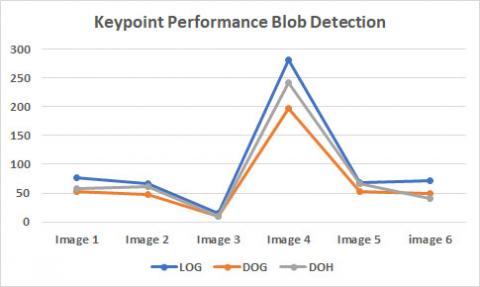
Blob detection was used to determine the contour of RD using LoG, DoG, and DoH methods. The results were subsequently used to produce the keypoint performance values for the six images as distributed in Figure 8.
Figure 8. Results of blob detection process using LoG, DoG, and DoH algorithms
The results showed that RD areas could be detected using blob detector. Figure 9 shows that LoG produces keypoint performance with an average of 96.16, DoG has 68, and DoH has 79.66. The criterion is that a higher number of detected blobs represents better keypoint performance.
Figure 9. Keypoint performance of blob image detection methods
The comparison of LoG to DoG and DoH showed a reduction in the average keypoint performance by 29% and 17%, respectively. The results showed that LoG method had the best performance and could detect more RD areas in digital fundus images using blob detector. The trend was associated with the ability of the method to detect circular lumps down to the smallest size [42]. It also has the capacity to divide large, elongated, or irregularly shaped objects into two or more blobs [20]. Moreover, the standard deviation value of LoG algorithm increased continuously and was accommodated in a box as the maximum.
In conclusion, this study produced a new hybrid method for detecting RD areas in digital fundus images through the combination of edge, ROI, and blob detection processes. The trend was observed from the fact that the Canny edge detection method successfully identified edge boundaries of retinal structures. This was useful for distinguishing between normal retinal tissue and areas affected by ablation. Moreover, ROI detection produced the highest value which was in the form of 33 detected areas. Blob detection through LoG method also had the highest average keypoint performance value of 96.16. The results showed that the combination of the Canny edge, ROI, and LoG blob detection processes could effectively detect small areas of RD. Future studies should measure the length of retinal detachment wounds by analyzing fundus images and classify different types of eye diseases.
Authors are grateful to the WCU Universitas Diponegoro for the funds and Universitas Muria Kudus for the support provided for this study.
|
Cb |
Image background |
|
Cf |
Image foreground |
|
W |
Image background weight |
|
S |
Vektor of candidate blob |
|
H |
Blob detector binary descriptor |
|
Greek symbols |
|
|
µ |
Average of background & foreground |
|
$\sigma $ |
Variance of background & foreground |
|
$\nabla $ |
Laplacian operator |
|
∂ |
Laplacian scale |
|
Subscripts |
|
|
b |
Background parameter |
|
f |
Foreground parameter |
|
t |
Threshold value |
[1] Abdellatif, H., Taha, T.E., El-Shanawany, R., Zahran, O., Abd El-Samie, F.E. (2022). Efficient ROI-based compression of mammography images. Biomedical Signal Processing and Control, 77: 103721. https://doi.org/10.1016/j.bspc.2022.103721
[2] Hagara, M., Stojanović, R., Bagala, T., Kubinec, P., Ondráček, O. (2020). Grayscale image formats for edge detection and for its FPGA implementation. Microprocessors and Microsystems, 75: 103056. https://doi.org/10.1016/j.micpro.2020.103056
[3] Corradetti, G., Corvi, F., Sadda, S.R. (2021). Bilateral retinal detachment imaged by Mirante color photography and retro mode illumination. Canadian Journal of Ophthalmology, 56(4): 279. https://doi.org/10.1016/j.jcjo.2020.11.001
[4] Du, S., Luo, K., Zhi, Y., Situ, H., Zhang, J. (2022). Binarization of grayscale quantum image denoted with novel enhanced quantum representations. Results in Physics, 39: 105710. https://doi.org/10.1016/j.rinp.2022.105710
[5] Gao, K., Niu, S., Ji, Z., Wu, M., et al. (2019). Double-branched and area-constraint fully convolutional networks for automated serous retinal detachment segmentation in SD-OCT images. Computer Methods and Programs in Biomedicine, 176: 69-80. https://doi.org/10.1016/j.cmpb.2019.04.027
[6] Greig, L.C., Gutierrez, K.G., Oh, J.K., Levi, S.R., Korot, E., Tsang, S.H., Mahajan, V.B. (2022). Multimodal imaging reveals retinoschisis masquerading as retinal detachment in patients with choroideremia. American Journal of Ophthalmology Case Reports, 26: 101543. https://doi.org/10.1016/j.ajoc.2022.101543
[7] Halder, N., Roy, D., Roy, P., Roy, P. (2016). Qualitative comparison of OTSU thresholding with morphology based thresholding for vessels segmentation of retinal fundus images of human eye. IOSR Journal of VLSI and Signal Processing (IOSR-JVSP), 6(3): 41-48. https://doi.org/10.9790/4200-0603024148
[8] He, H.J., Zheng, C., Sun, D.W. (2016). Image segmentation techniques. In Computer Vision Technology for Food Quality Evaluation, pp. 45-63. https://doi.org/10.1016/B978-0-12-802232-0.00002-5
[9] Hu, Q., Xu, X., Leng, D., Shu, L., Jiang, X., Virk, M., Yin, P. (2021). A method for measuring ice thickness of wind turbine blades based on edge detection. Cold Regions Science and Technology, 192: 103398. https://doi.org/10.1016/j.coldregions.2021.103398
[10] Huang, M., Liu, Y., Yang, Y. (2022). Edge detection of ore and rock on the surface of explosion pile based on improved Canny operator. Alexandria Engineering Journal, 61(12): 10769-10777. https://doi.org/10.1016/j.aej.2022.04.019
[11] Huang, N.T., Georgiadis, C., Gomez, J., Tang, P.H., et al. (2020). Comparing fundus autofluorescence and infrared imaging findings of peripheral retinoschisis, schisis detachment, and retinal detachment. American Journal of Ophthalmology Case Reports, 18: 100666. https://doi.org/10.1016/j.ajoc.2020.100666
[12] Islam, R., Islam, M.R., Talukder, K.H. (2022). An efficient ROI detection algorithm for Bangla text extraction and recognition from natural scene images. Journal of King Saud University-Computer and Information Sciences, 34(8): 6150-6164. https://doi.org/10.1016/j.jksuci.2022.02.001
[13] Isnanto, R.R. (2014). Iris recognition analysis using biorthogonal wavelets transform for feature extraction. In 2014 the 1st International Conference on Information Technology, Computer, and Electrical Engineering, Semarang, Indonesia, pp. 183-187. https://doi.org/10.1109/ICITACEE.2014.7065738
[14] Isnanto, R.R. (2015). Wavelet types comparison for extracting iris feature based on energy compaction. In Journal of Physics: Conference Series, 622(1): 012042. https://doi.org/10.1088/1742-6596/622/1/012042
[15] Isnanto, R.R., Satoto, K.I., Windasari, I.P. (2014). Constructing irislet: A new wavelet type which matched for iris image characteristics. In 2014 2nd International Conference on Information and Communication Technology (ICoICT), Bandung, Indonesia, pp. 232-237. https://doi.org/10.1109/ICoICT.2014.6914071
[16] Jan, M.M., Zainal, N., Jamaludin, S. (2020). Region of interest-based image retrieval techniques: A review. IAES International Journal of Artificial Intelligence, 9(3): 520-528. https://doi.org/10.11591/ijai.v9.i3.pp520-528
[17] Koh, J.E.W., Raghavendra, U., Gudigar, A., Ping, O.C., et al. (2020). A novel hybrid approach for automated detection of retinal detachment using ultrasound images. Computers in Biology and Medicine, 120: 103704. https://doi.org/10.1016/j.compbiomed.2020.103704
[18] Lai, E.W., Schechet, S.A. (2022). Ultrasound imaging of extensive peripheral macrocysts in chronic total combined rhegmatogenous-traction retinal detachment. American Journal of Ophthalmology Case Reports, 27: 101604. https://doi.org/10.1016/j.ajoc.2022.101604
[19] Li, J., Li, A., Liu, Y., Yang, L., Gao, G. (2025). An adaptive fundus retinal vessel segmentation model capable of adapting to the complex structure of blood vessels. Biomedical Signal Processing and Control, 101: 107150. https://doi.org/10.1016/j.bspc.2024.107150
[20] Li, O., Shui, P.L. (2020). Subpixel blob localization and shape estimation by gradient search in parameter space of anisotropic Gaussian kernels. Signal Processing, 171: 107495. https://doi.org/10.1016/j.sigpro.2020.107495
[21] Yadav, S., Mandal, S., Murugan, R., Goel, T., Ahmed, T. (2024). Segmentation and visualization of retinal detachment lesions through retinal fundus images. Biomedical Signal Processing and Control, 96: 106627. https://doi.org/10.1016/j.bspc.2024.106627
[22] Yadav, S., Murugan, R., Goel, T. (2024). Opti-EN-net: Optimized ensemble deep neural network for the classification of retinal detachment through fundus images. Biomedical Signal Processing and Control, 91: 105999. https://doi.org/10.1016/j.bspc.2024.105999
[23] Yadav, S., Murugan, R., Goel, T. (2023). H-deep-Net: A deep hybrid network with stationary wavelet packet transforms for retinal detachment classification through fundus images. Medical Engineering & Physics, 120: 104048. https://doi.org/10.1016/j.medengphy.2023.104048
[24] Mohan, V.M., Kanaka Durga, R., Devathi, S., Srujan Raju, K. (2015). Image processing representation using binary image; grayscale, color image, and histogram. In Proceedings of the Second International Conference on Computer and Communication Technologies: IC3T 2015, New Delhi, India, pp. 353-361. https://doi.org/10.1007/978-81-322-2526-3_37
[25] de Moura, J., Novo, J., Penas, S., Ortega, M., Silva, J., Mendonça, A.M. (2018). Automatic characterization of the serous retinal detachment associated with the subretinal fluid presence in optical coherence tomography images. Procedia Computer Science, 126: 244-253. https://doi.org/10.1016/j.procs.2018.07.258
[26] Senthilkumaran, N., Vaithegi, S. (2016). Image segmentation by using thresholding techniques for medical images. Computer Science & Engineering: An International Journal, 6(1): 1-13. https://doi.org/10.5121/cseij.2016.6101
[27] Niyishaka, P., Bhagvati, C. (2020). Copy-move forgery detection using image blobs and BRISK feature. Multimedia Tools and Applications, 79(35): 26045-26059. https://doi.org/10.1007/s11042-020-09225-6
[28] Li, O., Shui, P.L. (2020). Subpixel blob localization and shape estimation by gradient search in parameter space of anisotropic Gaussian kernels. Signal Processing, 171: 107495. https://doi.org/10.1016/j.sigpro.2020.107495
[29] Priyadharsini, R., Sharmila, T.S. (2019). Object detection in underwater acoustic images using edge based segmentation method. Procedia Computer Science, 165: 759-765. https://doi.org/10.1016/j.procs.2020.01.015
[30] Rasche, C. (2018). Rapid contour detection for image classification. IET Image Processing, 12(4): 532-538. https://doi.org/10.1049/iet-ipr.2017.1066
[31] Sabatino, F., Banerjee, P., Muqit, M.M. (2024). Clinical therapeutics for proliferative vitreoretinopathy in retinal detachment. Survey of Ophthalmology, 69(4): 508-520. https://doi.org/10.1016/j.survophthal.2024.03.007
[32] Savastano, M.C., Crincoli, E., Savastano, A., Kilian, R., Rizzo, C., Rizzo, S. (2024). Prediction of postoperative visual acuity restoration in macula off rhegmatogenous retinal detachment using artificial intelligence. AJO International, 1(1): 100008. https://doi.org/10.1016/j.ajoint.2024.100008
[33] Sulaksono, N., Adi, K., Isnanto, R. (2025). Utilization of convolutional neural network in image interpretation techniques for detecting kidney disease. IAES International Journal of Artificial Intelligence, 14(1): 602-613. https://doi.org/10.11591/ijai.v14.i1.pp602-613
[34] Wang, G., Lopez-Molina, C., De Baets, B. (2020). Automated blob detection using iterative Laplacian of Gaussian filtering and unilateral second-order Gaussian kernels. Digital Signal Processing, 96: 102592. https://doi.org/10.1016/j.dsp.2019.102592
[35] Wang, S.K., Nair, S., Li, R., Kraft, K., et al. (2022). Single-cell multiome of the human retina and deep learning nominate causal variants in complex eye diseases. Cell Genomics, 2(8): 100164. https://doi.org/10.1016/j.xgen.2022.100164
[36] Widodo, C.E., Adi, K. (2020). Face geometry as a biometric-based identification system. Journal of Physics: Conference Series, 1524(1): 012008. https://doi.org/10.1088/1742-6596/1524/1/012008
[37] Wu, C., Zhang, X. (2022). Total Bregman divergence-driven possibilistic fuzzy clustering with kernel metric and local information for grayscale image segmentation. Pattern Recognition, 128: 108686. https://doi.org/10.1016/j.patcog.2022.108686
[38] Xiao, W., Lyu, Y. (2024). Human computer interaction product for infrared thermographic fundus retinal vessels image segmentation using U-Net. Journal of Radiation Research and Applied Sciences, 17(3): 101003. https://doi.org/10.1016/j.jrras.2024.101003
[39] Xu, W., Chen, H., Su, Q., Ji, C., Xu, W., Memon, M.S., Zhou, J. (2019). Shadow detection and removal in apple image segmentation under natural light conditions using an ultrametric contour map. Biosystems Engineering, 184: 142-154. https://doi.org/10.1016/j.biosystemseng.2019.06.016
[40] Xu, Y., Liu, H., Sun, R., Wang, H., Huo, Y., Wang, N., Hu, M. (2024). Deep learning for predicting circular retinal nerve fiber layer thickness from fundus photographs and diagnosing glaucoma. Heliyon, 10(13): e33813. https://doi.org/10.1016/j.heliyon.2024.e33813
[41] Zhang, G., Liu, J., Liu, Y., Zhao, J., Tian, L., Chen, Y. Q. (2018). Physical blob detector and multi-channel color shape descriptor for human detection. Journal of Visual Communication and Image Representation, 52: 13-23. https://doi.org/10.1016/j.jvcir.2018.01.013
[42] Zhang, H., Ju, X., Chi, D., Feng, L., et al. (2023). A neuromorphic bionic eye with broadband vision and biocompatibility using TIPS-pentacene-based phototransistor array retina. Applied Materials Today, 33: 101885. https://doi.org/10.1016/j.apmt.2023.101885