Jakfat Haekal*![]() | Rizaldi Mu’min
| Rizaldi Mu’min![]() | Fauzan
| Fauzan![]() | Abdul Hamid
| Abdul Hamid![]() | Didin Sjarifudin
| Didin Sjarifudin![]() | Andi Turseno
| Andi Turseno![]() | Paduloh
| Paduloh![]() | Andi Adriansyah
| Andi Adriansyah![]()
© 2025 The authors. This article is published by IIETA and is licensed under the CC BY 4.0 license (http://creativecommons.org/licenses/by/4.0/).
OPEN ACCESS
Cloud enterprise resource planning (CERP) systems are widely adopted to enhance operational efficiency. However, in a global context, ERP implementation failure rates remain notably high, ranging from 67% to 90%. If left unaddressed, they will hinder sustainable economic growth and industrial transformation. To address this issue, this study adopts a structured approach by identifying critical success factors (CSFs) based on key performance indicators (KPIs) using the Delphi method and Dempster-Shafer combination method. The resulting dataset integrates multi-stage CSFs and their associated KPI performance and weight values, forming a hybrid feature set that captures interrelated implementation factors. The effectiveness of each implementation stage is assessed through user feedback scores categorized as satisfactory (>4), below satisfactory (3.0–3.9), and failure (<3.0). To evaluate the predictive capability of this hybrid dataset, both artificial neural network (ANN) and random forest (RF) models were applied separately. Each model was trained and tested independently to identify which algorithm achieves higher prediction accuracy for implementation outcomes. The findings indicate that RF significantly outperforms ANN, with an accuracy of 0.849 compared to 0.765. Additionally, confusion matrix, ROC, and AUC analyses further confirm RF’s superior predictive capability. Through this research, the identification of CSFs through qualitative analysis or statistical modelling, combined with the integration of machine learning techniques, ultimately improving assessment classification for CERP implementation.
enterprise resource planning (ERP) implementation, cloud ERP, critical success factor, key performance indicators, artificial neural network, random forest
Cloud enterprise resource planning (CERP) systems enable organizations to streamline their business processes with this system, organizations can enhance employee productivity while improving user satisfaction by providing efficient and reliable support for business operations [1]. This connection shows CERP systems supporting Sustainable Development Goal (SDG) 8 (decent work and economic growth). CERP systems provide organizations with a competitive advantage by improvement of efficiency and reducing operational costs [2]. In the concept of Industry 4.0., they function as integral components of IT infrastructure, leveraging advanced technologies such as data exchange, cloud solutions, data analytics, and production support to create seamless and interconnected business environments [3]. These capabilities not only enhance organizational efficiency but also align CERP systems with SDG 9 (industry, innovation, and infrastructure). CERP system accelerates SDG 9 through modern infrastructure industry 4.0. These two SDGs are pivotal components for economic development in ASEAN and have been a priority sustainable goal to achieve, in addition, the rapid digital transformation in ASEAN also has underscored the need for enterprises to adopt CERP systems [4].
CERP system provides a powerful platform that integrates business processes for radically improving organization performance; however, its implementation carries challenges [5]. Globally, the failure rate of ERP system implementations is reported to range between 67% and 90%, highlighting the significant challenges organizations face in successfully adopting these systems [6].
Certainly, this is closely related to the challenges during the implementation [7]. CERP system implementation faces significant challenges across industries, with success rates remaining low despite research advancements [7, 8]. It happened due to several factors, including a lack of top management support and commitment [7, 9], especially in the early stage. If left unresolved, these failures can impede operational efficiency, escalate costs, and weaken organizational competitiveness which also hinder ASEAN countries to achieve the ninth sustainable goals.
To address these challenges, the identification of critical success factors (CSFs) is essential [10]. Key factors influencing CERP implementation success include management commitment [11-13], business process alignment and reengineering [10], and technology aspects such as software management [14] with minimal customization [10, 15]. Additionally, the workforce plays a pivotal role in implementation success; therefore, training [16] and project team effectiveness should receive more attention [11, 14, 15]. In addition, data is a central factor for the implementation; thus, it is also one of the CSFs that should be included [17].
Given the challenges associated with CERP implementation, accurately identifying and prioritizing CSFs is crucial for improving adoption rates and ensuring sustainable business transformation. Ineffective CERP adoption threatens economic resilience and fails to commit with SDG 8 and 9. Without intervention, businesses may struggle to keep pace with global leaders especially in the entire ASEAN.
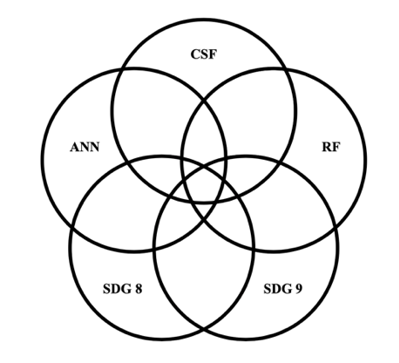
This indicates that utilizing machine learning models like ANN and RF can significantly enhance planning, prediction, and execution in achieving CERP implementation success, thereby contributing to SDG 8 and SDG 9. Artificial intelligence (AI) shown to be a significant contributor to advancing Sustainable Development Goals, particularly in promoting digital industrial innovation (SDG 9) and improving labor productivity and decent work conditions (SDG 8), through intelligent automation and data-driven optimization. Despite potential risks, AI offers significant opportunities to advance economic-related SDGs, with positive contributions identified in 70% of the targets, although 33% still face possible negative impacts [18]. The growing reliance of future markets on data analysis may widen economic disparities if digital resources remain unequally distributed, particularly in low- and middle-income countries, thereby hindering progress toward SDG 8 and SDG 9 [19], as described in Figure 1.
Figure 1. Venn diagram of CSF, ANN, RF, SDG 8, SDG 9 highlighting its relationship
The proposed model aligns with the evolving needs of Industry 4.0 by integrating intelligent decision-support mechanisms into CERP implementation strategies. Additionally, the study contributes to bridging the research gap in AI-driven CERP management, particularly in the ASEAN context, where failure rates remain high despite increasing digital transformation efforts [6, 7]. Ultimately, this research aims to support enterprises in effectively managing CERP implementation risks by providing an AI-driven recommendation system based on CSFs. The findings will aid stakeholders in aligning CERP adoption with best practices, enhancing operational efficiency, and contributing to SDG 9 by fostering digital innovation and sustainable IT infrastructure development.
2.1 Determining the CSFs based on KPIs
To determine the critical success factors (CSF), the research will employ the Delphi method and Dempster-Shafer combination method. Here, the CSF indicator of the project will be identified.
2.1.1 Delphi method
This method will involve assembling a panel of CERP experts, each with over ten years of experience, with more than five years of working experience in ERP implementation projects [20]. Additionally, a Delphi study broadens the theory's generalizability by gathering insights from experts with extensive and varied experience, strengthening its empirical foundation and increasing its applicability across various contexts [21]. Iterative rounds of questionnaires or interviews will be conducted, during which experts will provide their opinions on CSFs for CERP implementation, key performance indicators (KPIs) for those CSFs, and the weights assigned to these KPIs. Feedback from previous rounds will be anonymized and shared with the experts to refine their opinions. The goal is to achieve consensus among the experts on the critical elements required for successful CERP implementation.
2.1.2 Dempster-Shafer combination method
Dempster -Shafer Theory combines expert opinions [22] on the influence of KPIs, ultimately providing CSFs for CERP implementation. It allows experts to express uncertainty and conflicting views. This approach, using Dempster's rule to aggregate diverse perspectives, leads to a comprehensive and reliable evaluation of which KPIs truly drive successful CERP projects (which CSFs are most critical). This method will be used to aggregate the scores provided by the experts regarding the influence of individual KPIs. It is particularly suitable for combining diverse and independent professional opinions without imposing restrictions on the number of experts or requiring consistency checks.
2.1.3 Action case study
The research will include a real-world case study of organizations implementing CERP system within a medium-sized manufacturing company based in ASEAN. The company operates in the general manufacturing sector, producing a variety of industrial and consumer goods for domestic and regional markets. With approximately more than 350 employees and multiple operational units, including procurement, production, warehousing, and finance. The company aimed to enhance integration and efficiency through the implementation of a CERP system.
This case study will focus on addressing practical problems faced by the organization during the CERP implementation process. The action research is a popular method to collect qualitative information [23], it is frequently integrated with practice studies, interventions, and experiments to assess various guidelines, standards, methods, techniques, or tools [24].
The research engages both experts and practitioners in the process to address challenges and acquire new knowledge through reflective learning. Thus, findings from the Delphi Method and the Dempster-Shafer Combination Method will be applied [20, 22].
2.2 Development of performance assessment method
2.2.1 Combining CSFs and KPIs with stages
The list of CSF and KPI is derived from the combination of literature review and Delphi method with experts. Initially, through literature review, it has been identified 60 common ERP-related problems. These 60 problems were then compiled into CERP problem identification worksheet, as shown in Table 1, and sent to 10 CERP experts. The experts independently classified the problems based on which stage of CERP implementation they occurred in, using a 1 to 5 scale. After two rounds of evaluation, 30 problems were identified as critical, having a mean score of 4 or higher. The next step involved the experts defining the CSFs needed to address these 30 problems, mapping each CSF to the appropriate stage of the CERP implementation process. Since a single CSF could address multiple problems, this process resulted in a total of 15 CSFs (shown in Table 2). In the final phase, a subsequent literature review was conducted to identify relevant KPIs for measuring the effectiveness of each CSF. These KPIs, along with the previously defined CSFs, were then reviewed by the 10 CERP experts and practitioners for validation. After two rounds of Delphi evaluation, only those KPIs with a score of 4 or higher will be chosen.
2.2.2 Dempster-Shafer combination to determine KPIs weight
The D-S combination method is a powerful approach used in this study to integrate multiple sources of evidence, reducing uncertainty and enhancing decision-making. In CERP implementation, it will be helped by experts and related literature, which the details are shown in Table 1 and Table 2. This method helps identify the CSFs and their associated KPIs, ensuring a structured and data-driven evaluation.
Table 1. Experts profile
|
Experts |
Company Nature |
Job Nature |
ERP Experience (In Years) |
|
1 |
IT Consulting & CERP Implementation |
Odoo Middle Functional Consultant |
11 |
|
2 |
CERP Consulting |
Odoo Developer |
12 |
|
3 |
CERP Implementation & Business Process Consulting |
CERP Implementation and Change Management Specialist |
10 |
|
4 |
CERP Solutions Provider |
Odoo Developer |
11 |
|
5 |
CERP & Finance Consulting |
Odoo Functional Consultant |
11 |
|
6 |
IT Solutions |
Global Odoo Program Manager |
10 |
|
7 |
Business Process & CERP Consulting |
Client Success and Business Process Consultant |
12 |
|
8 |
IT Services & Odoo CERP Solution |
IT and Odoo Expert |
10 |
|
9 |
CERP Consulting |
Odoo ERP Consultant |
10 |
|
10 |
CERP, Finance & Business Intelligence Consulting |
CERP Consultant |
10 |
Table 2. Classification of CSFs into the CERP implementation stages
|
CERP Stage |
Critical Success Factor (CSF) |
Number of KPIs |
Literature |
|
Organization Readiness Assessment |
Top Management Support |
3 |
[25, 26] |
|
Effective Communication |
2 |
[27, 28] |
|
|
Employee Competence |
4 |
[25, 29] |
|
|
CERP Selection |
CERP and Implementation Partner’s Capability |
3 |
[25, 27] |
|
Balanced Evaluation Team |
4 |
[28, 30] |
|
|
Identification of Organizational Needs |
2 |
[25, 31] |
|
|
CERP Implementation |
Implementation cost |
5 |
[17, 29] |
|
Change Management |
3 |
[32, 28] |
|
|
Sufficient Training Resources |
4 |
[25, 26] |
|
|
CERP Final Preparation |
CERP Support & Training |
3 |
[17, 28, 29] |
|
IT & Data Management |
2 |
[32] |
|
|
Performance monitoring |
3 |
[25, 26] |
|
|
CERP Live Run |
Positive Customer Satisfaction |
4 |
[17, 31] |
|
System Operation Efficiency |
5 |
[25, 27, 28] |
|
|
Employee Productivity and Satisfaction |
3 |
[25, 29] |
The impact of each CSF within its CERP stage and the influence of each KPI on its corresponding CSF will be determined by ten industry experts and practitioners. They provided their assessments on a 1 to 5 rating scale, where 1 represented "strongly disagree" and 5 indicated "strongly agree" regarding the significance of each factor. These individual scores were synthesized using the D-S combination method. The weights of CSFs and KPIs were determined separately, with CSF weights assigned to their respective CERP stages and KPI weights assigned to their CSFs. The final KPI weight at the CERP stage level was then derived by multiplying these two values, allowing for a comprehensive and mathematically justified assessment.
2.2.3 Performance calculation and assessment
To evaluate the effectiveness of each CERP stage, a Performance Assessment Worksheet (PAW) was developed, serving as a structured tool for measuring CERP performance. The PAW collects user feedback scores, which are then used to determine the overall performance of the CERP implementation. These scores are compared against a predefined performance assessment scale and recommended actions to assess whether the CERP system is performing at an acceptable level.
2.2.4 Design step by step performance assessment and improvement flow
The implementation of CERP system involves a structured, phased approach to performance assessment and improvement, guided by the plan-do-check-act (PDCA) cycle. Initially, CERP steering committee assesses organizational readiness by defining strategic direction, reviewing CSFs and KPIs, and conducting a performance assessment. If readiness is unsatisfactory, remedial actions are implemented and tracked until acceptable levels are achieved.
Subsequent implementation stages (2-4) follow a similar pattern: the committee sets goals and objectives, reviews CSFs/KPIs, and an CERP working committee manages tasks, gathers progress reports, and facilitates feedback. Performance is assessed, and if satisfactory, the project advances; otherwise, remedial actions are taken. Post-implementation (live-run), performance is measured in terms of business outcomes. The scale is outlined in Table 3. Goals and objectives are defined, CSFs/KPIs derived, and performance assessed with external stakeholders.
Table 3. Performance assessment scale and recommended action
|
Stage Performance |
Assessment Result |
Colour Grade |
Recommended Action |
|
≥4 |
Satisfactory |
Green |
The next stage can be proceeded. |
|
3.0-3.9 |
Below Satisfactory |
Yellow |
Identify deeper the problem before moving to the next stage like root causes and targeted action plan until it is on the green grade. |
|
<3 |
Failed the test |
Red |
Re-evaluate the chosen KPIs and consider if they accurately reflect the CSF's success. Do not proceed with related CERP activities until a reassessment demonstrates significant improvement in the CSF score. |
2.3 Data pre-processing
Data pre-processing steps are performed before training the models, to ensure the dataset is clean, consistent, and suitable for machine learning algorithms [33]. The dataset employed in this study comprises 20 companies, each evaluated across 15 CSFs, resulting in a total of 300 data points and four features. Any missing values in the dataset are handled using appropriate techniques. The process also involves addressing class imbalance in the target variable [34]. which in this study is the “status” indicating the performance classification of each CSF as Green (satisfactory), Yellow (below satisfactory), or Red (failed the test). If class imbalance issue occurs, the Synthetic Minority Over-sampling Technique (SMOTE) will be applied. SMOTE is an advanced oversampling method that generates synthetic examples for the minority classes [35] by interpolating between existing instances. Unlike simple replication, SMOTE creates new, plausible samples that help the model learn the decision boundaries for underrepresented classes more effectively [36]. Once data being balanced and cleaned, then it can be processed by machine learning algorithms.
2.4 Application of RF and ANN methods
Artificial Neural Networks (ANNs) are computational models inspired by the human brain, designed to recognize patterns and relationships in data. An ANN typically consists of an input layer, one or more hidden layers, and an output layer. Each neuron in these layers computes a weighted sum of its inputs, then applies an activation function to produce its output. The basic operation within a neuron is given by the formula:
net $=\sum_{i=1}^n w_i x_i+b$ and $y=f($ net $)$ (1)
where,
$x_i$: input values
$w_i$: corresponding weights
$b$: bias
$f$: activation function
During training, a loss function like Mean Squared Error or Cross-Entropy is used to measure the difference between the predicted output and the target. The weights are then updated using gradient descent methods, where each weight is adjusted according to:
$w^{\text {new }}=w_i^{\text {old }}-\eta \frac{\partial \mathrm{E}}{\partial_{w_i}}$ (2)
with $\eta$ being the learning rate and $\frac{\partial \mathrm{E}}{\partial_{w_i}}$ representing the gradient of the loss with respect to the weight. In contrast, Random Forest is an ensemble learning method that builds multiple decision trees and combines their outputs to generate a final prediction. Each tree is trained on a bootstrap sample of the data, and at each split in the tree, only a random subset of features is considered. This randomness helps reduce overfitting and increases the model’s robustness. For classification, the final prediction is determined by a majority vote among the trees, expressed mathematically as:
$\hat{y}=\operatorname{mode}\left\{h_1(x), h_2(x), \ldots, h_N(x)\right\}$ (3)
where, $h_i(x)$ is the prediction from the i-th tree and N is the total number of trees in the forest.
2.5 Model validation
For model validation, the dataset was partitioned using an 70/20 train-test split. In addition, k-fold cross-validation (with k=5) was employed during model training to reduce variance and avoid overfitting. For RF, a grid search approach was used to systematically explore combinations of key parameters [37], such as n_estimators, max_depth, and min_sample_split. Meanwhile, the ANN model required tuning a different set of parameters: the number of hidden layers, number of neurons per layer, learning rate, and activation functions [38]. Randomized search combined with cross-validation was employed to efficiently identify suitable configurations.
To mitigate overfitting and improve generalization, regularization strategies were applied [39] to both the RF and ANN models. For RF, overfitting was addressed by limiting the number of trees, constraining the maximum tree depth, and reducing the number of features considered at each split [40]. These configurations help promote model diversity and reduce variance, particularly when working with a relatively small number of features. For ANN, a deliberately shallow architecture was employed to mitigate overfitting, using a minimal number of hidden layers and neurons to reduce the risk of overfitting [41]. Additionally, training was closely monitored to emulate early stopping behavior, limiting the chances of memorization without relying on explicit regularization techniques. Meanwhile, the metrics that will be used for validation include accuracy, precision, recall and F1, relevant to classification model validation, these metrics help in understanding different aspects of model performance [42]. Accuracy measures the proportion of correctly classified instances out of the total instances, precision measures the accuracy of positive predictions, recall shows how well the model identifies all positive instances, F1 is mean of precision and recall, providing a single metric that balances both [42]. The formula as follows:
Accuracy $=\frac{T P+T N}{T P+T N+F P+F N}$ (4)
Precision $=\frac{T P}{T P+F P}$ (5)
Recall $=\frac{T P}{T P+F N}$ (6)
F1 Score $=2 \times \frac{\text { Precision } \times \text { Recall }}{\text { Precision }+ \text { Recall }}$ (7)
where,
TP: True Positive
TN: True Negative
FP: False Positive
FN: False Negative
To show performance evaluation, k-fold cross-validation was used. This technique supports more reliable generalization estimates by averaging performance across multiple data partitions [43]. Although only one representative company is shown in the article for clarity, the complete dataset covering all 20 companies was used for all model training and evaluation processes.
2.6 Hybrid-featured CSF and KPI data model
Figure 2 illustrates the proposed model that incorporates a hybrid-featured approach. The data obtained from tailored CSF and KPI assessment which the form the determination of CERP implementation success status, where begin by the steering committee who will define the strategic directions and goals to be CSF and KPI indicators and define the stage performance of each company using Delphi method and Dempster-Shafer combination method. In this model, each CSF is linked to corresponding KPIs that act as performance metrics. Performance assessment stage then evaluates these metrics against the expected standards. If performance results are acceptable, it will continue to the next stage, and finished the at stage 5. If the results meet or exceed the defined thresholds, the process continues through Stages 2, 3, and 4, and eventually reaches Stage 5, where the overall ERP success is assessed. However, if the performance is deemed unsatisfactory, an improvement plan and remedial actions are initiated. This leads to a reassessment cycle, forming a continuous improvement loop. The structured data generated from this CSF-KPI framework forms the core dataset for training machine learning (ML) models. These data points, representing the quantified status of ERP performance, are used to train ML Models: ANN and RF.
Figure 2. New scheme of hybrid feature-based critical success factors in cloud enterprise resource planning through artificial neural networks and random forest
Next, machine learning classifiers used to predict future. The prediction model incorporates ANN and RF, both serving as tools to classify and validate the performance outcomes. The ANN model is particularly effective in identifying nonlinear patterns and extracting deep insights from complex data structures, while the RF model utilizes an ensemble of decision trees to generate reliable and interpretable predictions. Each model undergoes a separate preprocessing stage tailored to its specific algorithmic requirements, followed by model training and prediction. The final step is model validation, where the outputs of both ANN and RF models are evaluated using performance metrics such as accuracy, precision, and recall. The validated results offer a data-driven conclusion on the CERP implementation status.
3.1 Build the dataset
The researcher constructs the dataset by defining the parameters based on a thorough examination of CSFs in CERP implementation. The dataset is structured to include key features that influence CERP success, ensuring that the classification model can accurately evaluate implementation performance. The primary attributes in the dataset include Company, CSF (the specific success factor measured), CSF Weight, CSF Performance, and status. To facilitate classification, the dataset is labeled according to predefined performance categories. A CSF performance score greater than 4 is categorized as satisfactory (green), indicating a successful implementation stage. Scores between 3.0 and 3.9 fall into the below satisfactory (yellow) category, signaling potential risks or deficiencies. Meanwhile, scores below 3.0 are classified as failed (red), highlighting critical issues that may hinder CERP implementation success.
3.2 Weighting CSFs
The provided data categorizes KPI across different stages (stage 1-5) of CERP implementation project. Each KPI is assigned a weight, representing its relative importance in evaluating CSF during the CERP lifecycle. These weights help prioritize key aspects of the implementation process. Weighting begins with identifying CSFs and their corresponding KPIs, then normalization and consistency checks are performed to ensure fairness in evaluation [31] The weighted KPIs are then aggregated at the CSF level to form a composite performance score. Finally, the weighted KPIs serve as a benchmark for monitoring and continuous improvement.
Each stage of the CERP implementation focuses on different CSFs, stage 1 focuses on top management support, effective communication and employee competence. Each CSF contains the impactful KPI (identified by unique ID) which then weighted based on its importance, as shown in Table 4. The sum of KPI 11a-11c represent the weight of CSF 11, CSF 12 and CSF 13 respectively. Strong leadership (11) and funding (11b) are critical, with 11b having the highest weight. Communication (12) ensures transparency and collaboration. Employee readiness (13a-13d) is vital, focusing on training, adaptability, experience, and ongoing support.
Table 4. CSF and KPI performance measurement in stage 1
|
CERP CSFs |
ID |
KPIs |
Weight |
|
Top Management Support |
11a |
Senior leadership actively participates in CERP steering committees |
0.1550 |
|
11b |
Adequate funding is allocated for CERP implementation |
0.2250 |
|
|
11c |
Decision-making processes are streamlined for CERP-related initiatives |
0.1150 |
|
|
Effective Communication |
12a |
Regular CERP updates and progress reports are shared with employees |
0.0500 |
|
12b |
Cross-functional collaboration is encouraged through open communication |
0.0350 |
|
|
Employee Competence |
13a |
Key personnel have relevant CERP training and certifications |
0.1350 |
|
13b |
Employees demonstrate adaptability to new CERP workflows |
0.0950 |
|
|
13c |
The CERP project team has previous successful implementation experience |
0.1050 |
|
|
13d |
Employees receive ongoing support for CERP transition |
0.0850 |
KPI 14-16 highlights an indicator for each CSF in stage 2 (CERP Selection). Table 5 stated that KPI 14 holds the highest weight, emphasizing the importance of industry-specific expertise. Other factors, such as 14b and 14c, ensure that the CERP system meets security and customization requirements. In KPI 15 (balanced evaluation team), KPI 15b is the most critical, highlighting the need for strong top management oversight. Additionally, KPIs 15a, 15c, and 15d contribute to a well-structured evaluation process with diverse representation and external consulting support. The identification of organizational needs category, KPI 16 carries the highest overall weight, indicating that scalability is a key priority in CERP selection. Another significant factor is KPI 16b, which focuses on the CERP vendor's ability to adapt to business changes [25].
Table 5. CSF and KPI performance measurement in stage 2
|
CERP CSFs |
ID |
KPIs |
Weight |
|
CERP and Implementation Partner’s Capability |
14a |
Local industry references for CERP expertise |
0.1730 |
|
14b |
Comprehensive system security and authorization |
0.0870 |
|
|
14c |
High flexibility and customizability for business needs |
0.0540 |
|
|
Balanced Evaluation Team |
15a |
Evaluation team involves cross-functional representation |
0.1130 |
|
15b |
Top management provides clear authority and oversight |
0.1230 |
|
|
15c |
External CERP consultant supports evaluation process |
0.0460 |
|
|
15d |
Evaluation team ensures alignment with organizational goals |
0.0440 |
|
|
Identification of Organizational Needs |
16a |
CERP system addresses scalability requirements |
0.2050 |
|
16b |
CERP vendor ensures responsiveness to business changes |
0.1550 |
Stage 3 is the core activity that is CERP implementation which contains of three CSFs: implementation cost (17), change management (18) and sufficient training resources (19) (shown in Table 6). In implementation cost (17), 17a holds the highest weight, emphasizing CERP licensing costs, while 17b and 17c address maintenance, support, and infrastructure investments [17]. For change management, 18a is the most critical, highlighting organizational readiness, while 18b and 18c focus on leadership involvement and communication. Additionally, 17d and 17e cover customization and consultancy fees. In sufficient training resources, 19a is the most significant, stressing the need for training programs [28], while 19b and 19c ensure user manuals and hands-on workshops for CERP proficiency.
Table 6. CSF and KPI performance measurement in stage 3
|
CERP CSFs |
ID |
KPIs |
Weight |
|
Implementation Cost |
17a |
Total cost of CERP licenses, including initial purchase and renewal fees |
0.1390 |
|
17b |
Comprehensive maintenance and ongoing technical support costs for sustained operations |
0.1150 |
|
|
17c |
Hardware and infrastructure investment required to ensure compatibility with the CERP |
0.0810 |
|
|
17d |
Expenses related to customization and seamless integration with existing systems |
0.0680 |
|
|
17e |
Consultancy fees for CERP vendor expertise during the implementation phase |
0.0470 |
|
|
Change Management |
18a |
Readiness of the organization to adopt and integrate the CERP system across all functions |
0.1100 |
|
18b |
Active involvement of leadership to drive and oversee change management initiatives |
0.0750 |
|
|
18c |
Clear and effective communication strategy to guide employees through the transition |
0.0660 |
|
|
Sufficient Training Resources |
19a |
Availability of comprehensive training programs to equip end-users with CERP proficiency |
0.1510 |
|
19b |
Detailed user manuals and instructional guides for troubleshooting and CERP navigation |
0.0840 |
|
|
19c |
Conducting practical, hands-on workshops to ensure employees are confident using the CERP |
0.0640 |
The final preparation (stage 4), is categorized into CERP Support & Training (20), IT & Data Management (21), and Sufficient Training Resources (22). These categories are presented in Table 7. In CSF 20, 20a highlights ongoing technical support, while 20b and 20c focus on tailored training and accessible documentation. For CSF 21, the most critical KPI is 21a, ensuring IT infrastructure reliability, while 21b addresses effective data migration and integration. In sufficient training resources (22), the highest weight holds by 22c, emphasizing real-time reporting for decision-making [18], while 22a and 22b focus on KPI implementation and system evaluation.
Table 7. CSF and KPI performance measurement in stage 4
|
CERP CSFs |
ID |
KPIs |
Weight |
|
CERP Support & Training |
20a |
Provision of ongoing technical support to address user challenges |
0.1170 |
|
20b |
Tailored training programs for different user roles |
0.0920 |
|
|
20c |
Accessibility of user-friendly CERP documentation and troubleshooting guides |
0.0870 |
|
|
IT & Data Management |
21a |
Robust IT infrastructure to ensure CERP system reliability and uptime integrate the CERP system across all functions |
0.1530 |
|
21b |
Effective data migration and integration across all departments |
0.1130 |
|
|
Sufficient Training Resources |
22a |
Implementation of KPIs to measure CERP success |
0.1420 |
|
22b |
Continuous evaluation of system performance to identify bottlenecks and improvements |
0.1340 |
|
|
22c |
Real-time reporting and analytics for informed decision-making |
0.1620 |
Stage 5, shown in Table 8, focuses on three key areas: positive customer satisfaction (23), system operation efficiency (24), and employee productivity & satisfaction (25). KPIs like 23a-23c measure customer retention, feedback, and complaint reduction. 24a-24d ensure system speed, uptime, error reduction, and resource optimization. Finally, 25a-25c track employee task completion, engagement, and onboarding efficiency. The highest weight is given to system processing speed (24a), highlighting its critical role in CERP success [7].
Table 8. CSF and KPI performance measurement in stage 5
|
CERP CSFs |
ID |
KPIs |
Weight |
|
Positive Customer Satisfaction |
23a |
Increased customer retention rate through improved service quality |
0.1180 |
|
23b |
Enhanced customer feedback scores based on service delivery performance |
0.1020 |
|
|
23c |
Reduction in customer complaints post-CERP implementation |
0.0800 |
|
|
System Operation Efficiency |
24a |
Faster system processing times across key business functions |
0.1400 |
|
24b |
Higher system uptime and reliability during peak usage periods |
0.1300 |
|
|
24c |
Reduction in system errors and failures |
0.1100 |
|
|
24d |
Optimization of resource allocation for daily operations |
0.1200 |
|
|
Employee Productivity and satisfaction |
25a |
Increase in task completion rates per employee |
0.1000 |
|
25b |
Higher employee engagement scores post-implementation |
0.0600 |
|
|
25c |
Reduction in training time needed to onboard new employees |
0.0400 |
3.3 The calculation of PAW
PAW will be used in this research to measure the performance of each stage based on the calculation of several component included the KPI weight, user assessment, CSF performance to define the weighted KPI score which its sum is the final score for the performance of each stage. The PAW data showed is retrieved only from company 1, which is the sample data from 20 companies were tested.
In stage 1 (Organizational Readiness Assessment), the organization prepared for CERP implementation by ensuring strong management commitment [25] and employee competence [26]. CSF performances are different, for CSF 11, the overall performance is 4.3 (green); CSF 12 shows the performance 4.17 (green); while CSF 13 is 3.67 (yellow) which defined as below satisfactory. The overall stage performance, shown in Table 9, is 4.03 which reach satisfactory level.
Table 9. Performance assessment stage 1
|
CSFs |
Stage 1 KPI |
KPI Weight |
User Asmt. |
Weighted KPI Score |
CSF Weight |
CSF Perf. |
Status |
|
Top mgt. support |
11a |
0.1550 |
5 |
0.7750 |
0.4950 |
4.3131 |
Green |
|
11b |
0.2250 |
4 |
0.9000 |
|
|||
|
11c |
0.1150 |
4 |
0.4600 |
|
|||
|
Effective communication |
12a |
0.0500 |
5 |
0.2500 |
0.0850 |
4.1765 |
Green |
|
12b |
0.0350 |
3 |
0.1050 |
|
|||
|
Employee Competence |
13a |
0.1350 |
3 |
0.4050 |
0.4200 |
3.6786 |
Yellow |
|
13b |
0.0950 |
4 |
0.3800 |
|
|||
|
13c |
0.1050 |
4 |
0.4200 |
|
|||
|
13d |
0.0850 |
4 |
0.3400 |
|
|||
|
Sum of Weights |
1,000 |
- |
- |
1.000 |
- |
|
|
|
Stage performance |
4.0350 |
- |
- |
||||
Stage 2 (CERP Selection), which present in Table 10, focused on how the CERP system selected. CERP and implementation partner’s capability (14) shows the score of 4.33 indicated efficient financial planning. CSF 15 (balanced evaluation team) with score 4.06, demonstrated proactive measures team evaluation. Identification of organizational needs (CSF 16) counted score of 4.27 that ensured the suitable CERP system based on company’s necessity.
Table 10. Performance assessment stage 2
|
CSFs |
Stage 2 KPI |
KPI Weight |
User Asmt. |
Weighted KPI Score |
CSF Weight |
CSF Perf. |
Status |
|
CERP and Implementation Partner’s Capability |
14a |
0.1730 |
4 |
0.6920 |
0.3140 |
4.4490 |
Green |
|
14b |
0.0870 |
5 |
0.4350 |
|
|||
|
14c |
0.0540 |
5 |
0.2700 |
|
|||
|
Balanced Evaluation Team |
15a |
0.1130 |
4 |
0.4520 |
0.3260 |
4.6534 |
Green |
|
15b |
0.1230 |
5 |
0.6150 |
|
|||
|
15c |
0.0460 |
5 |
0.2300 |
|
|||
|
15d |
0.0440 |
5 |
0.2200 |
|
|||
|
Identification of Organization Needs |
16a |
0.2050 |
4 |
0.8200 |
0.3600 |
4.0000 |
Green |
|
16b |
0.1550 |
4 |
0.6200 |
|
|||
|
Sum of Weights |
1,0000 |
1.0000 |
|
||||
|
Stage performance |
4.3540 |
|
|||||
Stage 3 focuses on CERP implementation and deployment, ensuring financial control and employee readiness (Table 11). CSF 17 performance reach 4.43 point which means the implementation cost of company 1 was well-handled, indicating budget efficiency. CSF 18 which indicates the change management reach the score of 4.0 (satisfactory), demonstrating that employees adapted well to the new system. While CSF 19 that consider sufficient resources to be trained, counted 4.78 point, showing a strong commitment to preparing employees for the transition [17].
Table 11. Performance assessment stage 3
|
CSFs |
Stage 3 KPI |
KPI Weight |
User Asmt |
Weighted KPI Score |
CSF Weight |
CSF Perf. |
Status |
|
Implementation cost |
17a |
0.1390 |
4 |
0.5560 |
0.4500 |
4.4356 |
Green |
|
17b |
0.1150 |
4 |
0.4600 |
|
|||
|
17c |
0.0810 |
5 |
0.4050 |
|
|||
|
17d |
0.0680 |
5 |
0.3400 |
|
|||
|
17e |
0.0470 |
5 |
0.2350 |
|
|||
|
Change management |
18a |
0.1100 |
4 |
0.4400 |
0.2510 |
4.0000 |
Green |
|
18b |
0.0750 |
4 |
0.3000 |
|
|||
|
18c |
0.0660 |
4 |
0.2640 |
|
|||
|
Sufficient Training Resources |
19a |
0.1510 |
5 |
0.7550 |
0.2990 |
4.7860 |
Green |
|
19b |
0.0840 |
5 |
0.4200 |
|
|||
|
19c |
0.0640 |
4 |
0.2560 |
|
|||
|
Sum of Weights |
1,0000 |
1.0000 |
|
||||
|
Stage performance |
4.4310 |
|
|||||
Stage 4 (Final preparation) indicates post-implementation support that was well-established in company 1, ensuring smooth CERP operation. CERP Support & Training (CSF 20) (4.2639) showed that employees received necessary assistance. While CSF 21 with the best performance 4.15 was reach most satisfactory level compared to other CSF, reflecting a stable system infrastructure. Performance monitoring (CSF 22) score is 4.39 (shown in Table 12) reinforced continuous using and monitoring, ensuring that the implementation performance is on point [31].
Table 12. Performance assessment stage 4
|
CSFs |
Stage 4 KPI |
KPI Weight |
User Asmt. |
Weighted KPI Score |
CSF Weight |
CSF Perf. |
Status |
|
CERP support & training |
20a |
0.1170 |
4 |
0.4680 |
0.2960 |
3.9831 |
Yellow |
|
20b |
0.0920 |
3 |
0.2760 |
|
|||
|
20c |
0.0870 |
5 |
0.4350 |
|
|||
|
IT & Data management |
21a |
0.1530 |
5 |
0.7650 |
0.2660 |
4.1504 |
Green |
|
21b |
0.1130 |
3 |
0.3390 |
|
|||
|
Performance Monitoring |
22a |
0.1420 |
4 |
0.5680 |
0.4380 |
4.3699 |
Green |
|
22b |
0.1340 |
4 |
0.5360 |
|
|||
|
22c |
0.1620 |
5 |
0.8100 |
|
|||
|
Sum of Weights |
1,0000 |
1.0000 |
|
||||
|
Stage performance |
4.1970 |
|
|||||
Stage 5 represents live run implemented in company 1 successfully transitioned to full CERP operation, achieving satisfactory results. CSF 23 with score 4.16 indicated improved service quality. While system operation efficiency (CSF 24) counted for 4.20, as mentioned on Table 13, reflected enhanced performance and reduced errors. CSF 25 demonstrated that employees adapted well.
Table 13. Performance assessment stage 5
|
CSFs |
Stage 5 KPI |
KPI Weight |
User Asmt. |
Weighted KPI Score |
CSF Weight |
CSF Perf. |
Status |
|
Positive Customer Satisfaction |
23a |
0.1180 |
4 |
0.4720 |
0.3000 |
4.6067 |
Green |
|
23b |
0.1020 |
5 |
0.5100 |
|
|||
|
23c |
0.0800 |
5 |
0.4000 |
|
|||
|
System Operation Efficiency |
24a |
0.1400 |
4 |
0.5600 |
0.5000 |
3.7400 |
Yellow |
|
24b |
0.1300 |
3 |
0.3900 |
|
|||
|
24c |
0.1100 |
4 |
0.4400 |
|
|||
|
24d |
0.1200 |
4 |
0.4800 |
|
|||
|
Employee Productivity and satisfaction |
25a |
0.1000 |
5 |
0.5000 |
0.2000 |
4.2000 |
Green |
|
25b |
0.0600 |
3 |
0.1800 |
|
|||
|
25c |
0.0400 |
4 |
0.1600 |
|
|||
|
Sum of Weights |
1,0000 |
1.0000 |
|
||||
|
Stage performance |
4.0920 |
|
|||||
This PAW examination will form a dataset containing key features such as CSFs, CSF Weight, CSF Performance, and CSF Status (Table 14). These features will be utilized for classification and prediction of CERP success. Each CSF has a weight, representing its importance, and a performance score, reflecting its effectiveness.
Table 14. Sample dataset of company 1
|
Company |
CSFs |
CSF Weight |
CSF Performance |
Status |
|
Company 1 |
Top Mgt. Support |
0.495 |
4.313 |
Green |
|
Company 1 |
Effective Communication |
0.850 |
4.177 |
Green |
|
Company 1 |
Employee Competence |
0.420 |
3.679 |
Yellow |
|
Company 1 |
CERP and Implementation Partner’s Capability |
0.314 |
4.449 |
Green |
|
Company 1 |
Balanced Evaluation Team |
0.326 |
4.653 |
Green |
|
Company 1 |
Identification of Organizational Needs |
0.360 |
4.000 |
Green |
|
Company 1 |
Implementation Cost |
0.450 |
4.436 |
Green |
|
Company 1 |
Change Management |
0.251 |
4.000 |
Green |
|
Company 1 |
Sufficient Training Resources |
0.299 |
4.786 |
Green |
|
Company 1 |
CERP Support & Training |
0.296 |
3.983 |
Yellow |
|
Company 1 |
IT & Data Management |
0.266 |
4.150 |
Green |
|
Company 1 |
Performance Monitoring |
0.438 |
4.369 |
Green |
|
Company 1 |
Positive Customer Satisfaction |
0.300 |
4.607 |
Green |
|
Company 1 |
System Operation Efficiency |
0.500 |
3.740 |
Yellow |
|
Company 1 |
Employee Productivity and Satisfaction |
0.200 |
4.200 |
Green |
Feature “status” is the target variable, where a "Green" status indicates satisfactory performance (≥4.000), "Yellow" signifies below satisfactory performance (3.0-3.9), while “Red” (<3.0) is considered as failed. This study extends beyond Company 1, involving 20 companies, but considering the compact paper, only Company 1's data is shown here in Table 14. This kind data will be processed to handle outliers and missing values [44] for having a good performance and accuracy. Right after that, the data will be process on ANN and RF to find the most suitable algorithms for the data’s classification.
3.4 Processing the data with ANN and RF models
Preprocessing steps are performed to clean and standardize the data. This includes handling missing values, normalizing numerical variables, and encoding categorical data. The target variable will be the status which represents CSF performance. However, the distribution of this target variable is imbalanced, with the "Red" (failure) category significantly underrepresented compared to "Green" (satisfactory) and "Yellow" (below satisfactory). This imbalance poses a serious challenge for machine learning models, as it can lead to biased predictions that ignore rare but critical failure cases. To address this issue, the Synthetic Minority Over-sampling Technique (SMOTE) is applied [35] during pre-processing. Thus, both ANN and RF models are exposed to a more balanced dataset, enhancing classification accuracy and robustness, particularly in identifying implementation failures. Following these preparations, the dataset is ready for training using ANN and RF approach, allowing for the identification of key CSFs that influence CERP success and providing insights into areas requiring improvement [45].
3.5 Evaluation results
The evaluation results comparing the ANN and random forest models demonstrate a significant performance gap across multiple classification metrics.
Table 15 presents the model evaluation score. RF outperforms ANN across all evaluation metrics, demonstrating its superior predictive capability in the given context. Specifically, the RF model achieved an accuracy of 0.849, F1-score of 0.845, precision of 0.857, and recall of 0.849. These values indicate that the RF model maintains a balanced trade-off between precision and recall while achieving high overall correctness in predictions. Conversely, the ANN model yielded an accuracy of 0.765, F1-score of 0.762, precision of 0.766, and recall of 0.765, reflecting a consistently lower performance. The reduced scores suggest that ANN model is less effective in learning and generalizing the underlying patterns of the dataset.
Table 15. Model evaluation score
|
Model |
Accuracy |
F1 |
Precision |
Recall |
|
Random Forest (RF) |
0.849 |
0.845 |
0.857 |
0.849 |
|
Artificial Neural Network (ANN) |
0.765 |
0.762 |
0.766 |
0.765 |
Table 16. Confusion matrix of ANN
|
Predicted |
|||||
|
|
Green |
Red |
Yellow |
S |
|
|
Actual |
Green |
85.4 |
15.5 |
25.1 |
126 |
|
Red |
7.5 |
93.6 |
23.9 |
125 |
|
|
Yellow |
25.1 |
33.3 |
61.6 |
120 |
|
|
S |
118 |
142 |
111 |
371 |
|
Table 16 illustrates the distribution of classification results of ANN across three classes. The diagonal elements (85.4, 93.6, and 61.6) represent the correctly classified instances for classes: ‘green’, ‘red’, and ‘yellow’ respectively, while the off-diagonal elements denote misclassifications. Notably, the model shows relatively strong performance in classifying class ‘red’ instances, with 93.6 correctly predicted out of 125, corresponding to a high true positive rate. However, the model demonstrates a notable degree of confusion between classes ‘green’ and ‘yellow’. For example, 25.1 instances of ‘yellow’ were misclassified as green, and 25.1 instances of ‘green’ were misclassified as ‘yellow’. Similarly, a considerable number of class 2 instances (33.3) were predicted as class 1, indicating overlap in feature representation between these categories. The total number of instances across all classes is 371, and the class distribution appears relatively balanced (126, 125, and 120 for green, red, and yellow respectively).
The confusion matrix of the RF model (Table 17) demonstrates the classifier’s ability to distinguish among the classes. Correct classifications are observed along the diagonal, with 54.0 instances correctly identified as ‘green’, 56.5 as ‘red’, and 44.6 as ‘yellow’. The model shows relatively strong performance in identifying ‘red’, achieving the highest number of true positives among the three categories. However, notable misclassifications occur, particularly between ‘green’ and ‘yellow’, as indicated by 38.4 ‘green’ instances misclassified as ‘yellow’ and 38.9 ‘yellow’ instances predicted as ‘green’. Additionally, ‘red’, despite having the highest true positives, still exhibits confusion with both ‘green’ and ‘yellow’ categories, as seen in 32.5 and 36.0 misclassifications, respectively.
Table 17. Confusion matrix of random forest
|
Predicted |
|||||
|
|
Green |
Red |
Yellow |
S |
|
|
Actual |
Green |
54.0 |
33.6 |
38.4 |
126 |
|
Red |
32.5 |
56.5 |
36.0 |
125 |
|
|
Yellow |
38.9 |
36.5 |
44.6 |
120 |
|
|
S |
125 |
127 |
119 |
210 |
|
The dataset used in this analysis was balanced using the SMOTE, ensuring an approximately equal distribution across all classes. Overall, while the RF exhibits some degree of misclassification, it maintains a stronger discriminative capacity ANN, these results reinforce the previous evaluation metrics and support the selection of the RF model as the more reliable classifier in this context. The ROC curve and performance curve provided to gain visual insight [46].
ROC curve compares model performance across three different class labels. The x-axis represents the False Positive Rate (1 - Specificity), while the y-axis shows the True Positive Rate (Sensitivity). The ROC curve illustrates the diagnostic ability of the classification models at various threshold settings, and the closer the curve follows the top-left corner of the plot, the better the model’s discriminatory capability.
The orange and green lines likely represent the ROC curves of two models under comparison, RF and ANN, respectively. In all three subplots present on Figure 3, the ROC curves for the Random Forest model (orange) consistently outperform those of the ANN (green), as indicated by the higher trajectory toward the top-left corner. This suggests that the Random Forest model achieves a better trade-off between sensitivity and specificity for all classes. The annotated points on the curves denote threshold values with corresponding sensitivity-specificity balances.
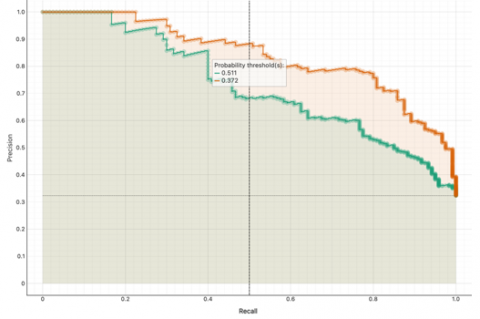
Figure 4 displays the Precision-Recall (PR) curves for two models: RF (orange) and ANN (green), evaluated across three datasets. It reveals that the RF model outperforms the ANN, even when operating at a lower probability threshold. Despite these lower thresholds, RF maintains higher precision and recall, indicating its ability to confidently identify positive cases without a significant increase in false positives. In the first plot, the Random Forest achieved a threshold of 0.438 while ANN had 0.761; both models maintained high precision across most recall values, but RF consistently outperformed ANN in balancing recall and precision, indicating fewer false positives at higher confidence levels. In the second plot, the thresholds were 0.451 (RF) and 0.808 (ANN), again showing that RF retained higher precision as recall increased. In the third comparison, thresholds were 0.372 (RF) and 0.511 (ANN), with Random Forest again demonstrating more stable performance.
Figure 3. ROC curve diagram
(a) (b)
(c)
Figure 4. Precision-Recall (PR) curve
The successful implementation of CERP systems is critical for organizations aiming to enhance operational efficiency, reduce costs, and support digital transformation. However, high failure rates in ASEAN pose a significant challenge, underscoring the need for data-driven approaches to mitigate risks and improve adoption success. This study provides solutions to the problem by assessing CSFs as key determinants of CERP implementation success. The research follows a structured, multi-stage approach by identifying CSFs based on KPIs using the Delphi method and the Dempster-Shafer combination method in the first. Subsequently, a weighting process is conducted through user feedback scores at each stage to categorize success levels: satisfactory (>4), below satisfactory (3.0-3.9), and failure (<3.0), marked with green, yellow, and red labels, respectively. Classification analysis is conducted using ANN and RF models, determining success labels. The study finds that RF significantly outperforms ANN, with accuracy (0.849; 0.765), F1-score (0.845; 0.762), precision (0.857; 0.766), and recall (0.849; 0.765). Additionally, confusion matrix, ROC, and AUC results further demonstrate RF’s superior predictive capability. Through this research, the identification of CSFs through qualitative analysis or statistical modeling, combined with the integration of machine learning techniques, enhances decision-making by providing data-driven insights and actionable recommendations, ultimately improving assessment classification for CERP implementation.
This study introduces a methodological integration of CSF determination and success classification using an ANN and RF approach, offering a more precise evaluation of CERP implementation success at various stages. This enables a more precise evaluation of CERP implementation success at various stages, offering insights beyond conventional assessment methods. From an academic perspective, this study enhances the understanding of CERP success prediction by validating RF as a more accurate model compared to ANN. In practical applications, organizations can utilize RF-based CSF assessments to predict CERP implementation success by analyzing past patterns (historical data), thereby improving decision-making and minimizing failure rates in future implementations. However, this study is limited by the dataset, which was restricted to a specific regional and sectoral context. Additionally, the dataset exhibited class imbalance, which may have influenced the performance of the predictive models and potentially biased the results. This may affect the generalizability of the findings across other industries or geographic regions. Future research should involve larger and more diverse datasets, explore more varied industries and regions to further enhance prediction robustness and support broader CERP adoption strategies.
[1] Songsheng, C., Peipei, Y. (2010). Economic benefits of enterprise resources planning (ERP)-based on empirical evidence from Chinese listed companies. In 2010 International Conference on Logistics Systems and Intelligent Management (ICLSIM), pp. 1305-1308. https://doi.org/10.1109/ICLSIM.2010.5461175
[2] Molina-Castillo, F.J., Rodríguez, R., López-Nicolas, C., Bouwman, H. (2022). The role of ERP in business model innovation: Impetus or impediment. Digital Business, 2(2): 100024.
[3] Autenrieth, P., Lörcher, C., Pfeiffer, C., Winkens, T., Martin, L. (2018). Current significance of IT-infrastructure enabling industry 4.0 in large companies. In 2018 IEEE International Conference on Engineering, Technology and Innovation (ICE/ITMC), pp. 1-8. https://doi.org/10.1109/ICE.2018.8436244
[4] ESCAP, U. (2024). Asia and the Pacific SDG progress report 2024: Showcasing transformative actions.
[5] Malaurent, J., Avison, D. (2015). From an apparent failure to a success story: ERP in China—Post implementation. International Journal of Information Management, 35(5): 643-646.
[6] Prasetyo, S.J., Lubis, M., Witjaksono, R.W., Azizah, A.H. (2019). Critical failure factors in enterprise resource planning (ERP) implementation: Case study of PT. Toyota astra motor Indonesia. In 2019 Fourth International Conference on Informatics and Computing (ICIC), Semarang, Indonesia, pp. 1-5. https://doi.org/10.1109/ICIC47613.2019.8985720
[7] Mahmood, F., Khan, A.Z., Bokhari, R.H. (2020). ERP issues and challenges: A research synthesis. Kybernetes, 49(3): 629-659. https://doi.org/10.1108/K-12-2018-0699
[8] Coşkun, E., Gezici, B., Aydos, M., Tarhan, A.K., Garousi, V. (2022). ERP failure: A systematic mapping of the literature. Data & Knowledge Engineering, 142: 102090.
[9] Malik, M.O., Khan, N. (2021). Analysis of ERP implementation to develop a strategy for its success in developing countries. Production Planning & Control, 32(12): 1020-1035. https://doi.org/10.1080/09537287.2020.1784481
[10] Kiran, T.S., Reddy, A.V.D. (2019). Evaluating critical success factors of ERP implementation in SMEs. Journal of Project Management, 4: 267-280. https://doi.org/10.35940/ijrte.B1716.078219
[11] Reitsma, E., Hilletofth, P. (2018). Critical success factors for ERP system implementation: A user perspective. European business review, 30(3): 285-310. https://doi.org/10.1108/EBR-04-2017-0075
[12] Saade, R.G., Nijher, H. (2016). Critical success factors in enterprise resource planning implementation: A review of case studies. Journal of Enterprise Information Management, 29(1): 72-96. https://doi.org/10.1108/JEIM-03-2014-0028
[13] Leyh, C. (2016). Critical success factors for ERP projects in small and medium-sized enterprises—the perspective of selected ERP system vendors. In Multidimensional Views on Enterprise Information Systems: Proceedings of ERP Future 2014, pp. 7-22. https://doi.org/10.1007/978-3-319-27043-2_2
[14] Gavali, A., Halder, S. (2020). Identifying critical success factors of ERP in the construction industry. Asian Journal of Civil Engineering, 21(2): 311-329. https://doi.org/10.1007/s42107-019-00192-4
[15] Menon, S. (2019). Benefits and process improvements for ERP implementation: Results from an exploratory case study. International Business Research, 12(8): 124-132. https://doi.org/10.5539/ibr.v12n8p124
[16] Chatzoglou, P., Chatzoudes, D., Amarantou, V., Aggelidis, V. (2017). Examining the antecedents and the effects of CSR implementation: An explanatory study. EuroMed Journal of Business, 12(2): 189-206. https://doi.org/10.1108/EMJB-12-2016-0035
[17] Barth, C., Koch, S. (2019). Critical success factors in ERP upgrade projects. Industrial Management & Data Systems, 119(3): 656-675. https://doi.org/10.1108/IMDS-01-2018-0016
[18] Vinuesa, R., Azizpour, H., Leite, I., Balaam, M., Dignum, V., Domisch, S., Fuso Nerini, F. (2020). The role of artificial intelligence in achieving the Sustainable Development Goals. Nature communications, 11(1): 233. https://doi.org/10.1038/s41467-019-14108-y
[19] Brynjolfsson, E., McAfee, A. (2014). The second machine age: Work, progress, and prosperity in a time of brilliant technologies. WW Norton & Company.
[20] Salas, W.H. (2023). Model to improve an ERP implementation based on agile best practice: A Delphi study. Procedia Computer Science, 219: 1785-1792.
[21] Okoli, C., Pawlowski, S.D. (2004). The Delphi method as a research tool: An example, design considerations and applications. Information & Management, 42(1): 15-29. http://doi.org/10.1016/j.im.2003.11.002
[22] Patil, R.V, Bhoyar, S., Salunke, A., Bhingardive, S., Atkar, G. (2020). Survey on fraud detection in banking using novel strategy. Journal of Emerging Technologies and Innovative Research, 7(4): 363-367.
[23] Sun, H., Ni, W., Lam, R. (2015). A step-by-step performance assessment and improvement method for ERP implementation: Action case studies in Chinese companies. Computers in Industry, 68: 40-52.
[24] Chevalier, J.M. (2019). Participatory Action Research: Theory and Methods for Engaged Inquiry. Routledge. https://doi.org/10.4324/9781351033268
[25] Huang, Q., Rahim, M., Foster, S., Anwar, M. (2021). Critical success factors affecting implementation of cloud ERP systems: A systematic literature review with future research possibilities. http://hdl.handle.net/10125/71186.
[26] Moeuf, A., Lamouri, S., Pellerin, R., Tamayo-Giraldo, S., Tobon-Valencia, E., Eburdy, R. (2020). Identification of critical success factors, risks and opportunities of Industry 4.0 in SMEs. International Journal of Production Research, 58(5): 1384-1400. https://doi.org/10.1080/00207543.2019.1636323
[27] Barbieri, L.M., Sott, M.K., Monticelli, J.M. (2024). Critical success factors for implementing cloud ERP in SMEs: A systematic review. International Journal of Innovation and Technology Management, 21(2): 2430003. https://doi.org/10.1142/S0219877024300039
[28] Fattah-Weil, J. (2024). Paving the Way for ERP Implementation in Higher Education Institutions-A Review of Critical Success Factors.
[29] Lindström, F., Robertsson, H. (2020). Cloud ERP and Its Critical Success Factors in Small Swedish Firms.
[30] DeLone, W.H., McLean, E.R. (2003). The DeLone and McLean model of information systems success: A ten-year update. Journal of Management Information Systems, 19(4): 9-30. https://doi.org/10.1080/07421222.2003.11045748
[31] Chatzoglou, P., Fragidis, L., Chatzoudes, D., Symeonidis, S. (2016). Critical success factors for ERP implementation in SMEs. In 2016 Federated Conference on Computer Science and Information Systems (FedCSIS), pp. 1243-1252.
[32] Altamony, H., Al-Salti, Z., Gharaibeh, A., Elyas, T. (2016). The relationship between change management strategy and successful enterprise resource planning (ERP) implementations: A theoretical perspective. International Journal of Business Management and Economic Research, 7(4): 690-703.
[33] Kang, M., Tian, J. (2018). Machine learning: Data pre‐processing. In Prognostics and Health Management of Electronics: Fundamentals, Machine Learning, and the Internet of Things, pp. 111-130. https://doi.org/10.1002/9781119515326.ch5
[34] Leevy, J.L., Khoshgoftaar, T.M., Bauder, R.A., Seliya, N. (2018). A survey on addressing high-class imbalance in big data. Journal of Big Data, 5(1): 1-30. https://doi.org/10.1186/s40537-018-0151-6
[35] Hairani, H., Anggrawan, A., Priyanto, D. (2023). Improvement performance of the random forest method on unbalanced diabetes data classification using Smote-Tomek Link. International Journal on Informatics Visualization, 7(1): 258-264. https://dx.doi.org/10.30630/joiv.7.1.1069
[36] Chawla, N.V., Bowyer, K.W., Hall, L.O., Kegelmeyer, W.P. (2002). SMOTE: Synthetic minority over-sampling technique. Journal of Artificial Intelligence Research, 16: 321-357. https://doi.org/10.1613/jair.953
[37] Rimal, Y., Sharma, N., Alsadoon, A. (2024). The accuracy of machine learning models relies on hyperparameter tuning: Student result classification using random forest, randomized search, grid search, Bayesian, genetic, and optuna algorithms. Multimedia Tools and Applications, 83(30): 74349-74364. https://doi.org/10.1007/s11042-024-18426-2
[38] Abiodun, O.I., Jantan, A., Omolara, A.E., Dada, K.V., Umar, A.M., Linus, O.U., Kiru, M.U. (2019). Comprehensive review of artificial neural network applications to pattern recognition. IEEE Access, 7: 158820-158846. https://doi.org/10.1109/ACCESS.2019.2945545
[39] Salam, M.A., Azar, A.T., Elgendy, M.S., Fouad, K.M. (2021). The effect of different dimensionality reduction techniques on machine learning overfitting problem. International Journal of Advanced Computer Science and Applications, 12(4): 641-655. https://doi.org/10.14569/IJACSA.2021.0120480
[40] Halabaku, E., Bytyçi, E. (2024). Overfitting in machine learning: A comparative analysis of decision trees and random forests. Intelligent Automation & Soft Computing, 39(6): 987-1006. https://doi.org/10.32604/iasc.2024.059429
[41] Bejani, M.M., Ghatee, M. (2021). A systematic review on overfitting control in shallow and deep neural networks. Artificial Intelligence Review, 54(8): 6391-6438. https://doi.org/10.1007/s10462-021-09975-1
[42] Vujović, Ž. (2021). Classification model evaluation metrics. International Journal of Advanced Computer Science and Applications, 12(6): 599-606. https://doi.org/10.14569/IJACSA.2021.0120670
[43] Gorriz, J.M., Segovia, F., Ramirez, J., Ortiz, A., uckling, J. (2024). Is K-fold cross validation the best model selection method for Machine Learning? arXiv Preprint, arXiv:2401.16407. https://doi.org/10.48550/arXiv.2401.16407
[44] Shao, F., Shen, Z. (2023). How can artificial neural networks approximate the brain? Frontiers in Psychology, 13: 970214. https://doi.org/10.3389/fpsyg.2022.970214
[45] Knauer, U., von Rekowski, C.S., Stecklina, M., Krokotsch, T., Pham Minh, T., Hauffe, V., Seiffert, U. (2019). Tree species classification based on hybrid ensembles of a convolutional neural network (CNN) and random forest classifiers. Remote Sensing, 11(23): 2788. https://doi.org/10.3390/rs11232788
[46] Genuer, R., Poggi, J.M., Genuer, R., Poggi, J.M. (2020). Introduction to random forests with R. In Random Forests with R, pp. 1-8. https://doi.org/10.1007/978-3-030-56485-8_1