Inas Ismael Imran![]()
© 2025 The author. This article is published by IIETA and is licensed under the CC BY 4.0 license (http://creativecommons.org/licenses/by/4.0/).
OPEN ACCESS
In the contemporary digital age, ensuring the security of smart grid networks is of utmost importance. Traditional intrusion detection mechanisms often falter in adaptability and precision, demanding innovative solutions. This research introduces a novel fusion of supervised and unsupervised learning techniques to elevate intrusion detection efficiency. The researcher performed extensive exploratory data analysis (EDA) and preprocessing to remove missing information, duplication, and label alterations from a simulated military network landscape. Our study compared RF+DBSCAN and RF+K-means hybrid methods. After partitioning the dataset 70-30, the models were clustered and evaluated using accuracy, precision, recall, F1-score, sensitivity, specificity, and ROC curve to prove their superiority. The RF+DBSCAN model performed well, obtaining 99.70% accuracy in preliminary testing. Integration of clustering methods with classic classifiers like Random Forest (RF) shows great promise for improved intrusion detection procedures. The findings suggest cybersecurity stakeholders should use hybrid strategies to defend complex digital systems.
hybrid intrusion detection, RF+K-means, RF+DBSCAN, network security, supervised-unsupervised fusion
Network security has become crucial due to internet and communication technology improvements in the previous decade [1]. To protect the network and its assets online, firewalls, antivirus software, and Intrusion Detection System (IDS) are used. Network Intrusion Detection Systems (NIDSs) analyze network traffic for malicious or suspicious activity [2]. Hussein [3] introduced IDS, and since then, many network security IDS products have been developed. But recent technical advances have increased network size and the amount of applications employed by network nodes [3, 4]. Thus, these nodes generate and exchange a lot of valuable data.
Due to new attack methods, including versions of old and novel attacks, protecting this data and network nodes is difficult [4]. Nearly every node in a network is susceptible to security threats [5]. For instance, the security of data nodes is critical for organizations. Compromising the information within these nodes can severely impact an organization’s reputation and finances. Existing IDSs have struggled to identify various types of attacks, including zero-day attacks effectively, and also struggle with false alarms [6]. This has led to a demand for an improved NIDS that is efficient, accurate, and cost-effective, and can provide robust network security.
To create an effective IDS, researchers have used machine learning (ML) [7-9]. ML in AI extracts insights from huge datasets [10]. GPUs have helped these network security methods gain popularity in the past decade. Learning significant network traffic patterns using ML helps forecast normal and abnormal actions [11]. ML-based IDS uses feature engineering to analyze network traffic.
In Network Intrusion Detection Systems (NIDSs), supervised and unsupervised methods are used. The system is trained with normal or malicious network instances using labelled data in supervised techniques. The system recognizes similar cases after distinguishing these classes. However, unsupervised methods discover deviations in network traffic patterns. These techniques can detect intrusion-related behavior. Improve network security by combining supervised and unsupervised threat detection and response.
1.1 Problem statement
Network infrastructures need NIDS to prevent more complex and frequent intrusions [12]. Due to shifting data flows, traditional NIDS have high false-positive rates and difficulty identifying emerging attack vectors [13-15]. Supervised and unsupervised machine learning have been researched separately, but not together. This paper develops and tests a hybrid NIDS framework that combines supervised and unsupervised learning to increase accuracy, false positives, and intrusion detection in dynamic network environments.
1.2 Contributions
We revolutionize NIDS in this paper. Our hybrid architecture combining supervised and unsupervised machine learning is innovative. This blend combines supervised learning's precision, labeled dataset’s ability to identify and categorize known intrusion behaviors, and unsupervised learning's ability to exploit traffic abnormalities. Early discovery of these anomalies, which typically indicate new attack avenues, is critical for security.
Additionally, our system incorporates a dynamic algorithm tailored to autonomously modify its detection methodology in alignment with the characteristics of the incoming data stream. This ensures peak efficiency, even in continuously transforming network scenarios. Our comprehensive assessments, conducted using a variety of datasets, pit our pioneering model against conventional supervised and unsupervised methods. The outcomes, both in quantitative and qualitative terms, underscore the heightened detection capabilities, diminished false alarms, and increased accuracy rates achieved by our blended approach.
In conclusion, our research carves a pathway for academics and industry professionals aiming to craft a robust, flexible, and efficacious NIDS. Our solution addresses the pressing demands of today’s digital landscape, which is continually threatened by sophisticated cyber adversaries, by harnessing the power of anomaly exploitation for enhanced security.
1.3 Paper structure
The paper commences with an Abstract, providing a succinct overview of the study’s objectives, methodology, and primary findings. Following the abstract, the Introduction sets the stage, highlighting the topic's significance, outlining the primary research question, and providing context. Delving deeper, the Related Work section critically examines existing research pertinent to the study, identifying gaps and delineating the current study’s significance within the broader academic landscape. Subsequent to this, the Methodology section elucidates the research design, elaborating on data collection, preprocessing, and the analytical techniques employed. Once the foundational processes are established, the Results section presents the empirical findings derived from the analysis, often complemented by tables, charts, and other illustrative tools. To interpret these findings. The study then culminates in the Conclusion, summarizing the key and implications. Finally, Future Work offers directions for subsequent research endeavors, and the References section lists all the scholarly works cited throughout the paper, ensuring academic rigor and integrity.
Numerous contemporary investigations have employed AI methods, particularly supervised ML, to enhance the security of smart grids. Below, we delve into these studies to explore their specifics as shown in Table 1.
Table 1. Summary of related work on intrusion detection
|
Reference |
Models/Methods Evaluated |
Most Effective Model |
Additional Remarks |
|
[16] |
Bagging, Boosting, Stacking |
Stacking |
Cyber-attacks in smart grids |
|
[17] |
K-Nearest Neighbor (K-NN), Support Vector Machine (SVM), Adaboost, Naive Bayes, Cat-Boost, Gradient Boosting |
Boosting Ensembles |
Intrusions in smart grid |
|
[18] |
Naive Bayes, SVM, Decision Tree (DT), Random Forest (RF) |
RF |
- |
|
[19] |
DT, Simple Logistic Regression, Naïve Bayes, Multi-Layer Perceptron (MLP), SVM, RF, Zero Rule |
DT |
- |
|
[20] |
Neural Networks (NNs), Decision Trees (DTs) |
CART |
Network Intrusions (NI) |
|
[21] |
Extreme Boosting + Long Short-Term Memory (EB + LSTM), Classification and Regression Tree (CART), Iterative Dichotomiser 3 (ID3), RF, K-NN, Cervical Segment 4/5 |
EB + LSTM |
- |
|
[23] |
RF, Naive Bayes, SVM, EB |
RF, EB |
- |
|
[24] |
SVM, DT, Artificial Neural Network (ANN), K-NN, Naive Bayes, RF |
RF |
Cyber-Attack Detection (CAD) |
|
[25] |
Stacked Autoencoder, SVM, K-NN |
Not specified |
False data injection attacks |
|
[26] |
K-Means |
- |
Data transmission between smart homes and power centers |
|
[30] |
Isolation Forest |
- |
Unsupervised attack detection |
|
[31] |
Generative Adversarial Network |
- |
Anomaly-based detection |
|
[32] |
Restricted Boltzmann Machine |
- |
Cyber-attacks in extensive smart grids |
|
[33] |
Hierarchical Temporal Memory, Random Cut Forest, Bayesian Change, Relative Entropy |
Hierarchical Temporal Memory |
Real-time anomaly detection |
|
[34] |
Autoencoder + RF |
- |
CAD in smart grids |
2.1 Supervised learning
Khoei et al. [16] conducted a comparative analysis of three supervised methodologies: Bagging, Boosting, and Stacking models, for discerning cyber-attacks within smart grids. The outcomes exhibited the superior performance of the Stacking classifier in contrast to the alternative approaches. The study conducted by Khoei et al. [17], a variety of supervised Boosting ensembles and conventional models, encompassing K-NN, SVM, Adaptive Boosting, Naïve Bayes, Categorial Boosting, and Gradient Boosting, were employed to identify intrusions within the smart grid. The Boosting ensemble classifiers demonstrated enhanced efficacy in comparison to the conventional classifiers.
As demonstrated by El Mrabet et al. [18], a juxtaposition was performed on the efficacy of four established supervised ML models for intrusion detection in smart grids: Naïve Bayes, SVM, DT, and RF. The findings indicated the RF classifier as the most effective technique. The investigation detailed in references [19, 20] encompassed a comparison of the effectiveness of DT, Simple Logistic Regression, Naïve Bayes, Multi-layer perceptron, SVM, RF, and Zero Rule. The outcomes established the DT classifier as the most proficient in intrusion detection.
Lastly, Thapa et al. [21] entailed a contrast between Neural Networks (NN) and diverse forms of DTs for identifying SVM. Among the models evaluated, the Classification and Regression Tree classifier exhibited the most promising results in detecting SVM.
Song et al. [22] devised a hybrid supervised model by combining Extreme Boosting and Long Short-Term Memory to identify intrusions within a smart grid. The model’s performance was benchmarked against other ML models, including CART, ID 3, RF, K-NN, and Cervical Segment 4/5. Their findings showcased that the hybrid model outperformed the other examined models in terms of effectiveness.
In a separate investigation documented by Roy et al. [23], diverse supervised models, such as RF, Naïve Bayes, SVM, and EB, were scrutinized for their proficiency in detecting intrusions within the smart grid. The authors highlighted that both the RF and EB models exhibited superior performance compared to other models.
Arora et al. [24] conducted a comparison of several supervised models for CAD. Models examined encompassed SVM, DT, ANNs, K-NN, Naive Bayes, and RF. The outcomes revealed that the RF model demonstrated notably improved results across metrics like accuracy, false alarm rate, UN-detection rate, true positive rate, and receiver operating characteristic diagram compared to the alternative models.
Numerous other inquiries delved into applying supervised deep learning (DL) techniques for intrusion detection within smart grids. For instance, Yao et al. [25] introduced a convolutional NN and a long -term memory-based detection approach. In the study of Yang et al. [26], an enhanced supervised convolutional NN was proposed to discern network abnormalities. Wang et al. [27] presented a hybrid model employing Kalman Filter and Recurrent NN, structured into two levels to predict and fit linear and nonlinear data, culminating in a fully connected module that amalgamated the results for attack detection.
2.2 Unsupervised learning
Limited research has been conducted to assess the effectiveness of unsupervised models in identifying cyberattacks.
For instance, Majidi et al. [28] utilized a stacked autoencoder to identify false data injection attacks. The performance of this technique was assessed and juxtaposed with that of SVM and KNN models. Ahmed et al. [29] presented that the K-means model was employed to cluster data and construct an outlier detection model for data transmission between smart homes and power centers.
Unsupervised techniques also found application in intrusion detection within smart grids. According to the research by Menon and Radhika [30], the Isolation Forest model formed the basis for an unsupervised approach to attack detection. Features were extracted through principal component analysis and isolation forest, applied to non-labeled data for training, testing, and validation. Anomaly-based intrusion detection was introduced by Radoglou et al. [31], employing a Generative Adversarial Network. This model incorporated three detection layers, focusing on network flows, Modbus/transmission control protocol packets, and operational data to uncover attacks.
Moreover, Karimipour et al. [32] employed an unsupervised DL approach with the Restricted Boltzmann Machine to identify cyber- attacks in extensive smart grids. The model utilized feature extraction and symbolic dynamic filtering to mitigate computational demands while considering casual subsystem interactions. Results indicated commendable accuracy, true positive rates, and low false positive rates.
In the realm of real-time anomaly detection, Barua et al. [33] introduced Hierarchical Temporal Memory and contrasted its efficacy against Random Cut Forest, Bayesian Change, and Relative Entropy. Their model emerged superior in terms of real-time anomaly detection accuracy and scoreboard evaluation. Lastly, As reported by Hu [34], an unsupervised framework leveraging Autoencoder and RF was proposed for CAD in smart grids. This model successfully classified benign operations, malicious vulnerabilities and natural events.
As mentioned in the previous work, a numerous studies have focused on either supervised or unsupervised machine learning techniques for intrusion detection within smart grids. Supervised techniques, ranging from DTs, NNs, to Boosting methods, have been extensively studied and found to have varying degrees of success in different scenarios. On the other hand, unsupervised techniques such as Stacked Autoencoders, K-means, and Generative Adversarial Networks have also been explored, though to a lesser extent.
However, a noticeable gap exists in exploring hybrid models that synergistically combine the strengths of both supervised and unsupervised approaches. Integrating supervised techniques, which typically require labeled data and can be trained to recognize known intrusion patterns, with unsupervised techniques adept at identifying novel, previously unseen attack patterns by uncovering anomalies in the data, could yield superior detection capabilities. This combined approach might enhance the robustness and adaptability of IDS, allowing them to respond more effectively to evolving cyber threats in smart grids.
In light of this, our work seeks to bridge this knowledge gap by proposing and evaluating a model that harmoniously amalgamates both supervised and unsupervised techniques for intrusion detection in smart grids.
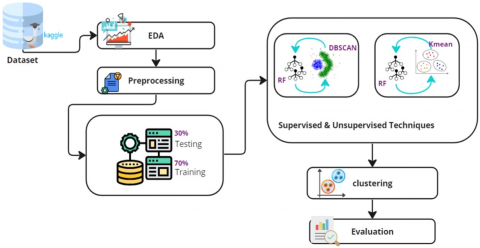
In our methodological approach, we commence by sourcing our dataset from Kaggle. With the data at hand, an exploratory data analysis (EDA) is conducted, enabling us to delve deeply into the underlying patterns and characteristics of the data. Post-analysis, we embark on the preprocessing phase to refine the dataset and make it more conducive for subsequent operations. Our primary innovation lies in the hybrid techniques we employ: combining DBSCAN with RF and juxtaposing it with the integration of K-means with RF. These combinations aim to harness both the power of clustering (unsupervised learning) and classification (supervised learning) to enhance intrusion detection capabilities. Following the hybrid modeling, clustering techniques are applied to further segment and categorize the data. The culmination of our process is the evaluation phase, where the efficacy of our proposed methods is rigorously tested and benchmarked. Figure 1 succinctly encapsulates our methodology in a visual flowchart. Each of these stages will be elaborated upon in the subsequent subsections as shown in Figure 2.
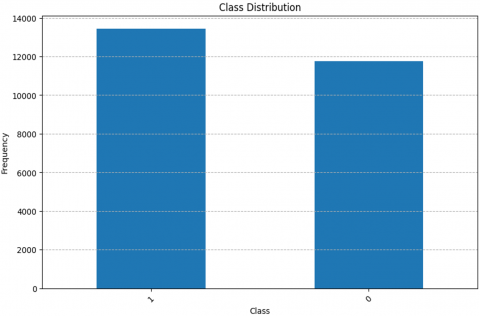
Figure 1. The class distribution of a dataset
Figure 2. Proposed flowchart
3.1 Dataset
Our study utilizes a dataset derived from a sophisticated simulation that replicates a typical United States Air Force Local Area Network (LAN), aimed at capturing a diverse range of cyber-attacks within a realistic network environment. The study we conducted required authentic TCP/IP dump data, which this configuration provided. Each connection in the dataset is a sequence of TCP packets sent between a source and a target IP address over a defined duration using specific protocols. These connections are carefully classified as 'regular' or 'anomalous' and assigned an attack type.
The dataset is detailed, with 100 bytes per TCP/IP connection. It has 41 attributes—3 qualitative and 38 quantitative. Protocol type, service, and complex metrics like failed login attempts and service request rates are included.
It defines 13,449 cases as 'Normal' and 11,743 as 'Anomalous' across 22,544 rows and 41 columns. A complete network intrusion susceptibility analysis needs this balance. Evaluation of hybrid intrusion detection models is supported. The variables'duration', 'protocol_type','service', and 'flag' show the network's normal and compromised activities. Content diversity and balanced class distribution help understand network operations, making the dataset appropriate for intrusion detection research.
In Figure 1, 13,449 'Normal' network connections are '0' while 11,743 'Anomalous' connections are '1'.
3.2 Exploratory data analysis
Researchers need exploratory data analysis (EDA) to understand dataset complexity and patterns. This method finds anomalies, outliers, distributions, and assumptions using visual and quantitative data analysis.
EDA visualized "Normal" and "Anomalous" linkages for our dataset using simulated military networks. Balance—or potential imbalance—was obvious between these classes. Histograms, scatter plots, and box plots showed 41 qualitative and quantitative factors' distribution and links. The means, medians, standard deviations, and interquartile ranges of each feature were estimated. This highlighted the data's main trend and distribution.
We also created correlation matrix heatmaps to understand how features link, which could help with feature selection or engineering.
Visual cues and statistical testing detected anomalies and outliers that could bias our models. We performed a preliminary feature priority ranking to determine which qualities may be more important in selecting connection kinds.
In summary, the EDA step helped us grasp the dataset's features and guide preprocessing and modeling.
3.3 Preprocessing
The data analysis pipeline requires preprocessing to prepare and shape the dataset for modeling. In this phase, data quality is improved by several activities. We preprocessed our dataset as follows:
After these preprocessing steps, our dataset was clean and ready for research.
3.4 Dataset splitting
Dataset partitioning is necessary before model training and testing. This ensures that we have different data sets for training and testing our model. A solid split prevents overfitting and helps the model generalise to new data.
Recent research on dataset splitting ratios in machine learning algorithms supports a 70-30 data split for training and testing [1, 2]. Muraina [35] emphasized the importance of dataset splitting ratios in determining machine learning model parameters that best fit training data. Muraina [35] found that partitioning datasets into train and test sets is essential for model training and assessment after experimenting with 50:50, 60:40, 70:30, 80:20, and 90:10. Joseph [36] also recommended a splitting ratio of p: 1, where p is the number of parameters in a linear regression model that describes the data effectively.
Given this, we chose the typical 70-30 split ratio for our study.
It’s worth noting that while splitting, care was taken to ensure that both training and test sets are representative of the overall dataset, maintaining the inherent distribution of ‘Normal’ and ‘Anomalous’ connections. This is essential to ensure unbiased training and accurate performance evaluation.
3.5 Hybrid supervised and unsupervised techniques
Leveraging the strengths of both supervised and unsupervised learning paradigms, we introduced a hybrid approach aimed at enhancing the intrusion detection capabilities. This innovative methodology seeks to combine the structured, label-dependent learning of supervised techniques with the pattern discovery prowess of unsupervised ones. We merged RF with DBSCAN and K-means clustering methods in our study.
We want to combine the strengths of supervised and unsupervised learning in our hybrid approach. The fusion enhances feature space and more. The enhanced feature set helps RF understand data structure and analyze more thoroughly by introducing cluster assignments. Clustering and classification enable the hybrid model discover threats in complex situations like intrusion detection. DBSCAN strengthens the model's tolerance to noise and outliers, helping it find data anomalies.
However, this integrated strategy has limitations. Clustering increases RF classification computing and training time. Also, changing K-means and DBSCAN parameters substantially impacts performance. Poor configuration can reduce clustering efficiency and model performance. Finally, cluster quality determines RF classifier success.
Poor clustering could confuse the RF algorithm, causing erroneous classifications. Despite these shortcomings, the hybrid model's ability to improve forecast accuracy and robustness, especially in complex and ambiguous domains, makes it valuable to intrusion detection.
3.6 Clustering
Clustering is a key unsupervised learning approach that organizes a dataset into clusters where instances in the same group are more similar than those in other groups. Clustering can help identify patterns, categorize intrusions, and identify new threats in intrusion detection.
Our strategy used two popular clustering algorithms:
Analyzing the clusters after clustering revealed the segmented groups' features. This step is vital to comprehend the variety of intrusions and the inherent patterns within the dataset. Moreover, the clusters serve as foundational inputs for subsequent modeling stages, especially in the hybrid supervised-unsupervised approach we’ve adopted.
3.7 Evaluation
Our IDS needs stringent evaluation criteria to prove its usefulness and dependability. These metrics reveal model performance and guide revisions and iterations. We used standard evaluation metrics in our research.
$Accuracy =\frac{T P+T N}{T P+T N+F P+F N}$ (1)
$Precision =\frac{T P}{T P+F P}$ (2)
$Recall =\frac{T P}{T P+F N}$ (3)
$F 1-score =2 \times \frac{Precision \times Recall }{ Precision + Recall }$ (4)
$Recall =\frac{T N}{T N+F P}$ (5)
These metrics collectively offer a holistic view of the model’s performance, ensuring it not only identifies attacks with precision but also minimizes false alarms. They are paramount in upholding the trustworthiness and operational reliability of the IDS.
4.1 Performance of RF+DBSCAN hybrid model
The hybrid model of RF combined with DBSCAN was tested on the dataset, and the results were particularly promising.
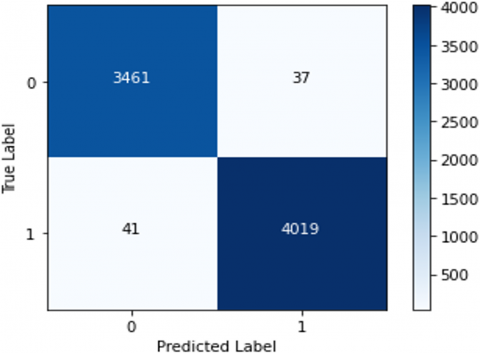
The confusion matrix (Figure 3) showcased an impressive distinction between the predicted and actual values. Out of 3498 instances of class 0, 3486 were correctly predicted, while 12 were falsely classified. Similarly, out of 4060 instances of class 1, 4045 were correctly predicted, with only 15 misclassifications.
The classification report (Table 2) further emphasizes the model’s robustness. Both the classes 0 and 1 achieved precision, recall, and F1-score values close to 1.00, underscoring the model’s adeptness in accurate predictions and minimizing false positives and negatives. The accuracy of the model stands at a notable 0.9964, signifying its ability to produce correct outcomes for almost 99.64% of the tested instances.
Figure 3. Confusion matrix RF+K-means
Table 2. Performance metrics for the RF+K-means
|
Metric |
Value |
|
Accuracy |
0.9964 |
|
Precision (class 0) |
1.00 |
|
Precision (class 1) |
1.00 |
|
Recall (class 0) |
1.00 |
|
Recall (class 1) |
1.00 |
|
Sensitivity |
0.9963 |
|
Specificity |
0.9965 |
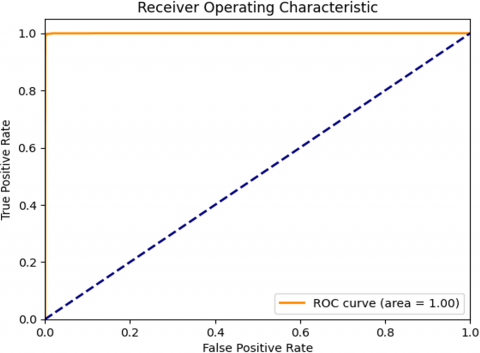
Figure 4. ROC curve of RF+K-means
Further, the model showcased a sensitivity (or true positive rate) of 0.9963, indicating its prowess in identifying and classifying the true positives. The specificity, at 0.9965, highlights the model’s capability to correctly identify the true negatives.
The Receiver Operating Characteristic (ROC) curve depicted in Figure 4, which pertains to the K-means+RF hybrid model, is an exemplary illustration of the model's exceptional performance in discriminating between the 'Normal' and 'Anomalous' classes. The area under the curve (AUC) value is 1.00, which is the maximum possible and represents a perfect classification model. In practice, an AUC of 99.98%, still indicates an extremely high level of separability, meaning that the model has an almost perfect ability to differentiate between all positive and negative instances. The ROC curve in the graph's top-left corner shows that the model can identify true positives without increasing false positives, a crucial trait of an IDS.
Our RF+K-means model's performance claims were supported by a more rigorous statistical investigation. We generated the Area Under the Curve (AUC) statistic's 95% confidence interval to assess the model's ability to distinguish across classes. We found a 95% confidence interval for the AUC of [1.000, 1.000], indicating that the model's performance is not due to chance and that its prediction capability is extremely reliable.
This tight interval underscores the model's robustness and the precision of our performance metrics.
In essence, the hybrid RF+K-means model demonstrates substantial potential as an effective tool for intrusion detection, delivering precise and reliable outcomes across various performance metrics.
4.2 Performance of RF+DBSCAN hybrid model
The performance of the hybrid model that integrated RF with DBSCAN clustering was also evaluated, and the results manifested a high level of efficiency and accuracy as demonstrated in Table 3.
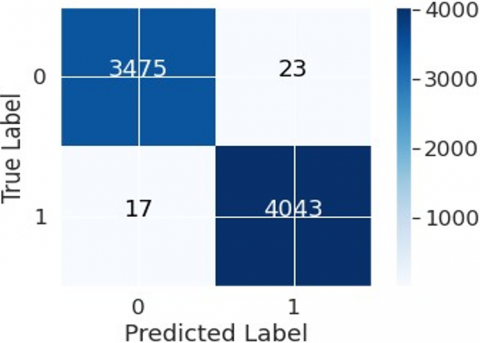
An examination of the confusion matrix (Figure 5) for this model portrays an exceptional differentiation between the real and anticipated classifications. From a total of 3498 instances belonging to class 0, 3487 were accurately categorized while only 11 were misclassified. On the other hand, from the 4060 instances of class 1, a remarkable 4048 were correctly identified, leaving a mere 12 instances that were inaccurately predicted. The classification report (Table 3) fortifies the conclusion about the model’s outstanding proficiency. Both classes 0 and 1 scored near perfect values for precision, recall, and the F1-score, emphasizing the model’s dexterity in accurate detection while concurrently reducing both type I and type II errors. An impressive accuracy of approximately 99.70% denotes the model’s adeptness in consistently producing correct results.
Table 3. Performance metrics for the RF+DBSCAN
|
Metric |
Value |
|
Accuracy |
0.9970 |
|
Precision (class 0) |
1.00 |
|
Precision (class 1) |
1.00 |
|
Recall (class 0) |
1.00 |
|
Recall (class 1) |
1.00 |
|
Sensitivity |
0.9970 |
|
Specificity |
0.9969 |
Figure 5. Confusion matrix RF+DBSCAN
Moreover, the model exhibited a sensitivity of about 0.9970, underscoring its effectiveness in correctly classifying positive instances. The specificity score, standing close to 0.9969, reiterates the model’s competence in discerning true negatives.
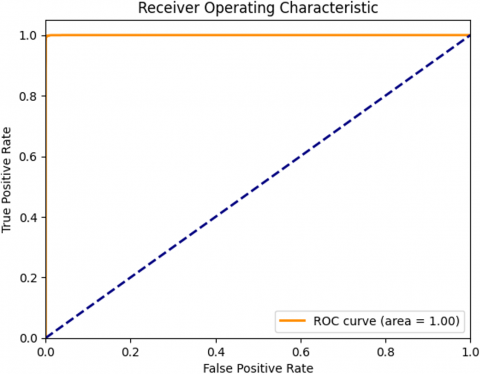
Figure 6 showcases the ROC curve for an RF+DBSCAN hybrid model, and it exhibits an almost perfect performance with a stated ROC AUC of 99.99%. Such a high AUC value demonstrates that the model has an exceptional ability to differentiate between the 'Normal' and 'Anomalous' classes in the dataset. The curve closely follows the left-hand border and then the top border of the ROC space, indicating that the model has a high true positive rate and a very low false positive rate. This suggests that the RF+DBSCAN model is highly skilled at identifying true anomalies as such, without mistakenly classifying normal behavior as an anomaly, which is crucial for minimizing false alarms in an intrusion detection context.
The statistical rigor of the RF+DBSCAN model's performance evaluation has been enhanced by calculating the 95% confidence interval for the AUC metric. This interval [1.000, 1.000] proves that the model's excellent discrimination is constant and trustworthy. This substantial statistical confidence in the model's AUC supports its class distinction performance.
In conclusion, like K-means, the hybrid RF+DBSCAN model is a vital intrusion detection tool with unsurpassed precision and dependability across performance parameters.
Figure 6. ROC curve of RF+DBSCAN
4.3 Performance of ensemble learning without hyperparameter tuning
Table 4 shows the ensemble learning model's performance metrics without hyperparameter tuning.
Table 4. Performance metrics for the ensemble model without hyperparameter tuning
|
Metric |
Value |
|
Accuracy |
0.989 |
|
Precision (class 0) |
0.99 |
|
Precision (class 1) |
0.99 |
|
Recall (class 0) |
0.99 |
|
Recall (class 1) |
0.99 |
|
Sensitivity |
0.989 |
|
Specificity |
0.989 |
Its 98.9% accuracy shows that this model classified most events correctly. The confusion matrix as shown in Figure 7, sheds light on the distribution: Here, minor misclassifications can be observed for both classes, but they are considerably low.
Figure 7. Ensemble learning without hyperparameter tuning confusion matrix
4.4 Performance of ensemble learning with hyperparameter tuning
Upon introducing hyperparameter tuning to the ensemble learning model, a distinct improvement in its performance was observed in Table 5. With an accuracy nearing 99.47%, the model has shown enhanced reliability in predictions. The confusion matrix as shown in Figure 8, provides a clearer insight: The misclassifications were further minimized in this tuned model, reinforcing the benefits of hyperparameter optimization.
Table 5. Performance metrics for the ensemble model with hyperparameter tuning
|
Metric |
Value |
|
Accuracy |
0.9947 |
|
Precision (class 0) |
1.00 |
|
Precision (class 1) |
0.99 |
|
Recall (class 0) |
0.99 |
|
Recall (class 1) |
1.00 |
|
Sensitivity |
0.9958 |
|
Specificity |
0.9934 |
Figure 8. Ensemble learning hyperparameter tuning confusion matrix
In conclusion, while the ensemble model showcased strong performance even without tuning, the incorporation of hyperparameter optimization further solidified its efficiency, leading to even more reliable outcomes.
4.5 Comparison between RF+DBSCAN and RF+K-means models
Having assessed the performance metrics of both the RF+DBSCAN and RF+K-means models, a side-by-side comparison aids in understanding the nuances between their performances. Both models showcased high degrees of accuracy, precision, and recall, signifying their capability to detect and classify intrusions efficiently. However, slight differences exist between the two, which are illustrated in the comparison Table 6.
Table 6. Comparative metrics for RF+DBSCAN vs RF+K-means
|
Metric |
RF+K-Means |
RF+DBSCAN |
|
Accuracy |
0.9964 |
0.9970 |
|
Precision (class 0) |
1.00 |
1.00 |
|
Precision (class 1) |
1.00 |
1.00 |
|
Recall (class 0) |
1.00 |
1.00 |
|
Recall (class 1) |
1.00 |
1.00 |
|
Sensitivity |
0.9963 |
0.9970 |
|
Specificity |
0.9965 |
0.9969 |
While both models exhibited commendable performances, the RF+K-means edged out slightly in terms of accuracy, sensitivity, and specificity. The differences, albeit minimal, could be attributed to the inherent differences in the clustering techniques of DBSCAN and K-means.
However, it’s essential to note that both models performed exceptionally well in the domain of intrusion detection, and the choice between them would largely depend on specific use-cases, computational resources, and data characteristics.
The advent of hybrid methodologies, which amalgamate both supervised and unsupervised approaches, signifies a paradigm shift in intrusion detection systems. The synthesis offers the robustness of supervised models with the versatility of unsupervised techniques, ideally balancing precision with adaptability.
Referring to Table 5, the presented models’ performance across various research efforts is summarized. It becomes evident that while individual models, like Stacking or Random Forest, achieve commendable accuracy, none quite reach the performance pinnacle of the hybrid RF+DBSCAN approach proposed in this research.
Specifically, as illustrated in Table 7 the closest competing model is the stacking approach from the reference [37], registering an accuracy of 97.3%. However, even this impressive figure falls short of the 99.70% achieved by the RF+DBSCAN combination. It’s intriguing to note that the Long Short-term Memory combined with Extreme Boosting, as described by Thapa et al. [21], did not perform as efficiently, which underscores the point that not all hybrid models guarantee top-tier performance. Nonetheless, the superior efficacy of our proposed model reaffirms the potential of judiciously integrating supervised and unsupervised techniques.
Another observation to highlight is the performance of the Random Forest model from Song et al. [22], which achieves an accuracy of 97.01%. This suggests that the Random Forest algorithm, even when used in isolation, exhibits robust performance. Yet, the fusion with DBSCAN in our proposed approach amplifies its potency, pushing the accuracy to a near-perfect score.
The Generative Adversarial Network [26] and the Hierarchical Temporal Memory [27], while employing distinct methodologies, converge around the same accuracy range, further accentuating the varied outcomes different models can achieve when addressing similar problems.
In essence, the results accentuate a pivotal inference: while individual models can achieve remarkable accuracy, their performance can often be enhanced through hybrid methodologies. The synergy of RF+DBSCAN, as proposed, champions this idea, combining the precision of RF with the clustering prowess of DBSCAN. The data shows that this confluence creates an optimal IDS that outperforms its components and several contemporaneous models.
Though powerful in detection, the RF+DBSCAN model requires more computational effort due to clustering and classification. Due to its complexity, the DBSCAN algorithm may take too long to locate clusters for real-time intrusion detection. This hybrid model's efficiency and efficacy depend on DBSCAN's parameter calibration, which if not tuned, could damage it.
RF+DBSCAN's near-perfect accuracy is obvious, but understanding and addressing its computational constraints will be crucial for its real-time adoption. This involves a careful balance between the depth of detection and the necessity for speed, ensuring that the model remains both accurate and agile in live network environments.
Table 7. Comparative analysis with state-of-the-art models
|
References |
Models |
Accuracy (%) |
|
[21] |
Long Short-Term Memory with Extreme Boosting |
88 |
|
[22] |
Random Forest |
97.01 |
|
[23] |
Isolation Forest |
93.01 |
|
[26] |
Generative Adversarial Network |
93 |
|
[27] |
Hierarchical Temporal Memory |
96 |
|
[37] |
Stacking |
97.3 |
|
Proposed model |
RF+DBSCAN |
99.70 |
The constantly shifting terrain of cyber threats demands intrusion detection systems that are both sophisticated and adaptable. Through our research, we highlight the importance of harnessing both supervised and unsupervised learning techniques, which together provide an innovative solution to the shortcomings of conventional intrusion detection methods. Specifically, by deploying hybrid models RF+DBSCAN and RF+K-means on an extensive simulated military network dataset, we demonstrated enhanced efficiency in detecting and exploiting anomalies within the SVM.
These anomalies, often signifying potential breaches or new attack vectors, are invaluable for bolstering security. In fact, the RF+DBSCAN hybrid showcased slightly superior performance, underlining the potency of exploiting these irregularities in the data when combined with established detection techniques.
Furthermore, we emphasized the criticality of meticulous data preprocessing and the selection of pertinent metrics for accurate evaluation, reinforcing the essential steps to harness machine learning models to their fullest potential. Our study’s positive results herald a promising direction for more in-depth exploration of hybrid models, underscoring their prospective mainstream role in cybersecurity applications.
In practical terms, the real-world application of our proposed hybrid models could greatly enhance current security measures. By integrating into existing systems, they offer a robust, adaptive response to evolving threats. The significant impact of such integration is clear: a fortified defense mechanism with higher precision in threat detection, providing a strong foundation for a resilient and comprehensive network security strategy in an increasingly interconnected digital world.
While the current study has shed light on the potential of hybrid IDS, it also lays the foundation for numerous avenues of further exploration. Firstly, as technology and cyber threats continue to evolve, there’s a pressing need to constantly update and refine the datasets being used for training, ensuring they capture the nuances of emerging threats. Future research could extend the adaptability of our model to different types of networks beyond military ones, investigating how it might be scaled or adapted to the unique demands of commercial, industrial, or public sector networks. Additionally, the exploration of other combinations of supervised and unsupervised techniques could uncover synergies leading to even more robust and adaptive systems. Integrating deep learning (DL) architectures, such as Convolutional Neural Networks (CNN) or Recurrent Neural Networks (RNN), with our established models could achieve unprecedented accuracy and adaptability. In terms of application, it is pivotal to assess the effectiveness of these models in real-world scenarios across various sectors, from healthcare to finance, ensuring they are effective and applicable on a broader scale. Considerations for scalability and real-time detection capabilities will be paramount, affirming the practicality and efficacy of these solutions in diverse and dynamic environments.
[1] Qadir, Z., Le, K.N., Saeed, N., Munawar, H.S. (2023). Towards 6G Internet of Things: Recent advances, use cases, and open challenges. ICT Express, 9(3): 296-312. https://doi.org/10.1016/j.icte.2022.06.006
[2] Yazdinejadna, A., Parizi, R.M., Dehghantanha, A., Khan, M.S. (2021). A kangaroo-based intrusion detection system on software-defined networks. Computer Networks, 184: 07688. https://doi.org/10.1016/j.comnet.2020.107688
[3] Hussein, M.A. (2022). Performance analysis of different machine learning models for intrusion detection systems. Journal of Engineering, 28(5): 61-91. https://doi.org/10.31026/j.eng.2022.05.05
[4] Ahmad, Z., Shahid Khan, A., Wai Shiang, C., Abdullah, J., Ahmad, F. (2021). Network intrusion detection system: A systematic study of machine learning and deep learning approaches. Transactions on Emerging Telecommunications Technologies, 32(1): e4150. https://doi.org/10.1002/ett.4150
[5] Atlam, H.F., Wills, G.B. (2020). IoT security, privacy, safety and ethics. Digital Twin Technologies and Smart Cities, 123-149. https://doi.org/10.1007/978-3-030-18732-3_8
[6] Alsulami, B., Almalawi, A., Fahad, A. (2022). Toward an efficient automatic self-augmentation labeling tool for intrusion detection based on a semi-supervised approach. Applied Sciences, 12(14): 7189. https://doi.org/10.3390/app12147189
[7] Saheed, Y.K., Abiodun, A.I., Misra, S., Holone, M.K., Colomo-Palacios, R. (2022). A machine learning-based intrusion detection for detecting internet of things network attacks. Alexandria Engineering Journal, 61(12): 9395-9409. https://doi.org/10.1016/j.aej.2022.02.063
[8] Aljuhani, A. (2021). Machine learning approaches for combating distributed denial of service attacks in modern networking environments. IEEE Access, 9: 42236-42264. https://doi.org/10.1109/ACCESS.2021.3062909
[9] Al-Khassawneh, Y.A. (2023). An investigation of the Intrusion detection system for the NSL-KDD dataset using machine-learning algorithms. In 2023 IEEE International Conference on Electro Information Technology (eIT), pp. 518-523. https://doi.org/10.1109/eIT57321.2023.10187360
[10] Zhong, N.N., Wang, H.Q., Huang, X.Y., Li, Z.Z., Cao, L.M., Huo, F.Y., Liu, B., Bu, L.L. (2023). Enhancing head and neck tumor management with artificial intelligence: Integration and perspectives. In Seminars in Cancer Biology. Academic Press. https://doi.org/10.1016/j.semcancer.2023.07.002
[11] Liu, Y., Wang, J., Li, J., Niu, S., Song, H. (2021). Machine learning for the detection and identification of Internet of Things devices: A survey. IEEE Internet of Things Journal, 9(1): 298-320. https://doi.org/10.1109/JIOT.2021.3099028
[12] Al-Sabbagh, K.S., Ali, H.M., Abbas, E.S. (2012). Development an anomaly network intrusion detection system using neural network. Journal of Engineering, 18(12): 1325-1334. https://doi.org/10.31026/j.eng.2012.12.03.
[13] Xiong, W., Legrand, E., Åberg, O., Lagerström, R. (2022). Cyber security threat modeling based on the MITRE Enterprise ATT&CK Matrix. Software and Systems Modeling, 21(1): 157-177. https://doi.org/10.1007/s10270-021-00898-7
[14] Saleem, I., Shukr, B.K. (2023). Techniques and challenges for generation and detection face morphing attacks: A survey. Iraqi Journal of Science, 385-404. https://doi.org/10.24996/ijs.2023.64.1.36
[15] Hei, X., Yin, X., Wang, Y., Ren, J., Zhu, L. (2020). A trusted feature aggregator federated learning for distributed malicious attack detection. Computers & Security, 99: 102033. https://doi.org/10.1016/j.cose.2020.102033
[16] Khoei, T.T., Aissou, G., Hu, W.C., Kaabouch, N. (2021). Ensemble learning methods for anomaly intrusion detection system in smart grid. In 2021 IEEE International Conference on Electro Information Technology (EIT), Mt. Pleasant, MI, USA, pp. 129-135. https://doi.org/10.1109/EIT51626.2021.9491891
[17] Khoei, T.T., Ismail, S., Kaabouch, N. (2021). Boosting-based models with tree-structured parzen estimator optimization to detect intrusion attacks on smart grid. In 2021 IEEE 12th Annual Ubiquitous Computing, Electronics & Mobile Communication Conference (UEMCON), New York, NY, USA, pp. 165-170. https://doi.org/10.1109/UEMCON53757.2021.9666607
[18] El Mrabet, Z., El Ghazi, H., Kaabouch, N. (2019). A performance comparison of data mining algorithms based intrusion detection system for smart grid. In 2019 IEEE International Conference on Electro Information Technology (EIT), Brookings, SD, USA, pp. 298-303. https://doi.org/10.1109/EIT.2019.8834255
[19] Anthi, E., Williams, L., Słowińska, M., Theodorakopoulos, G., Burnap, P. (2019). A supervised intrusion detection system for smart home IoT devices. IEEE Internet of Things Journal, 6(5): 9042-9053. https://doi.org/10.1109/JIOT.2019.2926365
[20] Talaei Khoei, T., Ismail, S., Shamaileh, K.A., Devabhaktuni, V.K., Kaabouch, N. (2022). Impact of dataset and model parameters on machine learning performance for the detection of GPS spoofing attacks on unmanned aerial vehicles. Applied Sciences, 13(1): 383. https://doi.org/10.3390/app13010383
[21] Thapa, N., Liu, Z., Kc, D.B., Gokaraju, B., Roy, K. (2020). Comparison of machine learning and deep learning models for network intrusion detection systems. Future Internet, 12(10): 167. https://doi.org/10.3390/fi12100167
[22] Song, C., Sun, Y., Han, G., Rodrigues, J.J. (2021). Intrusion detection based on hybrid classifiers for smart grid. Computers & Electrical Engineering, 93: 107212. https://doi.org/10.1016/j.compeleceng.2021.107212
[23] Roy, D.D., Shin, D. (2019). Network intrusion detection in smart grids for imbalanced attack types using machine learning models. In 2019 International Conference on Information and Communication Technology Convergence (ICTC), Jeju, Korea (South), pp. 576-581. https://doi.org/10.1109/ICTC46691.2019.8939744
[24] Arora, P., Kaur, B., Teixeira, M.A. (2021). Evaluation of machine learning algorithms used on attacks detection in industrial control systems. Journal of the Institution of Engineers (India): Series B, 102(3): 605-616. https://doi.org/10.1007/s40031-021-00563-z
[25] Yao, R., Wang, N., Liu, Z., Chen, P., Sheng, X. (2021). Intrusion detection system in the advanced metering infrastructure: A cross-layer feature-fusion CNN-LSTM-based approach. Sensors, 21(2): 626. https://doi.org/10.3390/s21020626
[26] Yang, H., Wang, F. (2019). Wireless network intrusion detection based on improved convolutional neural network. IEEE Access, 7: 64366-64374. https://doi.org/10.1109/ACCESS.2019.2917299
[27] Wang, Y., Zhang, Z., Ma, J., Jin, Q. (2021). KFRNN: An effective false data injection attack detection in smart grid based on Kalman filter and recurrent neural network. IEEE Internet of Things Journal, 9(9): 6893-6904. https://doi.org/10.1109/JIOT.2021.3113900
[28] Majidi, S.H., Hadayeghparast, S., Karimipour, H. (2022). FDI attack detection using extra trees algorithm and deep learning algorithm-autoencoder in smart grid. International Journal of Critical Infrastructure Protection, 37: 100508. https://doi.org/10.1016/j.ijcip.2022.100508
[29] Ahmed, S., Lee, Y., Hyun, S.H., Koo, I. (2019). Unsupervised machine learning-based detection of covert data integrity assault in smart grid networks utilizing isolation forest. IEEE Transactions on Information Forensics and Security, 14(10): 2765-2777. https://doi.org/10.1109/TIFS.2019.2902822
[30] Menon, D.M., Radhika, N. (2016). Anomaly detection in smart grid traffic data for home area network. In 2016 International Conference on Circuit, Power and Computing Technologies (ICCPCT), pp. 1-4. https://doi.org/10.1109/ICCPCT.2016.7530186
[31] Radoglou Grammatikis, P., Sarigiannidis, P., Efstathopoulos, G., Panaousis, E. (2020). ARIES: A novel multivariate intrusion detection system for smart grid. Sensors, 20(18): 5305. https://doi.org/10.3390/s20185305
[32] Karimipour, H., Dehghantanha, A., Parizi, R.M., Choo, K.K.R., Leung, H. (2019). A deep and scalable unsupervised machine learning system for cyber-attack detection in large-scale smart grids. IEEE Access, 7: 80778-80788. https://doi.org/10.1109/ACCESS.2019.2920326
[33] Barua, A., Muthirayan, D., Khargonekar, P.P., Al Faruque, M.A. (2020). Hierarchical temporal memory based machine learning for real-time, unsupervised anomaly detection in smart grid: WiP abstract. In 2020 ACM/IEEE 11th International Conference on Cyber-Physical Systems (ICCPS), pp. 188-189. https://doi.org/10.1109/ICCPS48487.2020.00027
[34] Hu, C., Yan, J., Liu, X. (2020). Adaptive feature boosting of multi-sourced deep autoencoders for smart grid intrusion detection. In 2020 IEEE Power & Energy Society General Meeting (PESGM), pp. 1-5. https://doi.org/10.1109/PESGM41954.2020.9281934
[35] Muraina, I.O. (2022). Ideal dataset splitting ratios in machine learning algorithms: General concerns for data scientists and data analysts. In 7th International Mardin Artuklu Scientific Research Conference, Mardin, Turkey, pp. 496-504.
[36] Joseph, V.R. (2022). Optimal ratio for data splitting. Statistical Analysis and Data Mining: The ASA Data Science Journal, 15(4): 531-538. https://doi.org/10.1002/sam.11583
[37] Smadi, A.A., Ajao, B.T., Johnson, B.K., Lei, H., Chakhchoukh, Y., Abu Al-Haija, Q. (2021). A Comprehensive survey on cyber-physical smart grid testbed architectures: Requirements and challenges. Electronics, 10(9): 1043. https://doi.org/10.3390/electronics10091043